
Sharpe Ratio
Sharpe Ratio: How to Evaluate Risk-Adjusted Portfolio Returns
What is Sharpe Ratio?
The Sharpe Ratio is a risk-adjusted performance metric used in investing. It measures how much excess return a portfolio earns for each unit of total risk, where risk is defined as the portfolio’s standard deviation of returns. Unlike raw returns, the Sharpe Ratio considers both ups and downs, making it especially useful for comparing portfolios with different volatility levels.
What does Sharpe Ratio tell you?
The Sharpe Ratio tells you how efficiently a portfolio converts risk into return.
Why is Sharpe Ratio important?
- Two portfolios may have the same return, but one may have smooth, consistent performance or the other may experience large swings.
- The Sharpe Ratio rewards consistency and efficiency, not just high returns. This makes it useful for comparing portfolios, evaluating fund managers, and assessing whether higher returns are worth the added volatility
What is a good Sharpe Ratio?
A Sharpe Ratio above 1.0 is often considered strong, while values below 0.5 suggest limited risk-adjusted value.
What is a typical range for Sharpe Ratio?
At RecipeInvesting.com, the Sharpe Ratios (for the 20 years ending November 2025) range as follows:
Portfolio Recipes (investable model portfolios)
- Low: 0.20 — Vanguard Market Neutral, Investor Class (VMNFX)
- High: 1.16 — Adaptive Allocation F (t.aaaf)
Portfolio Ingredients (asset class ETFs)
- Low: 0.07 — Invesco Commodity (DBC)
- High: 0.78 — Invesco QQQ Trust (QQQ)
These ranges depend heavily on the time period selected. Including at least one market downturn (e.g., a bear market) typically gives a more realistic measure of standard deviation. View full Sharpe Ratio rankings on the Portfolio Recipes comparison page.
What do specific Sharpe Ratio values mean?
- Sharpe Ratio = 0
The portfolio is providing no return for the extra risk taken. - Sharpe Ratio = 0.5
The portfolio provides only 0.5% return per 1% of portfolio risk. Risk is only partially rewarded. - Sharpe Ratio = 1
That a portfolio gets 1% of return for 1% of risk (as measured by standard deviation). This is possibly a decent trade since you are getting compensated for the risk you are taking.
What is the formula for Sharpe Ratio?
The formula for calculating the Sharpe Ratio is:
$$\text{Sharpe ratio} = \frac{R_p - R_f}{\sigma_p}$$
Where:
- Rp = portfolio return
- Rf = risk-free rate
- σp = standard deviation of the portfolio
How do you calculate Sharpe Ratio?
The Sharpe Ratio calculation has three steps:

Step 1 Start with the portfolio’s return.
- Example: the Adaptive Asset Allocation F Portfolio (t.aaaf) has an annualized return of 14.8% over the past 20 years.
Step 2 Subtract the risk-free return.
- Next, subtract the risk-free return, typically based on 3-month U.S. Treasury bills.
- This isolates the portion of the portfolio’s return that exceeds what an investor could have earned without taking any market risk.
- Example: the risk-free return is 0.31%, so the excess return is 14.8% - 0.31 %, which is 14.49%
Step 3 Divide the excess return by the portfolio’s standard deviation.
- Now divide the excess return by the portfolio’s standard deviation of returns, which measures total portfolio volatility, including both gains and losses.
- Standard deviation for t.aaaf (20 years): 12.3%.
- A Sharpe Ratio of 1.16 means the portfolio earned 1.16 units of excess return for every 1 unit of total risk taken.
- Because standard deviation is in the denominator, lower volatility leads to a higher Sharpe Ratio and higher volatility leads to a lower Sharpe Ratio.
- The Sharpe Ratio evaluates how efficiently a portfolio converts volatility into return, not just how high the return is.
- All RecipeInvesting.com Portfolio Recipes and Portfolio Ingredients calculate Sharpe Ratios using this same methodology, the same risk-free rate assumption, and consistent time periods, allowing for fair, apples-to-apples comparisons across portfolios.
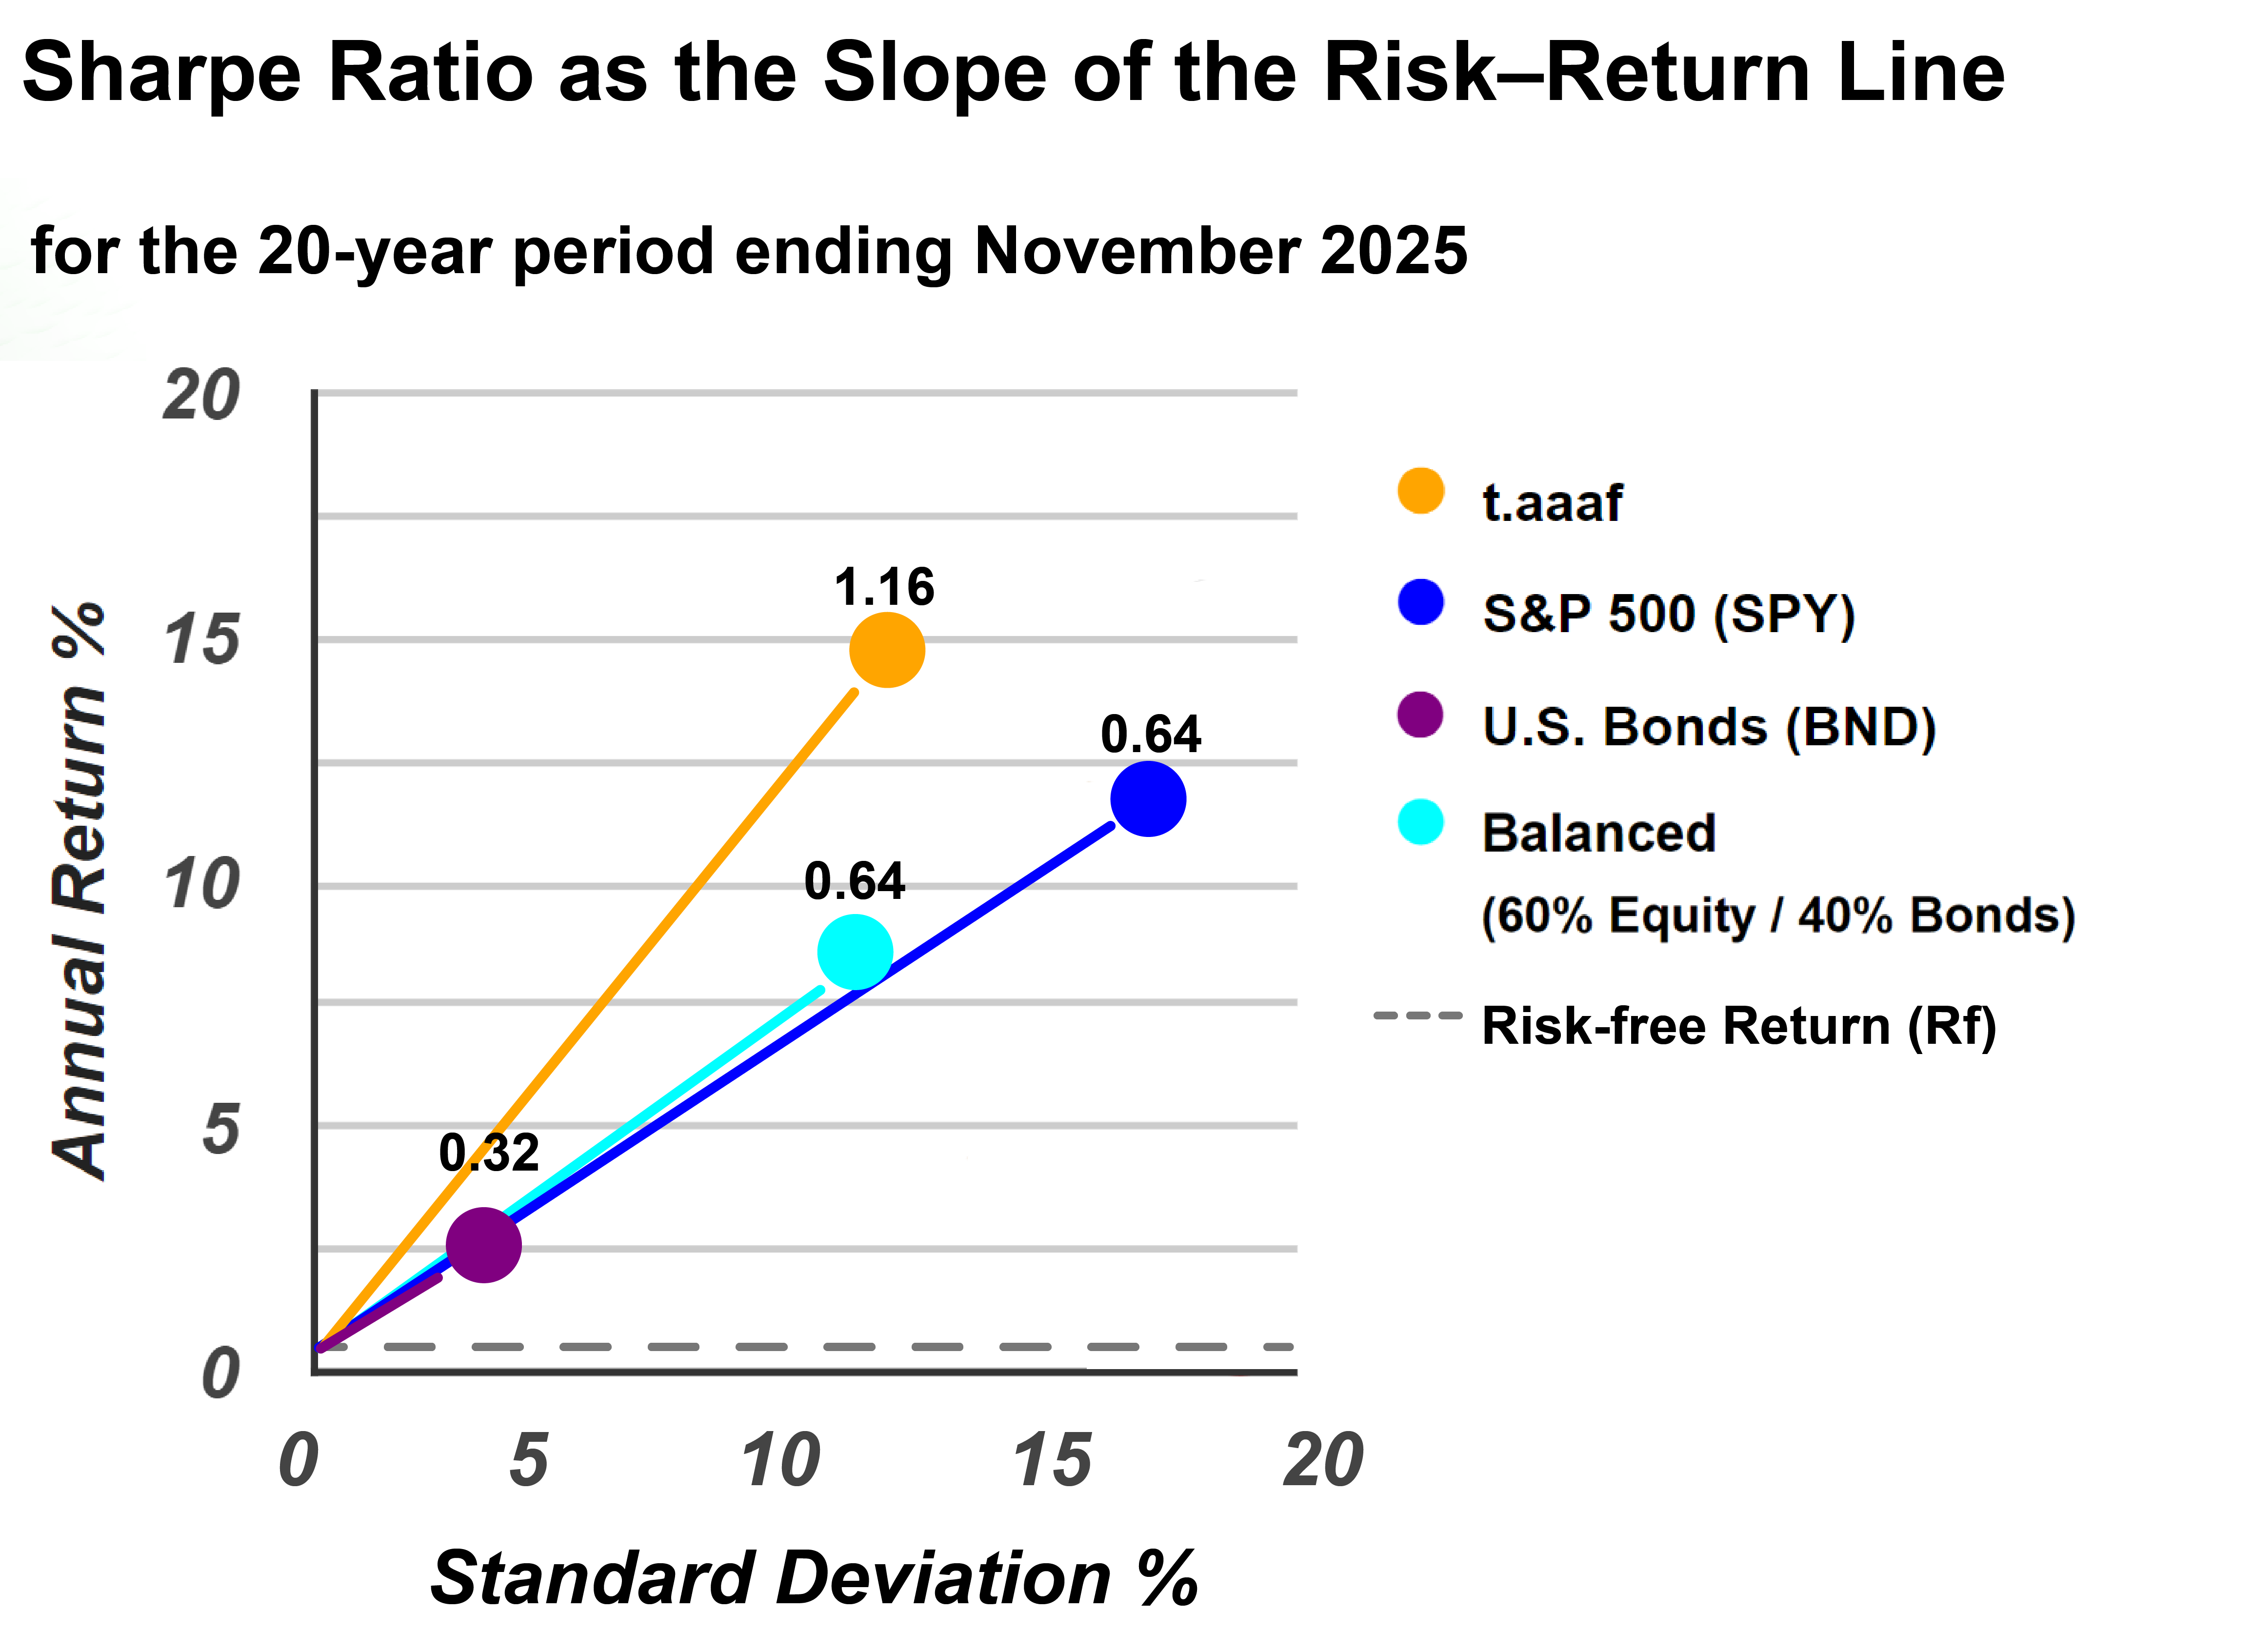
Can you explain Sharpe Ratio graphically?
Graphically, the Sharpe Ratio can be visualized as return on the vertical axis and risk (volatility) on the horizontal axis. Portfolios with higher Sharpe Ratios sit higher on the chart for the same level of risk while lower Sharpe Ratios require more volatility to achieve similar returns. The Sharpe Ratio effectively measures the slope of the line from the risk-free rate to the portfolio’s return point.
What is the Sharpe Ratios for example portfolios?
Below are Sharpe Ratios for six sample portfolios, calculated over a 20-year period ending November 2025:
| Portfolio | Ticker / ID | Description | Risk Level | Sharpe Ratio | Annualized Return | Standard Deviation |
| 1-3 Year Treasury Bond Fund | SHY | short-term bond fund | low | 0.11 | 2.0% | 1.5% |
| Total Bond Market Fund | BND | aggregate U.S. bond fund | low | 0.32 | 3.3% | 4.6% |
| Balanced Portfolio | s.6040 | 60% stocks / 40% bond fund | moderate | 0.64 | 8.0% | 10.7% |
| S&P 500 Fund | SPY | large-cap U.S. stocks | moderate | 0.64 | 10.9% | 16.8% |
| Nasdaq-100 Index Fund | QQQ | tech-heavy growth stocks | high | 0.78 | 15.4% | 21.2% |
| Adaptive Asset Allocation F | t.aaaf | tactical Portfolio Recipe | very high | 1.16 | 14.8% | 12.3% |
What’s the difference between Sharpe Ratio and Sortino Ratio?
- Sharpe Ratio uses total volatility (upside and downside using standard deviation) as its metric for risk adjustment.
- Sortino Ratio uses downside volatility only as its metric for risk adjustment.
For investors who want to avoid punishing positive returns, the Sharpe Ratio is often more meaningful.
What topics are related to Sharpe Ratio?