
Treynor Ratio
Treynor Ratio: Evaluating Portfolio Performance per Unit of Market Risk
What is Treynor Ratio?
Treynor Ratio is a risk-adjusted performance measure that shows how much excess return a portfolio earns for each unit of market-related risk, as measured by beta. Instead of looking at total volatility, the Treynor Ratio focuses only on systematic risk, the risk that comes from exposure to the overall market and cannot be diversified away.
What does Treynor Ratio tell you?
The Treynor Ratio tells you how much excess return a portfolio generates per unit of systematic (market) risk.
Why is Treynor Ratio important?
- The Treynor Ratio is important because not all risk matters equally. Some risk can be diversified away and market risk (beta) cannot.
- The Treynor Ratio isolates this unavoidable risk and shows whether a portfolio is being rewarded for taking it. This makes it particularly useful for evaluating diversified portfolios, comparing active strategies to passive benchmarks, and assessing whether higher returns are due to skill or simply higher market exposure.
What is a good Treynor Ratio?
A higher Treynor Ratio means more excess return per unit of market risk. Negative values indicate underperformance relative to the risk-free rate after accounting for beta.
What is a typical range for Treynor Ratio?
At RecipeInvesting.com, the Treynor Ratios (for the 20 years ending November 2025) range as follows:
Portfolio Recipes (investable model portfolios)
- Low: 0.5 — Invesco International Dividend Achievers (PID)
- High: 79.0 — Vanguard Market Neutral, Investor Class (VMNFX)
Portfolio Ingredients (asset class ETFs)
- Low: -15.8 — iShares 1–3 Year Treasury Bond (SHY)
- High: 12.3 — SPDR Gold Shares (GLD)
These ranges depend heavily on the time period selected. Including at least one market downturn (e.g., a bear market) typically gives a more realistic measure of beta. View full Treynor Ratio rankings on the Portfolio Recipes comparison page.
What do specific Treynor Ratio values mean?
- Treynor Ratio = -2
The portfolio is underperforming relative to the risk taken, generating 2 less return per unit of beta than the risk-free rate. This suggests poor risk-adjusted performance. - Treynor Ratio = 0
The portfolio is providing no excess return above the risk-free rate for the market risk taken, making it an inefficient use of risk. - Treynor Ratio = 3
The portfolio earns 3 excess return per 1 unit of beta, indicating a reasonable reward for systematic risk. - Treynor Ratio = 6
The portfolio generates 6 excess return per unit of beta, suggesting strong risk-adjusted performance and efficient portfolio management.
What is the formula for Treynor Ratio?
The formula for calculating the Treynor Ratio is:
$$\text{Treynor ratio} = \frac{R_p - R_f}{\beta_p}$$
Where:
- Rp = portfolio return
- Rf = risk-free rate
- βp = beta of the portfolio
How do you calculate Treynor Ratio?
The Treynor Ratio calculation has three steps:
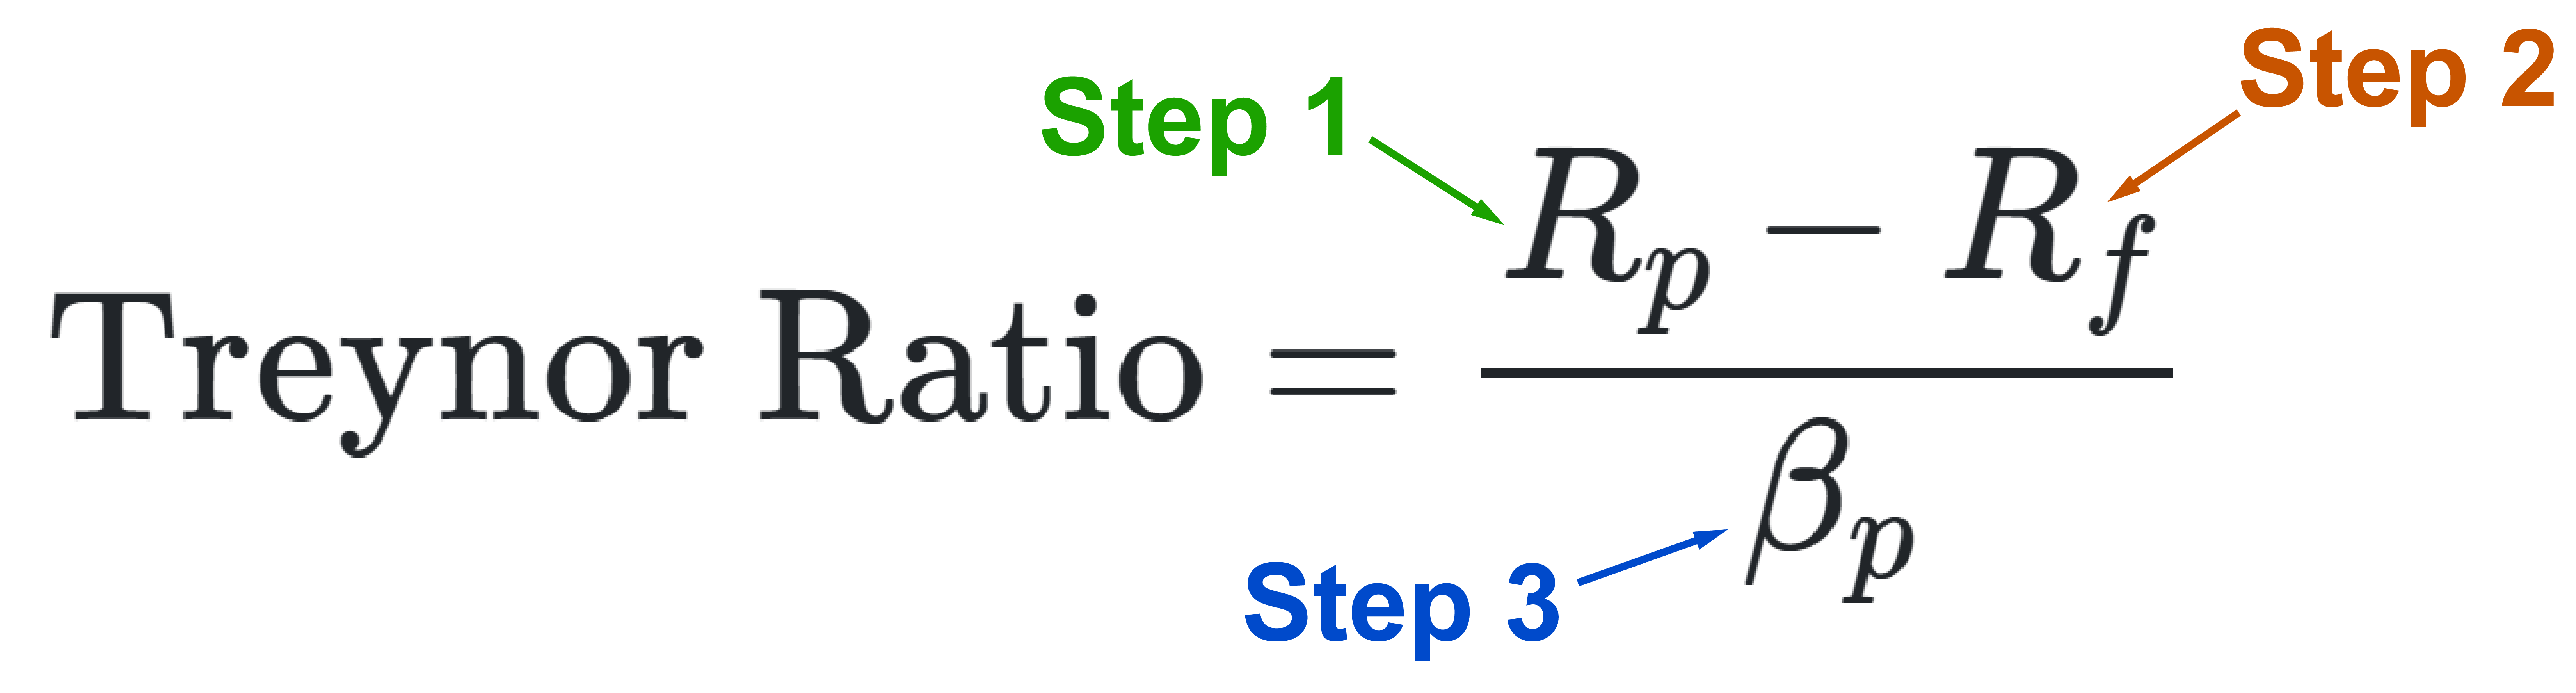
Step 1 Start with the portfolio’s return.
- Example: the Adaptive Asset Allocation F Portfolio (t.aaaf) has an annualized return of 14.8% over the past 20 years.
Step 2 Subtract the risk-free return.
- Next, subtract the risk-free return, typically based on 3-month U.S. Treasury bills.
- This isolates the portion of the portfolio’s return that exceeds what an investor could have earned without taking any market risk.
- Example: the risk-free return is 0.31%, so the excess return is 14.8% - 0.31 %, which is 14.49%
Step 3 Divide the excess return by the portfolio’s beta.
- Beta measures how sensitive the portfolio is to movements in the overall market.
- A beta less than 1 means the portfolio is less volatile than the market.
- A beta greater than 1 means it is more volatile.
- Example: the beta (over 20 years) for the Adaptive Asset Allocation F Portfolio (t.aaaf) is 0.38, so the excess return of 14.49% divided by 0.38 is 3.8, which is the Treynor Ratio for t.aaaf.
- Because beta is in the denominator, a lower beta (less market risk) produces a higher Treynor Ratio. A higher beta (more market risk) produces a lower Treynor Ratio.
- In this way, the Treynor Ratio expresses risk-adjusted performance, showing how much excess return the portfolio generates for each unit of systematic (market) risk it takes on.
Can you explain Treynor Ratio graphically?
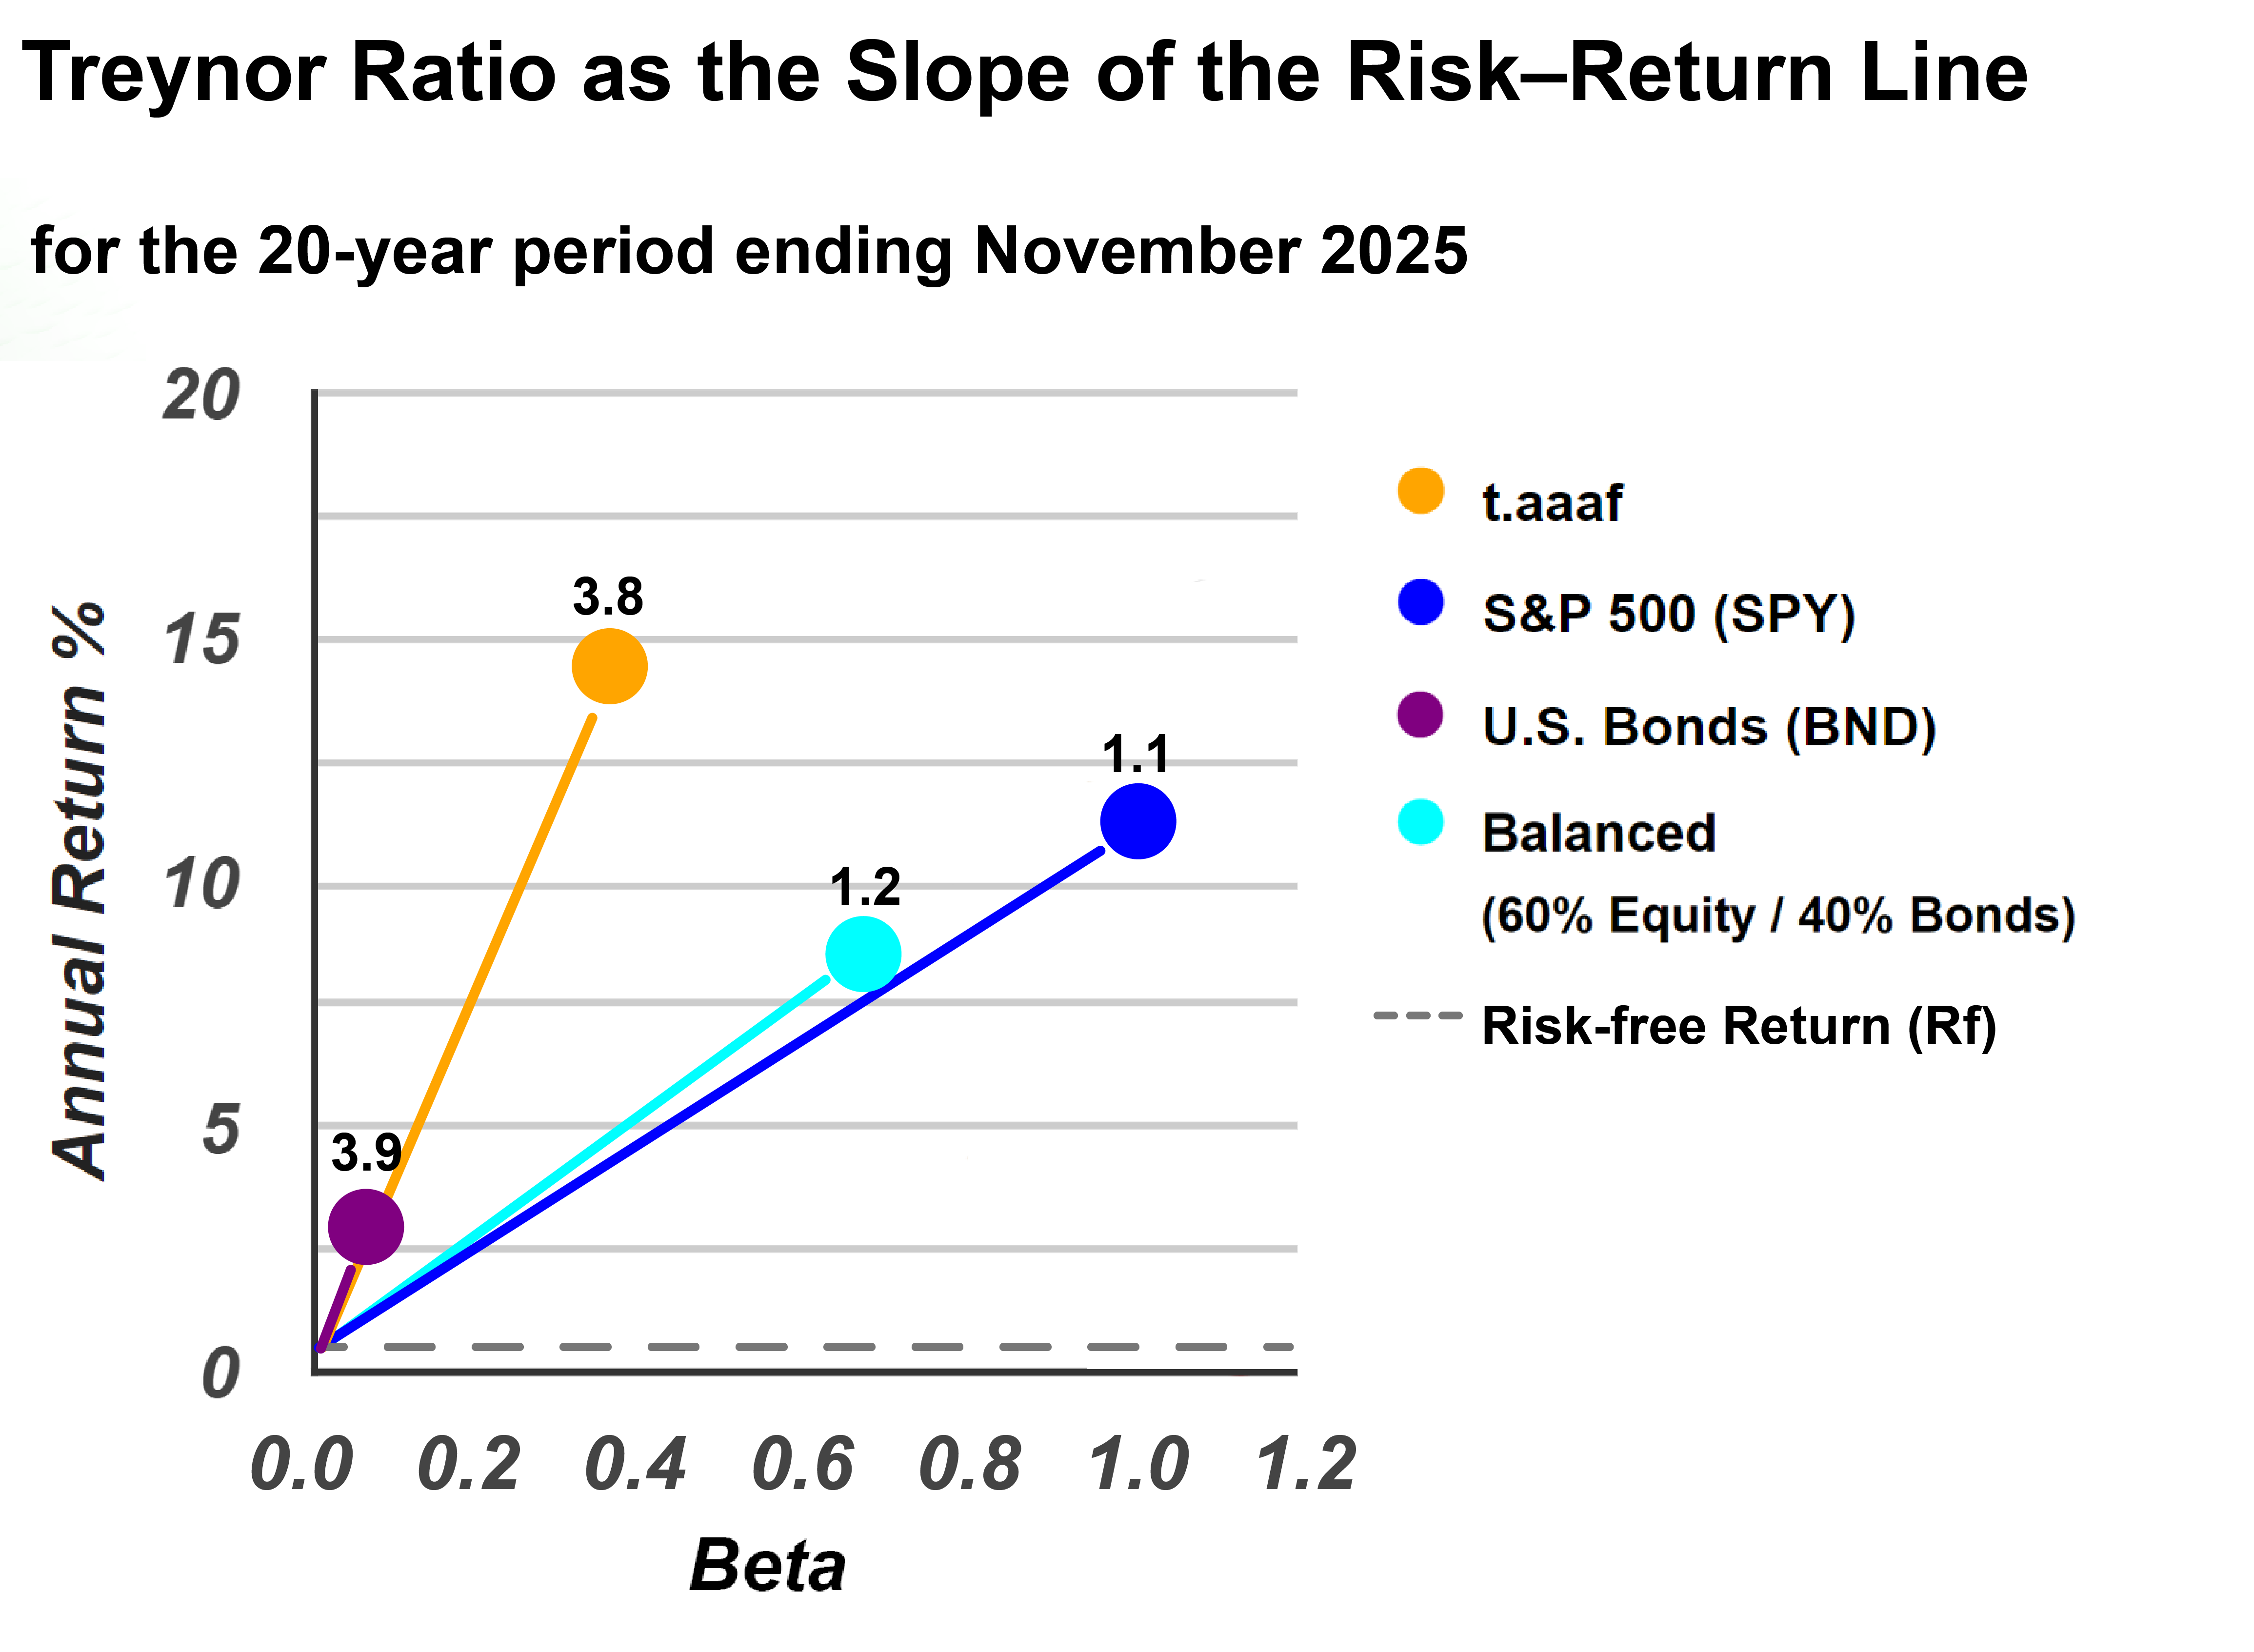
Graphically, the Treynor Ratio can be visualized by plotting return on the vertical axis and beta (market risk) on the horizontal axis. Portfolios with higher Treynor Ratios appear higher on the chart for the same level of beta and form steeper slopes when measured from the risk-free rate. In this way, the Treynor Ratio represents the slope of the line connecting the risk-free rate to a portfolio’s return, showing how much excess return is earned for each unit of market risk taken.
What is the Treynor Ratios for example portfolios?
Below are Treynor Ratios for six sample portfolios, calculated over a 20-year period ending November 2025:
| Portfolio | Ticker / ID | Description | Risk Level | Treynor Ratio | Annualized Return | Beta |
| 1-3 Year Treasury Bond Fund | SHY | short-term bond fund | low | -15.8 | 2.0% | -0.01 |
| Total Bond Market Fund | BND | aggregate U.S. bond fund | high | 3.9 | 3.3% | 0.08 |
| Balanced Portfolio | s.6040 | 60% stocks / 40% bond fund | moderate | 1.2 | 8.0% | 0.65 |
| S&P 500 Fund | SPY | large-cap U.S. stocks | moderate | 1.1 | 10.9% | 1.0 |
| Nasdaq-100 Index Fund | QQQ | tech-heavy growth stocks | high | 1.4 | 15.4% | 1.11 |
| Adaptive Asset Allocation F | t.aaaf | tactical Portfolio Recipe | high | 3.8 | 14.8% | 0.38 |
Note: The Treynor Ratio can become unusually low or unusually high when a portfolio’s beta is close to zero. Because beta appears in the denominator of the calculation, even small positive or negative beta values can produce extreme Treynor Ratio values, depending on whether the beta is slightly positive or slightly negative.
What’s the difference between Treynor Ratio and Sharpe Ratio?
- Treynor Ratio isolates exposure to market movements
- Sharpe Ratio penalizes both upside and downside volatility
Investors focused on market-relative risk often prefer the Treynor Ratio, while those focused on overall volatility may prefer the Sharpe Ratio.
What topics are related to Treynor Ratio?