
Beta
Beta in Investing: How Your Portfolio Moves with the Market
What is Beta?
Beta measures how much an investment portfolio tends to move compared with the overall market, usually a benchmark like the S&P 500.
What does Beta tell you?
Beta tells you the portfolio’s market sensitivity. A beta of 1 means it tends to move with the market, above 1 means it may be more volatile, and below 1 means it may be less volatile.
Why is Beta important?
Beta helps investors understand portfolio risk. It shows whether a portfolio is likely to amplify market swings or provide a smoother ride during market ups and downs.
What is a good Beta?
A good beta depends on your risk tolerance. Conservative investors may prefer a beta below 1, while investors seeking higher growth may accept a beta above 1 with greater volatility.
What is a typical range for Beta?
At RecipeInvesting.com, the beta (for the 20 years ending November 2025) range as follows:
- Portfolio Recipes (investable model portfolios)
- Low: 0.00 for Vanguard Market Neutral, Investor Class (VMNFX)
- High: 1.09 for S&P 500 Equal Weight (RSP)
- Portfolio Ingredients (asset class ETFs)
- Low: 0.07 for Invesco Commodity (DBC)
- High: 1.33 for iShares MSCI Austria ETF (EWO)
Beta values across both portfolio recipes and asset class ETFs span a wide spectrum, ranging from near-zero market neutrality to sensitivity exceeding 1.0. This underscores the importance of beta awareness when building a portfolio, as lower-beta ingredients help dampen volatility while higher-beta assets amplify market movements. Selecting the right mix depends on an investor's risk tolerance and return objectives.
What do specific Beta values mean?
- A beta of -0.1 means the portfolio tends to move slightly in the opposite direction of the market. If the market rises 1%, the portfolio might fall by about 0.1%.
- A beta of 0 means the portfolio tends to move independently of the market. This may apply to cash, some fixed-income investments, or assets whose returns are driven by factors unrelated to the broader market.
- A beta of 0.5 means the portfolio tends to move about half as much as the market. If the market rises 1%, the portfolio might rise by about 0.5%.
- A beta of 1 means the portfolio tends to move about the same amount as the market. If the market rises or falls 1%, the portfolio may move by roughly 1% in the same direction.
What is the formula for Beta?
The formula for calculating beta is:
$$ \beta = \frac{\text{Cov}(R_p - Rf, R_m - Rf)}{\text{Var}(R_m - Rf)} $$
Where:
- Rp-Rf = portfolio return
- Rm-Rf = market return
- Cov(Rp-Rf, Rm-Rf) = covariance between the portfolio returns and the market returns
- Var(Rm-Rf) = variance of the market returns
How do you calculate Beta?
- Calculate the portfolio's excess returns
- First, calculate the portfolio's annual returns over the selected time period.
- Then subtract the risk-free rate, typically based on 3-month U.S. Treasury bills.
- This shows how much return the portfolio earned above what an investor could have earned without taking market risk.
- Calculate the market's excess returns
- Next, calculate the market's annual returns over the same time period.
- Subtract the same risk-free rate from the market's returns.
- This creates a consistent comparison between the portfolio and the broader market.
- Compare the portfolio's movements to the market's movements
- Beta is calculated by measuring how the portfolio's excess returns move relative to the market's excess returns.
- More specifically, beta equals the covariance between the portfolio's excess returns and the market's excess returns, divided by the variance of the market's excess returns.
- This shows whether the portfolio tends to move more, less, or about the same as the market.
Can you explain Beta graphically?
The scatter plot displays 10 years of annual data, with each dot representing one calendar year (2016–2025). It plots:
- X-axis — How much the market (SPY) returned above the risk-free rate that year
- Y-axis — How much the t.aaaf portfolio returned above the risk-free rate that same year
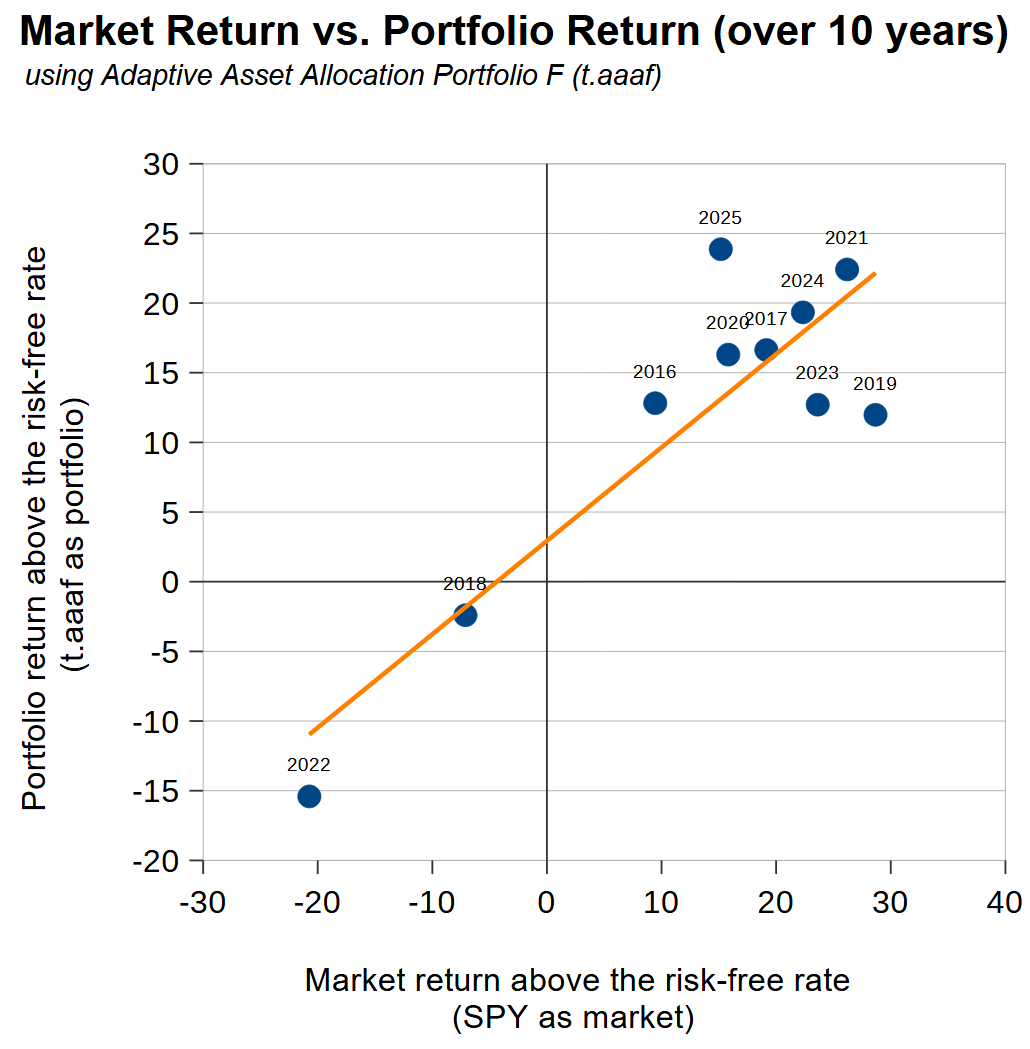
The orange line is the key. It is the best-fit line through all the data points, and its slope represents the Beta.
When the market had a bad year (e.g., 2022, far left), t.aaaf also dropped, but only to about -15% while the market fell to -20%. The portfolio fell less than the market.
When the market had strong years (e.g., 2021, far right), t.aaaf gained around 23% while SPY was up about 28%. Again, it moved less than the market.
This consistent pattern of moving in the same direction as the market but by a smaller amount is exactly what a Beta below 1 looks like visually.
What is the beta for example portfolios?
Beta for six sample portfolios, over a 20 year period ending Nov 2025.
| Portfolio | Ticker / ID | Description | Risk Level | Beta | Annualized Return |
| 1-3 Year Treasury Bond Fund | SHY | short-term bond fund | very low | -0.01 | 2.0% |
| Total Bond Market Fund | BND | aggregate U.S. bond fund | low | 0.08 | 3.3% |
| Balanced Portfolio | s.6040 | 60% stocks / 40% bond fund | medium | 0.65 | 8.0% |
| S&P 500 Fund | SPY | large-cap U.S. stocks | this is "market risk" | 1.0 | 10.9% |
| Nasdaq-100 Index Fund | QQQ | tech-heavy growth stocks | high | 1.11 | 15.4% |
| Adaptive Asset Allocation F | t.aaaf | tactical Portfolio Recipe | decent risk/return tradeoff | 0.38 | 14.8% |
What’s the difference between Beta and Alpha?
- Beta measures market sensitivity. It shows how much a portfolio tends to move compared with the overall market, helping investors understand the portfolio’s level of market-related risk.
- Alpha measures risk-adjusted outperformance. It shows whether a portfolio performed better or worse than expected after accounting for its market risk, helping investors evaluate whether the strategy added value beyond market exposure.