
Standard Deviation
Standard Deviation in Investing: How to Measure Portfolio Volatility
What is Standard Deviation?
Standard Deviation is a percentage showing how much a portfolio’s returns swing up and down compared to its average return. In other words, it's a measure of how spread out the monthly returns are relative to the average monthly return.
What does the Standard Deviation tell you?
The Standard Deviation tells you a portfolio's typical up or down percentage compared to its average, providing a snapshot of its overall volatility. By measuring the "spread" of historical returns, it helps you understand the range of performance you should expect in a normal year.
Why is the Standard Deviation important?
- Standard Deviation defines the risk. A low standard deviation means stable, predictable returns. A high standard deviation means the price swings wildly, representing higher risk.
- It also measures consistency. It helps you identify which investments are "steady" versus those that are "erratic," even if they both end up with the same average return at the end of the year.
What is a good Standard Deviation?
Lower is better, since you want steady growth, not wild swings.
What is a typical range for the Standard Deviation?
This represents the range of standard deviation values for the 20-year period ending November 2025, as tracked by RecipeInvesting.com.
- Portfolio Recipes (investable model portfolios)
- Low (less variation) = 3.4% for Gabelli ABC AAA (GABCX)
- High (more variation) = 20.8% for Pure Momentum (t.pure)
- Portfolio Ingredients (asset class ETFs)
- Low = 1.5% for iShares 1-3 Year Treasury Bond (SHY)
- High of 36.9% for iShares MSCI Brazil ETF (EWZ)
What do specific Standard Deviation values mean?
- 1%: very low risk, gentle fluctuations (e.g., short-term government bonds)
- 5%: low risk, tolerable variation (e.g., bond fund)
- 10%: moderate risk, with notable variation (e.g., balanced fund)
- 15%: high risk, potential large swings (e.g., growth stocks)
- 20%: very high risk, significant variation (e.g., technology stocks)
What is the formula for the Standard Deviation?
$$ \text{Standard Deviation} = \sqrt{\frac{\sum(R - R_{\text{mean}})^2}{\text{n}}} $$
Where:
- R = portfolio return
- Rmean = mean (average) of all portfolio return
- Σ = sum of the terms
- n = total number of observations
- standard deviation = a measure of how spread out or dispersedthe values are relative to the mean
How do you calculate Standard Deviation?
You might initially think that the standard deviation would be calculated by finding the difference from the average for every year, then finding the average of those differences. This would create an "average difference." So why do we square the differences instead, and then take the square root?
Why not just average the differences? Since the ups and downs cancel each other out, this "average difference" would actually be zero, which isn't very helpful.
Then why not just take the absolute value of all differences before averaging them? In this case, -5% would become +5% for the calculation. This calculation does exist, and it's called the Mean Absolute Deviation (MAD).
By squaring the differences instead of using MAD, we gain a couple of advantages:
- Big differences show up as even bigger. This is helpful to investors because it penalizes extreme volatility. For example, if a portfolio's annual returns were +5%, +50%, -5%, and -50%:
- Its MAD would be 27.5%.
- Its Standard Deviation would be 35.5%.
The higher 35.5% figure is often more meaningful to investors who saw their portfolio value cut in half.
- Mathematical Harmony. Other risk-related calculations such as portfolio variance, covariance, and correlation, are easier to perform when using squared differences.
Step-by-Step Calculation
Using a 10-year period of annual returns as an example:
- Get each year's total return (e.g., -4.3% or +5.0%).
- Calculate the average (mean) return over the 20 years.
- Calculate each year's difference from that average.
- Square each difference and calculate the average of those squares. (This emphasizes the larger swings).
- Take the square root of that average. This converts the number back into a percentage, making it easier to understand and compare.
Can you explain Standard Deviation graphically?
Sure. Let's show how the 10-year Standard Deviation is calculated using annual returns.
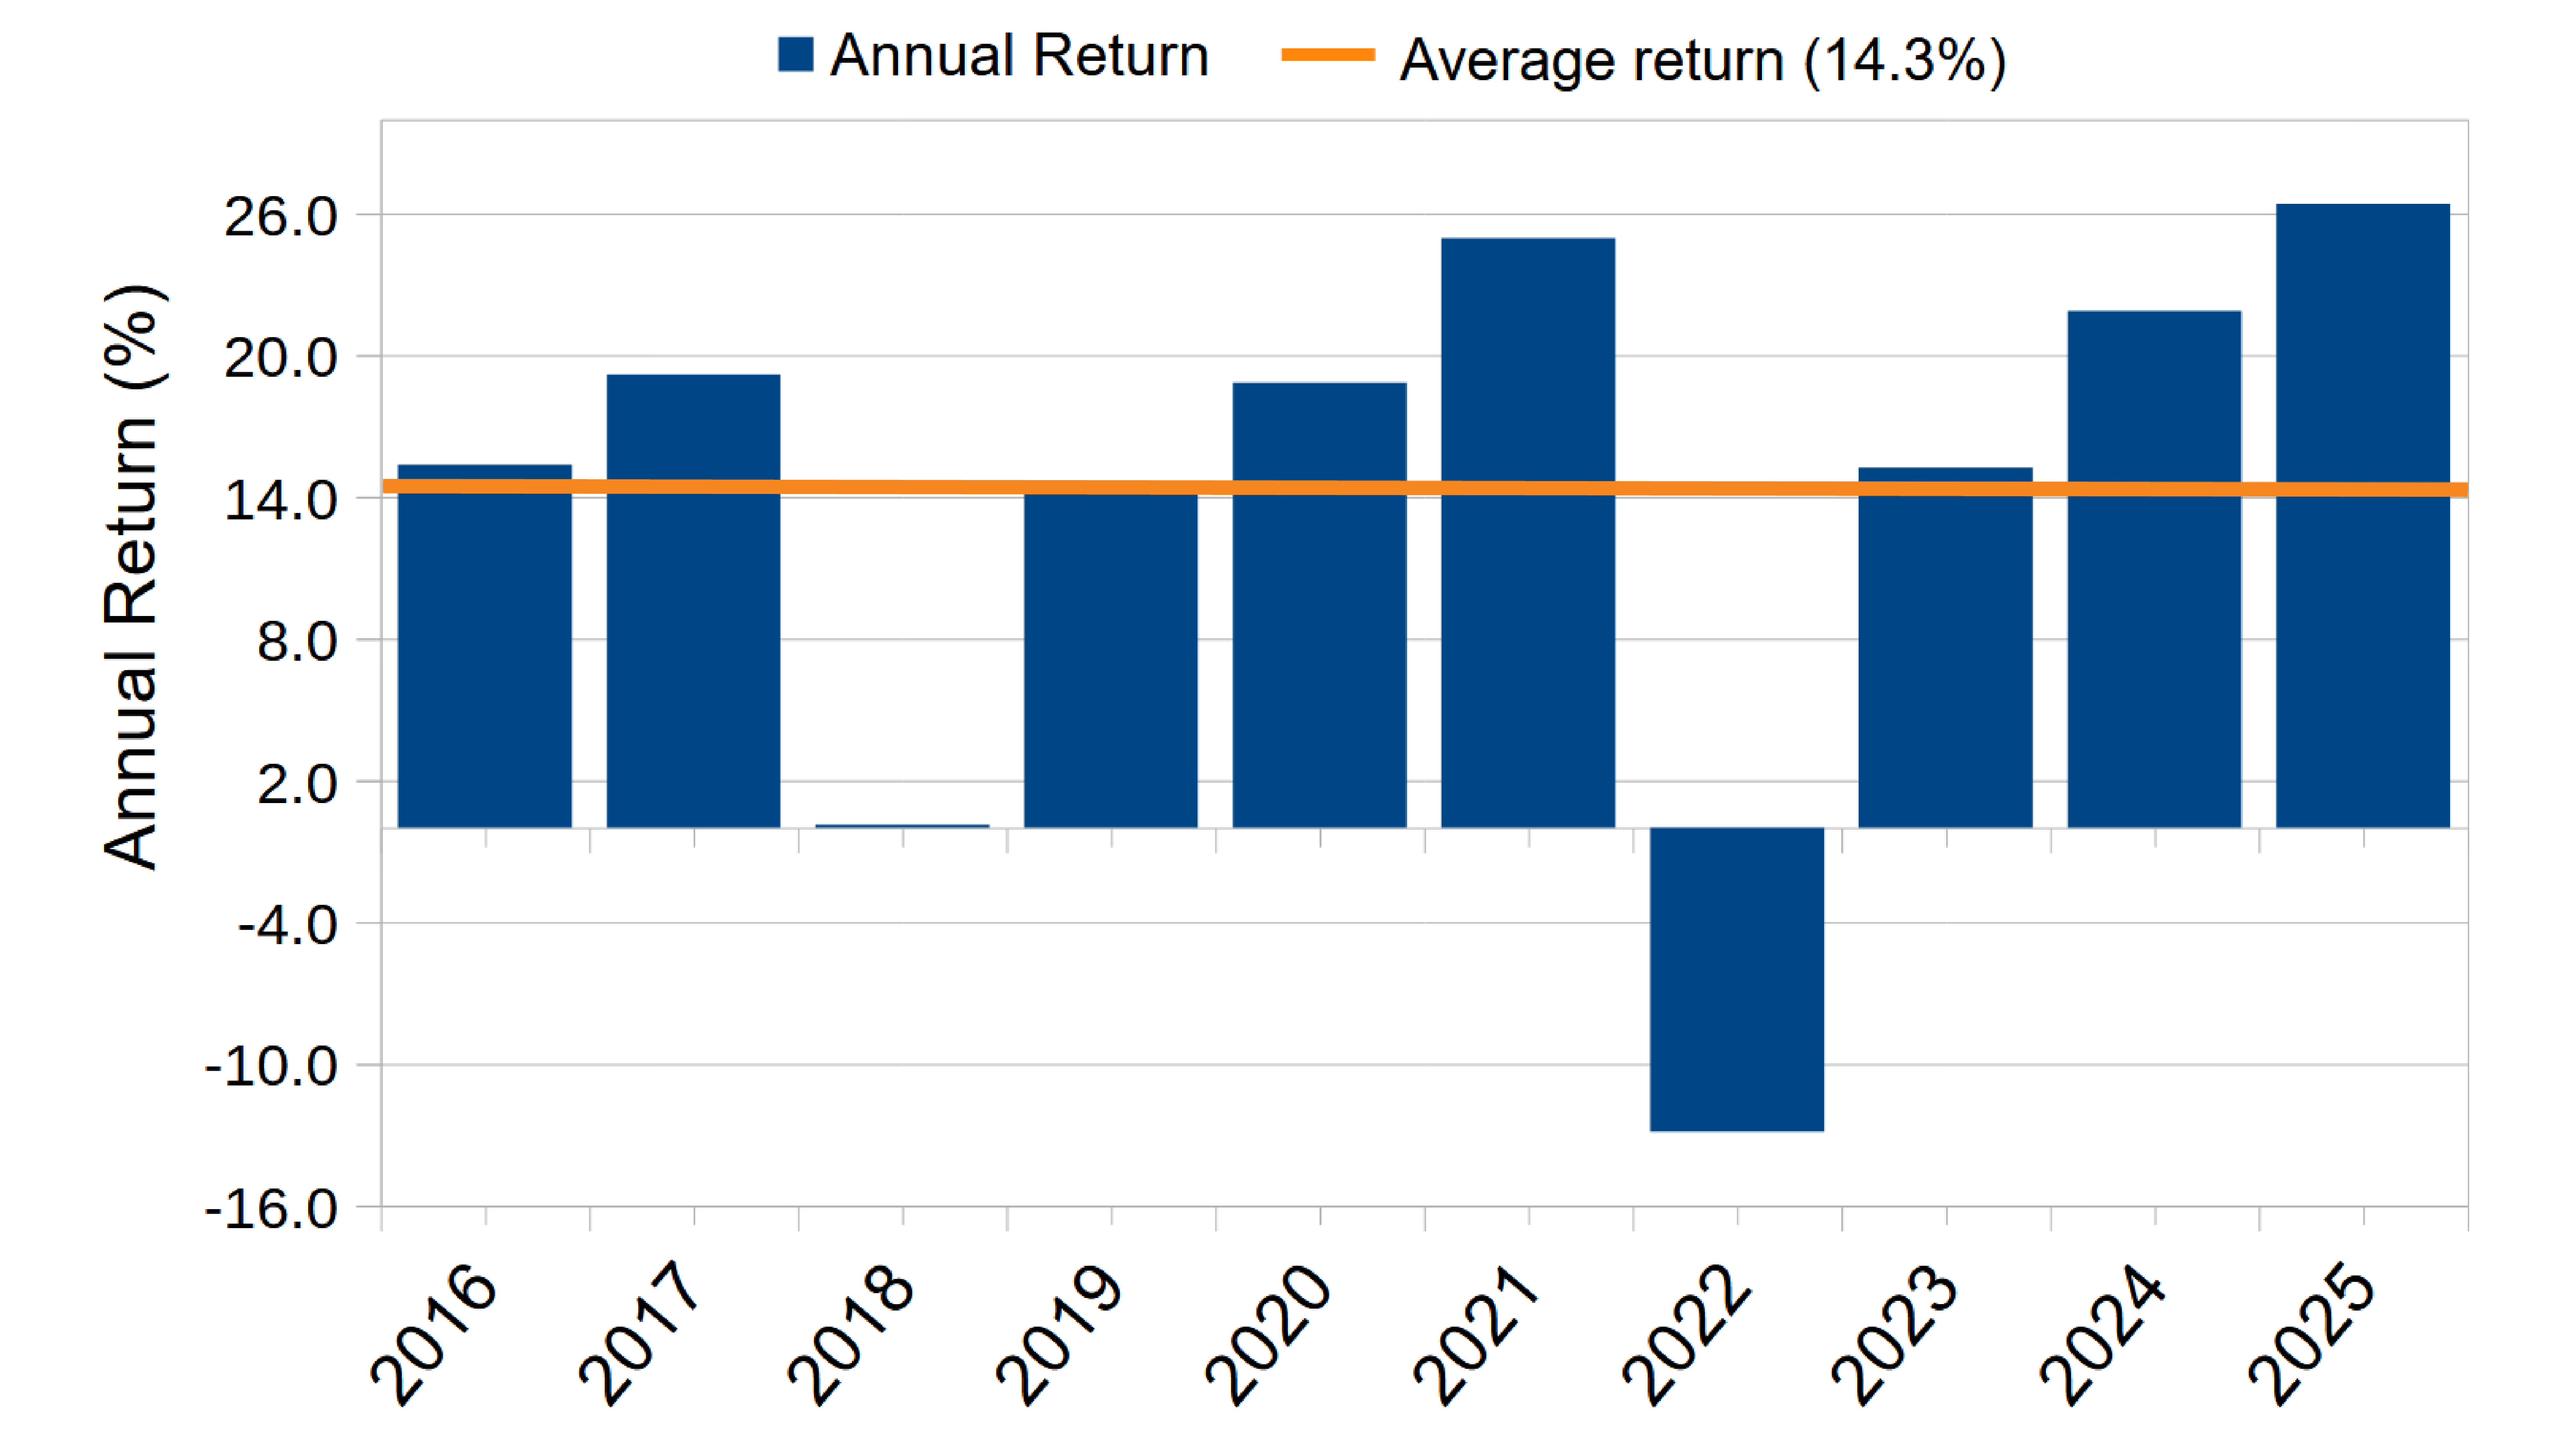
Step 1. Get the total return for each year (shown as blue bars, below) and calculate the average return (orange line)
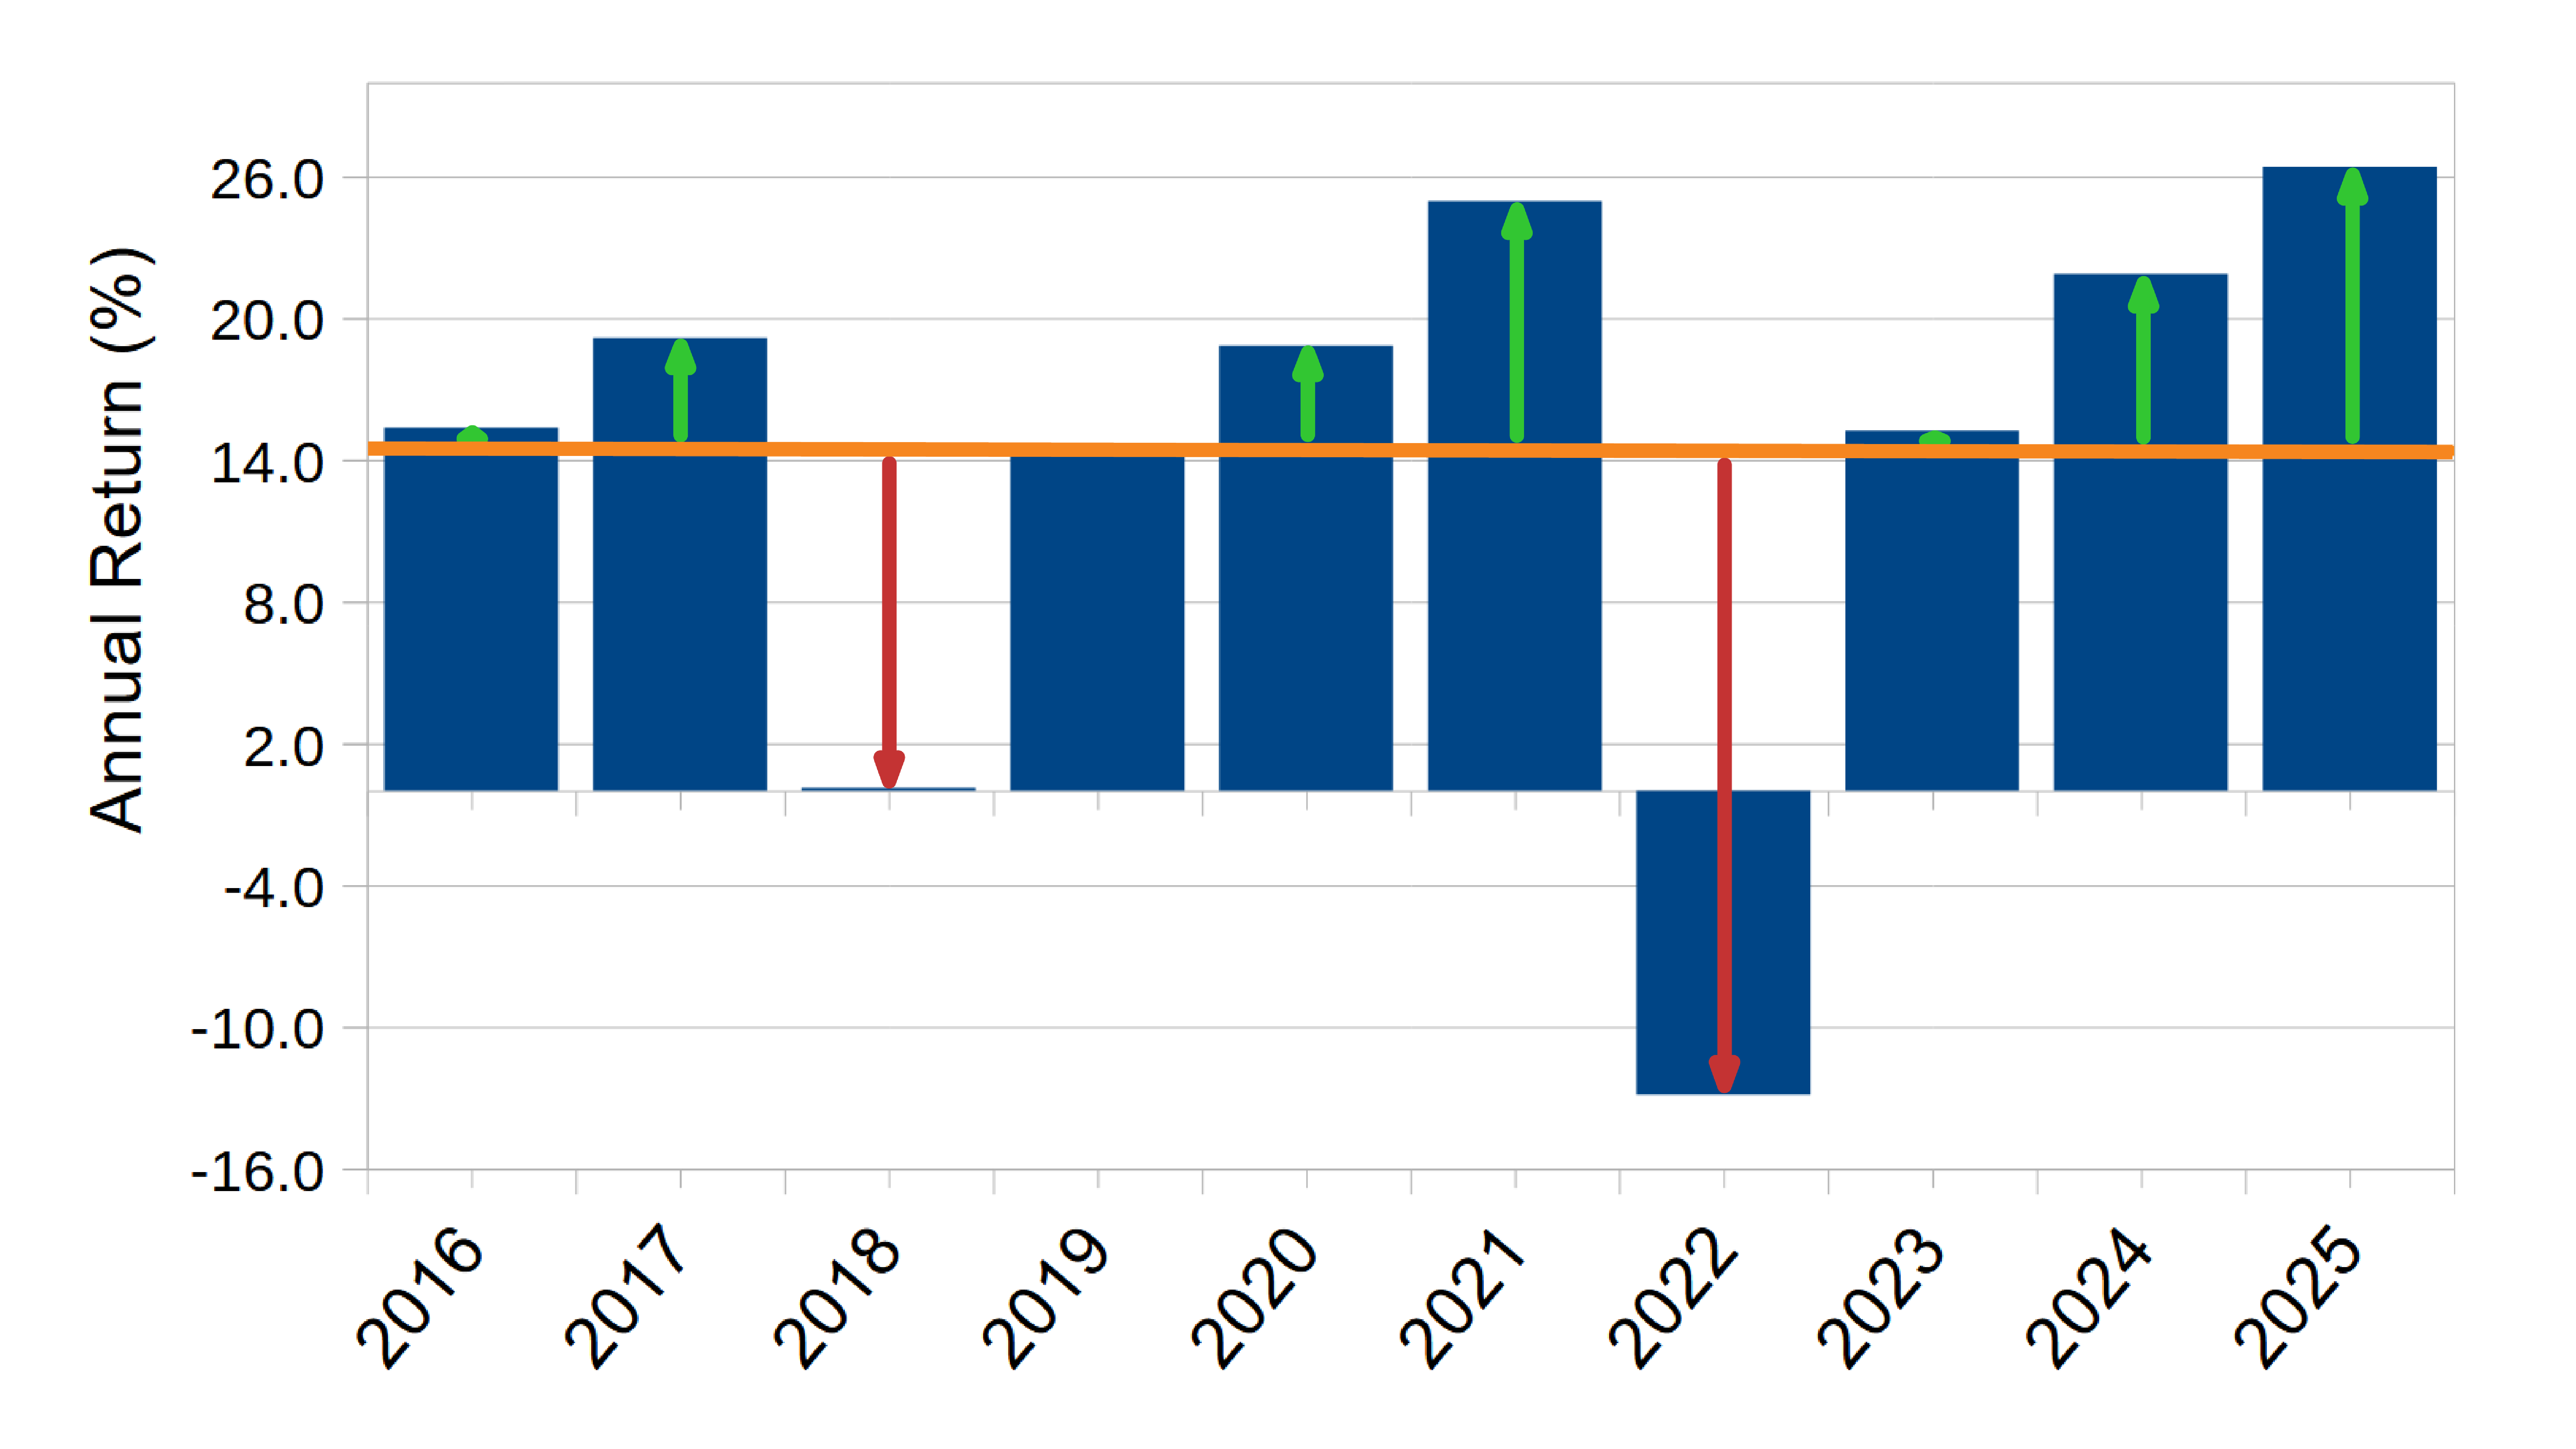
Step 2. Find the difference from the average for each year (shown as green and red arrows)
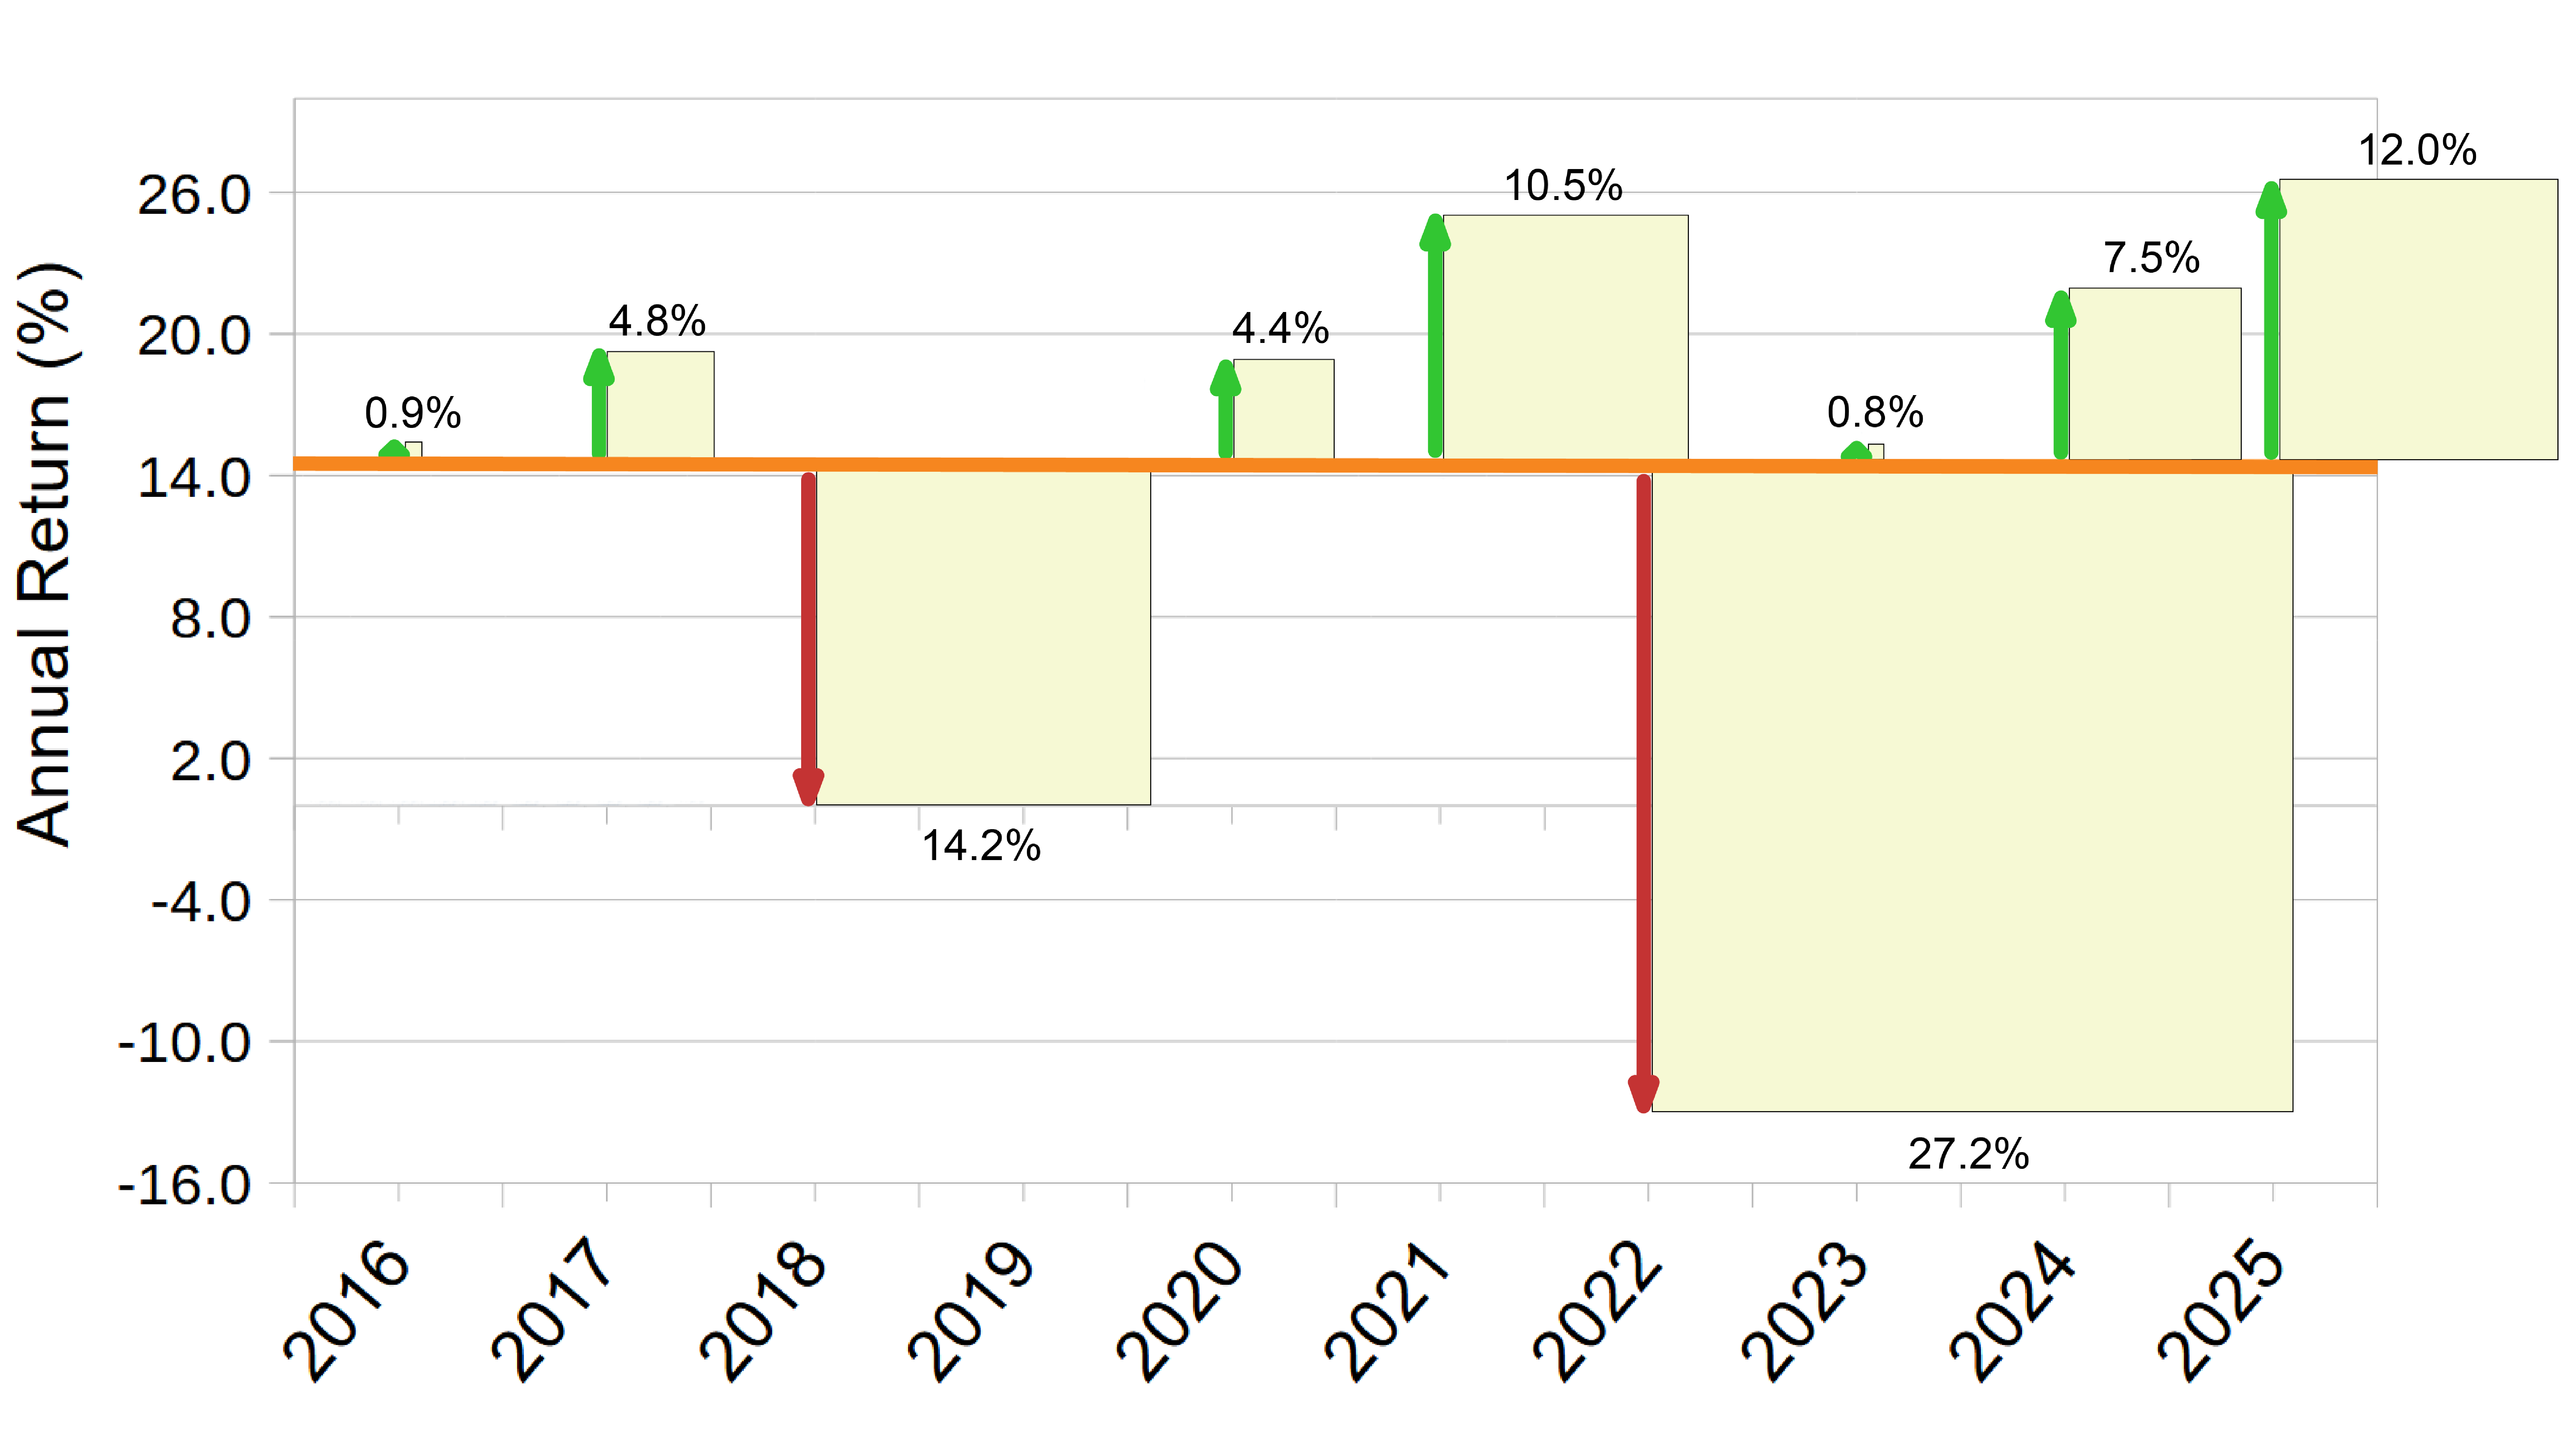
Step 3. Square each difference (shown as separate yellow squares, below)
Step 4. Find the square whose area is the average of all the squared differences. The area of this square is the average of the 10 squares above.
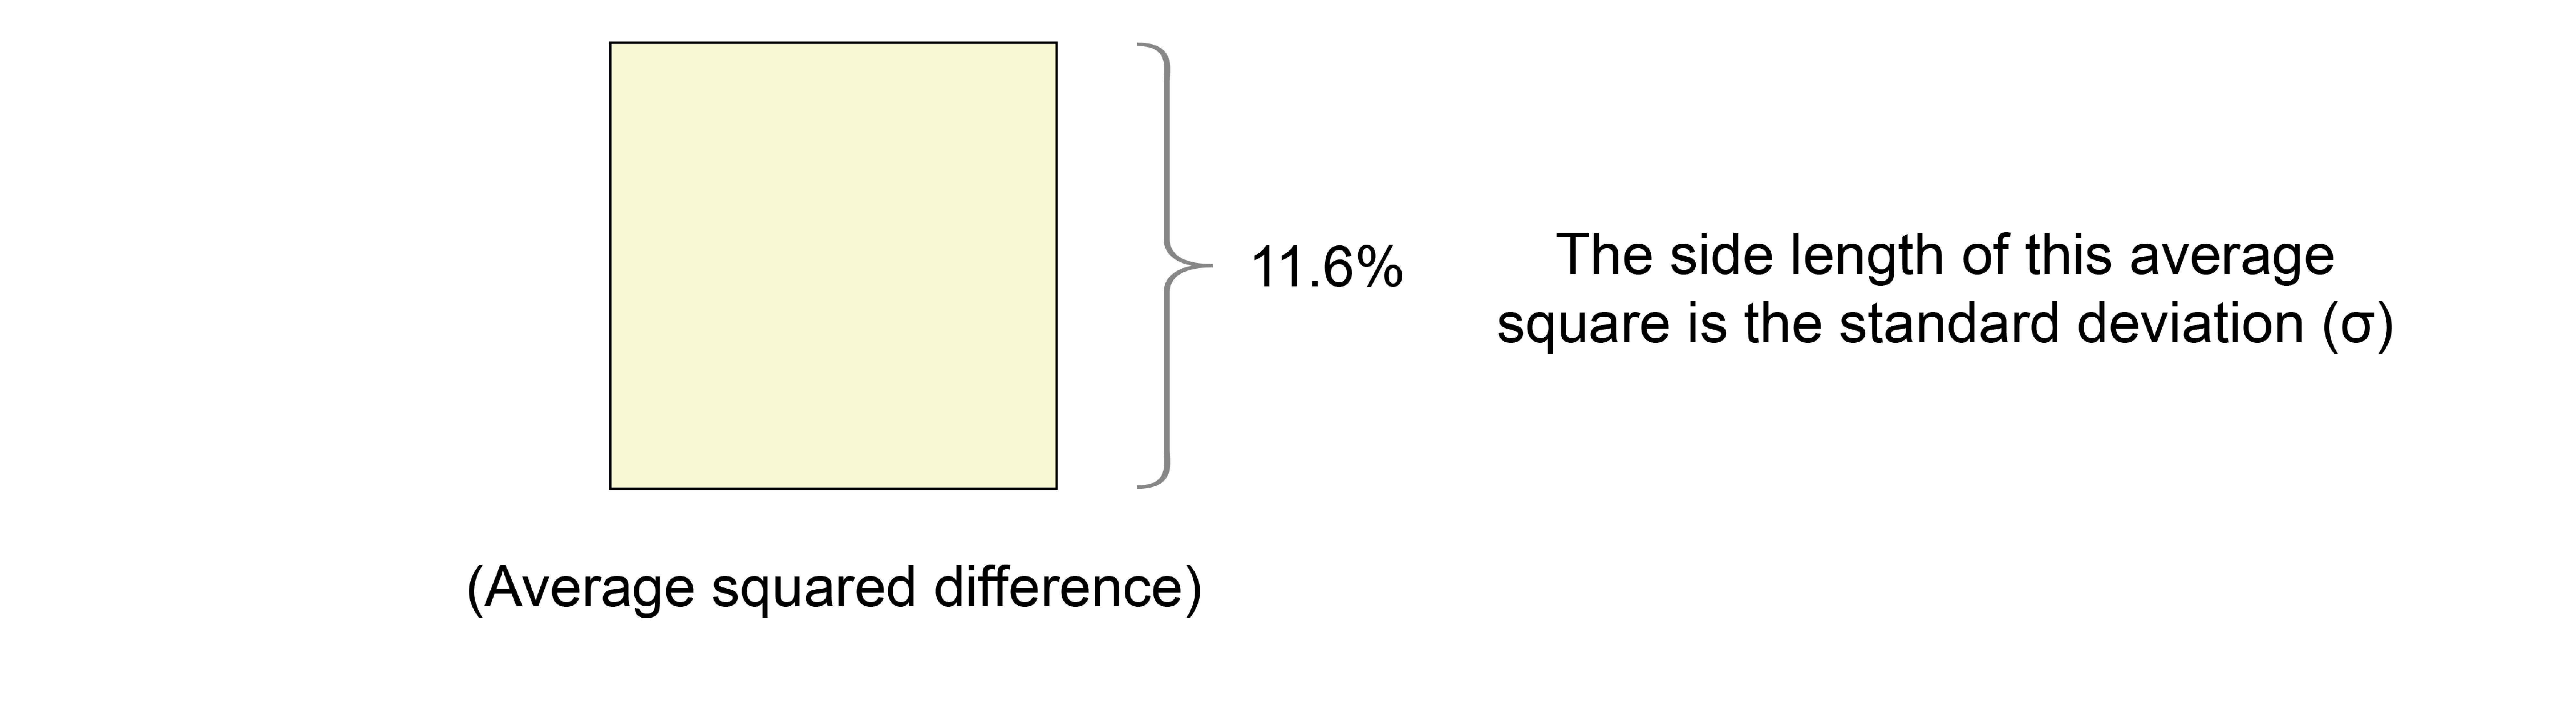
Step 5. The side length of this average square is the Standard Deviation: the typical, annual deviation from the average. In the example above, the Standard Deviation is 11.6%.
What is the Standard Deviation for example portfolios?
Portfolio | Ticker or ID | Description | Risk Level | Standard Deviation | Annualized Return |
1-3 Year Treasury Bond fund | SHY | short-term bond fund | very low | 1.5% | 2.0% |
Total Bond Market fund | BND | aggregate bond fund | low | 4.6% | 3.3% |
Balanced Portfolio | s.6040 | 60% stocks, 40% bonds | medium | 10.7% | 8.0% |
S&P 500 fund | SPY | large company stocks | this is "market risk" | 16.8% | 10.9% |
Nasdaq 100 Index fund | QQQ | tech-heavy,large company fund | high | 21.2% | 15.4% |
Adaptive Asset Allocation F | t.aaaf | tactical Portfolio Recipe | decent risk/return tradeoff | 12.3% | 14.8% |
What’s the difference between the Standard Deviation and the Downside Deviation?
- Standard Deviation measures total volatility, including both upside and downside movements from the average return.
- Downside Deviation measures only negative volatility, focusing on returns that fall below a minimum acceptable threshold, typically zero or a target return.