
Downside Deviation
Downside Deviation: A Better Measure of Portfolio Downside Risk
What is Downside Deviation?
Downside Deviation measures the "bad risk" by calculating how much a portfolio's returns fall below a specific target, such as 0%. Unlike Standard Deviation, which treats all price swings as risk, this metric ignores the positive gains that investors actually enjoy. By focusing strictly on the volatility that causes a portfolio to miss its goal, Downside Deviation provides a more practical view of the potential for loss without penalizing the upside performance.
What does the Downside Deviation tell you?
Downside Deviation tells you the typical amount down in a year, compared to the average or a specific target return. While Standard Deviation treats both "good" and "bad" volatility the same, Downside Deviation focuses exclusively on the movements that hurt your portfolio.
Why is the Downside Deviation important?
- Unlike standard deviation, which penalizes an investment for swinging both up and down, downside deviation only counts the moves that fall below your target. This is more intuitive for investors who view "risk" as losing money, not making more than expected.
- Downside Deviation helps you understand the frequency and magnitude of potential losses. By ignoring the "upside," you get a clearer picture of the actual "pain" you might experience during a market downturn.
- If you have a specific minimum return you need to meet (like 0% to preserve capital or 4% for retirement withdrawals), downside deviation tells you exactly how much the portfolio tends to fail that specific goal.
What is a good Downside Deviation?
Lower is better, since we don't like our portfolio to lose value.
What is a typical range for the Downside Deviation?
This represents the range of downside deviation values for the 20-year period ending November 2025, as tracked by RecipeInvesting.com.
- Portfolio Recipes (investable model portfolios)
- Low of 2.0% for Gabelli ABC AAA (GABCX)
- High of 13.6% for Invesco International Dividend (PID).
- Portfolio Ingredients (asset class ETFs)
- Low of 0.7% for iShares 1-3 Year Treasury Bond (SHY) to a
- High of 24.3% for iShares MSCI Brazil ETF (EWZ)
What do specific Downside Deviation values mean?
- 1%: very low risk with gentle fluctuations (e.g., short-term government bonds)
- 3%: low risk with limited variation (e.g., bond fund)
- 5%: moderate risk with notable variation (e.g., balanced fund)
- 10%: high risk with potential large swings (e.g., growth stocks)
- 15%: very high risk with significant variation (e.g., technology stocks)
What is the formula for the Downside Deviation?
$$ \text{Downside Deviation} = \sqrt{\frac{\sum(min (R - T , 0))^2}{\text{n}}} $$
Where:
- R = individual return values
- min(R, 0) = the lesser of the portfolio's yearly return or zero. In this way, only negative returns are used in the calculation.
- n = number of data points, which is the number of years used in the calculation
How do you calculate Downside Deviation?
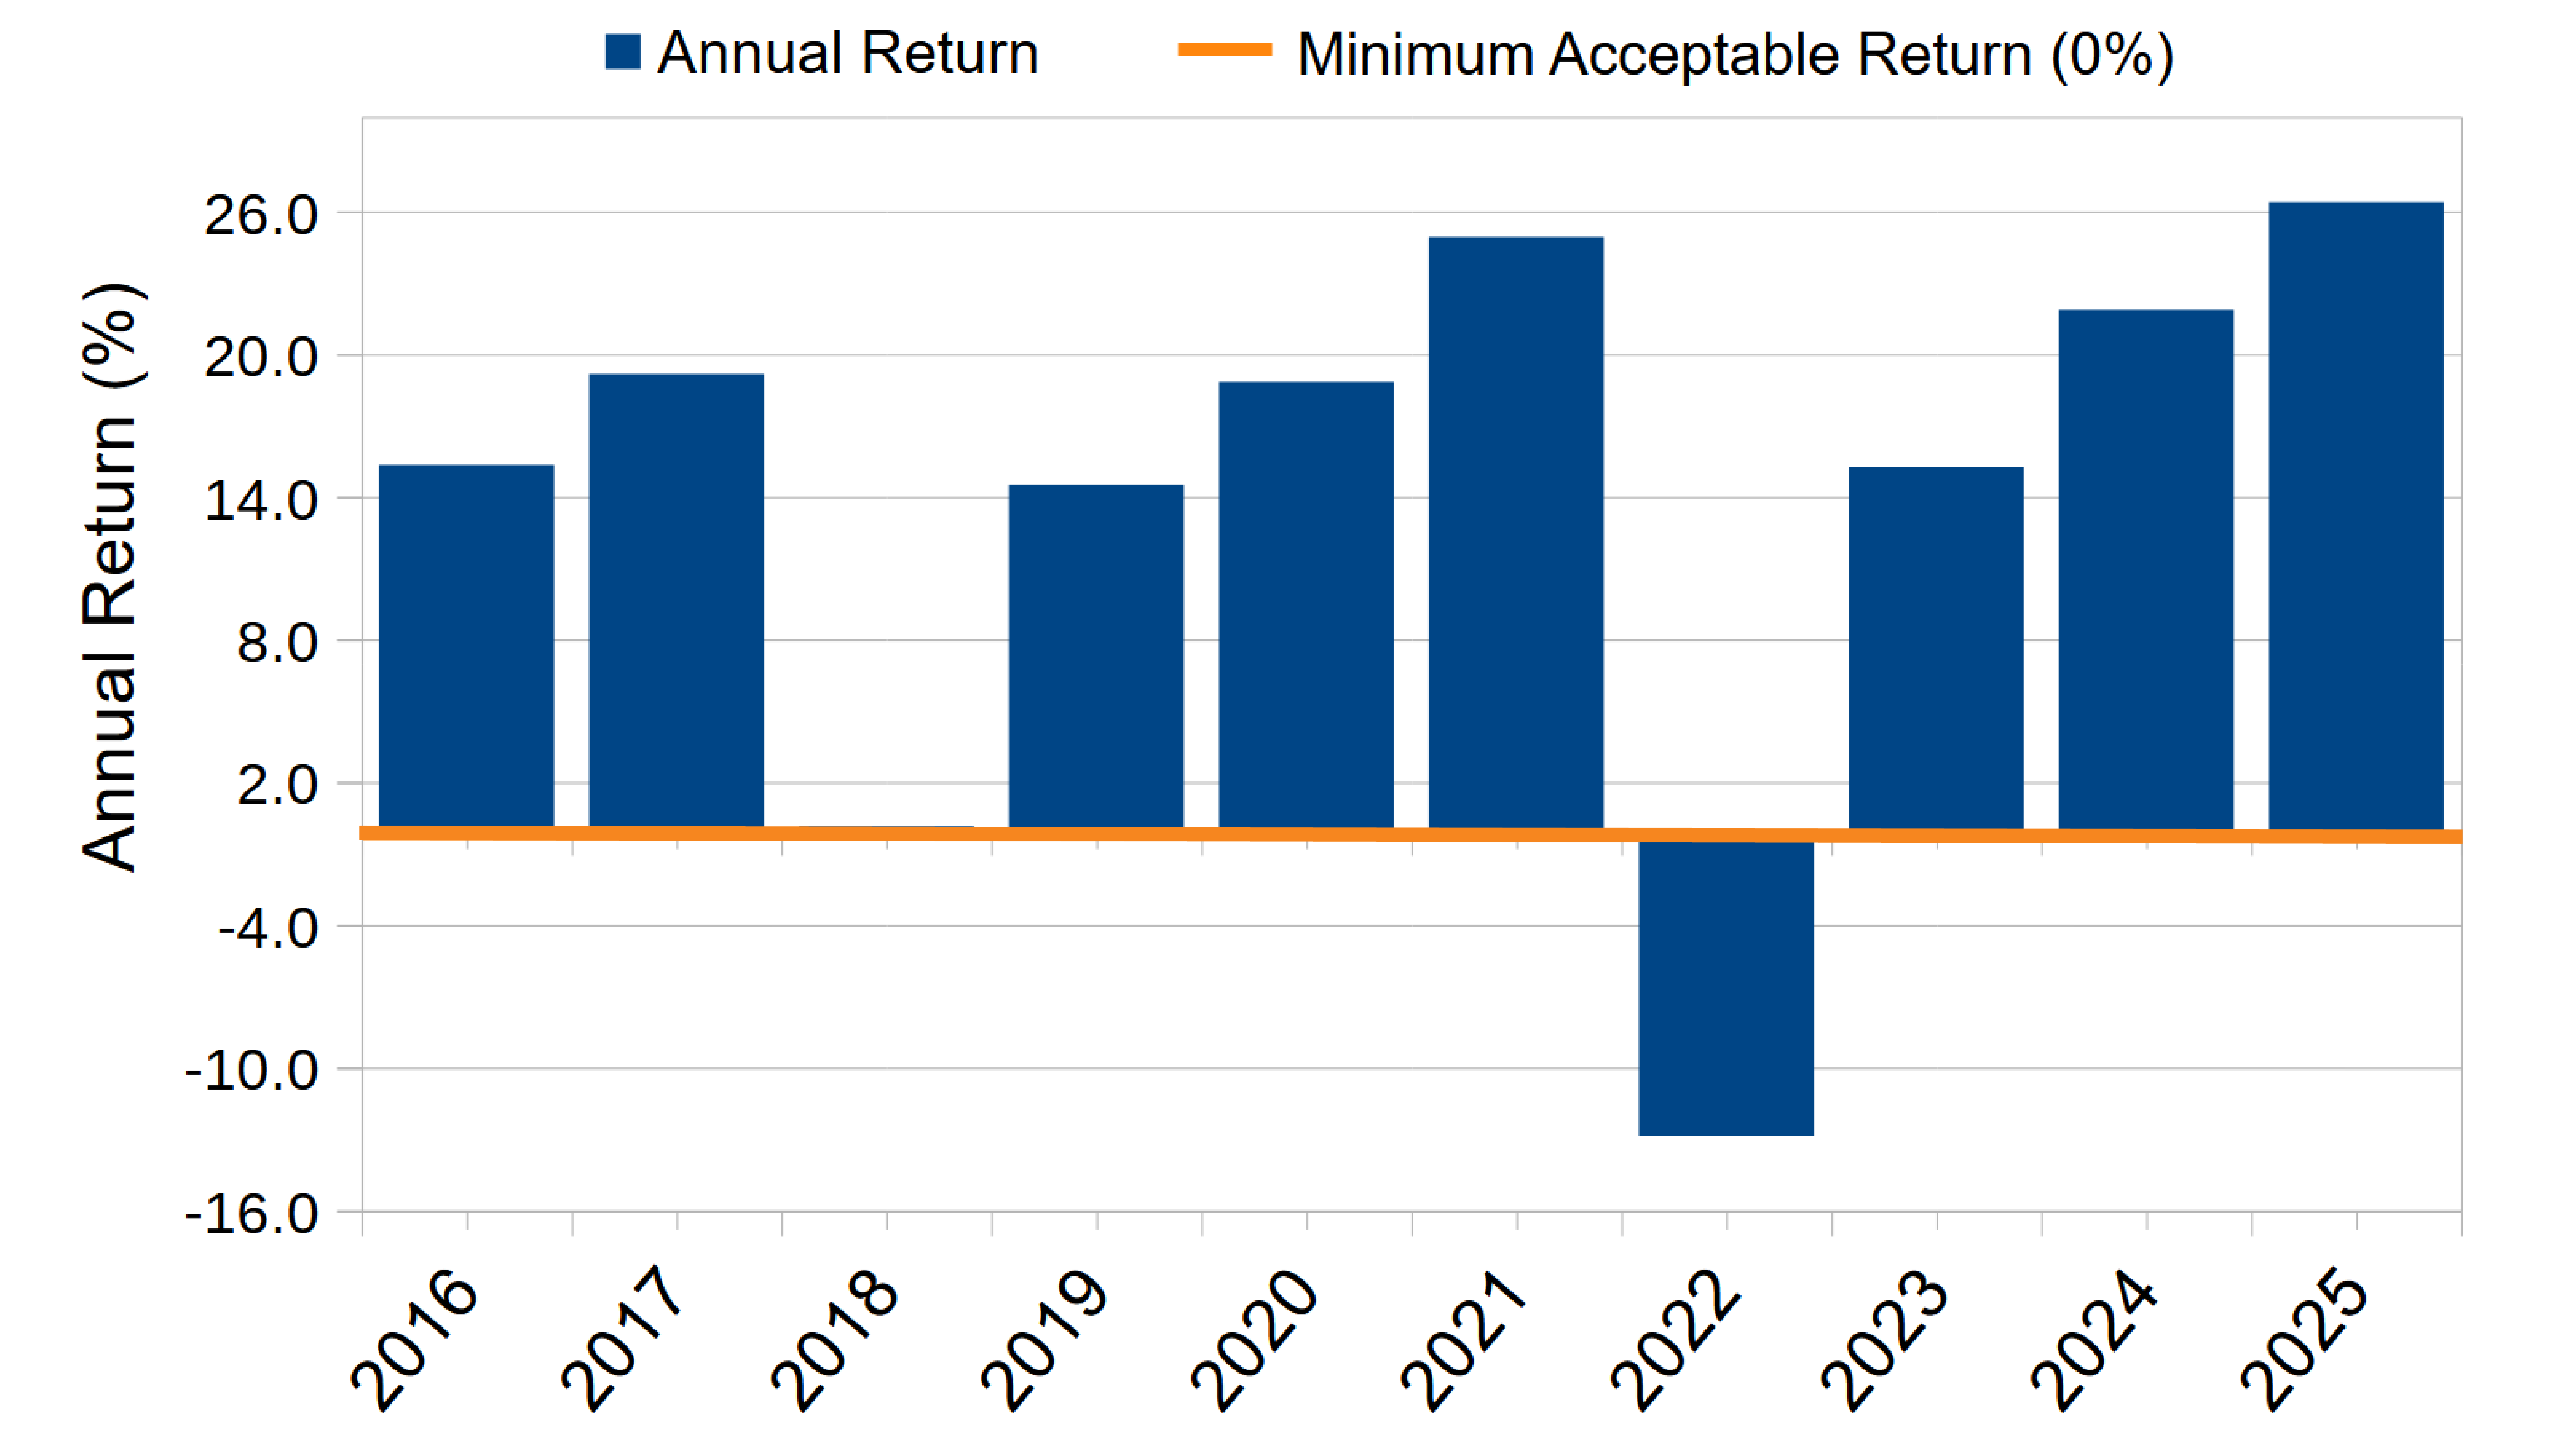
- Get the total return data for the period in question. In this example, we've created a column chart showing annual returns for the last 10 years.
- Ignore all the positive return columns. We will filter for negative returns only since we're only concerned with the "bad" years when the investment lost value. Positive returns are ignored because Downside Deviation is specifically a measure of downside risk, not total volatility.
- Square each negative return. Squaring does two things: it makes all the values positive (so they don't cancel each other out when summed), and it amplifies larger losses more than smaller ones. A -15% year punishes the score more than three separate -5% years would.
- Sum all the squared values. We add them all together to get the total "downside load" across the entire period.
- Divide by the total number of years (not just the negative ones). This is a key detail. We divide by all years in the period, not just the bad ones. This means an investment with fewer down years gets rewarded: the same sum of squared losses spread over more years gives a lower average.
- Take the square root. Since we squared the returns earlier, you square-root at the end to bring the result back to the same units as the original returns (percentage points). This final number is the Downside Deviation.
- Calculate and show the average negative return as a horizontal line cutting through the remaining negative columns. The average will be based only on the periods in which there was a negative return. Periods with a positive return will be ignored.
- For each delta bar, draw a square whose side length equals the absolute distance from the mean, showing the squared deviations. “We square the deviations so large downside surprises matter more than small ones — this is where risk really shows up.”
- Show the creation of a single square whose area equals the average area of all the squared-deviation squares.
- Take the square root of that average area; the side length of this square is the downside deviation.
Can you explain Downside Deviation graphically?
Sure. Let's show how the 10-year Downside Deviation is calculated using annual returns.
Step 1. Get the total return for each year (shown as blue bars, below) and choose a Minimum Acceptable Return (which we have chosen as 0%, shown as the orange line)
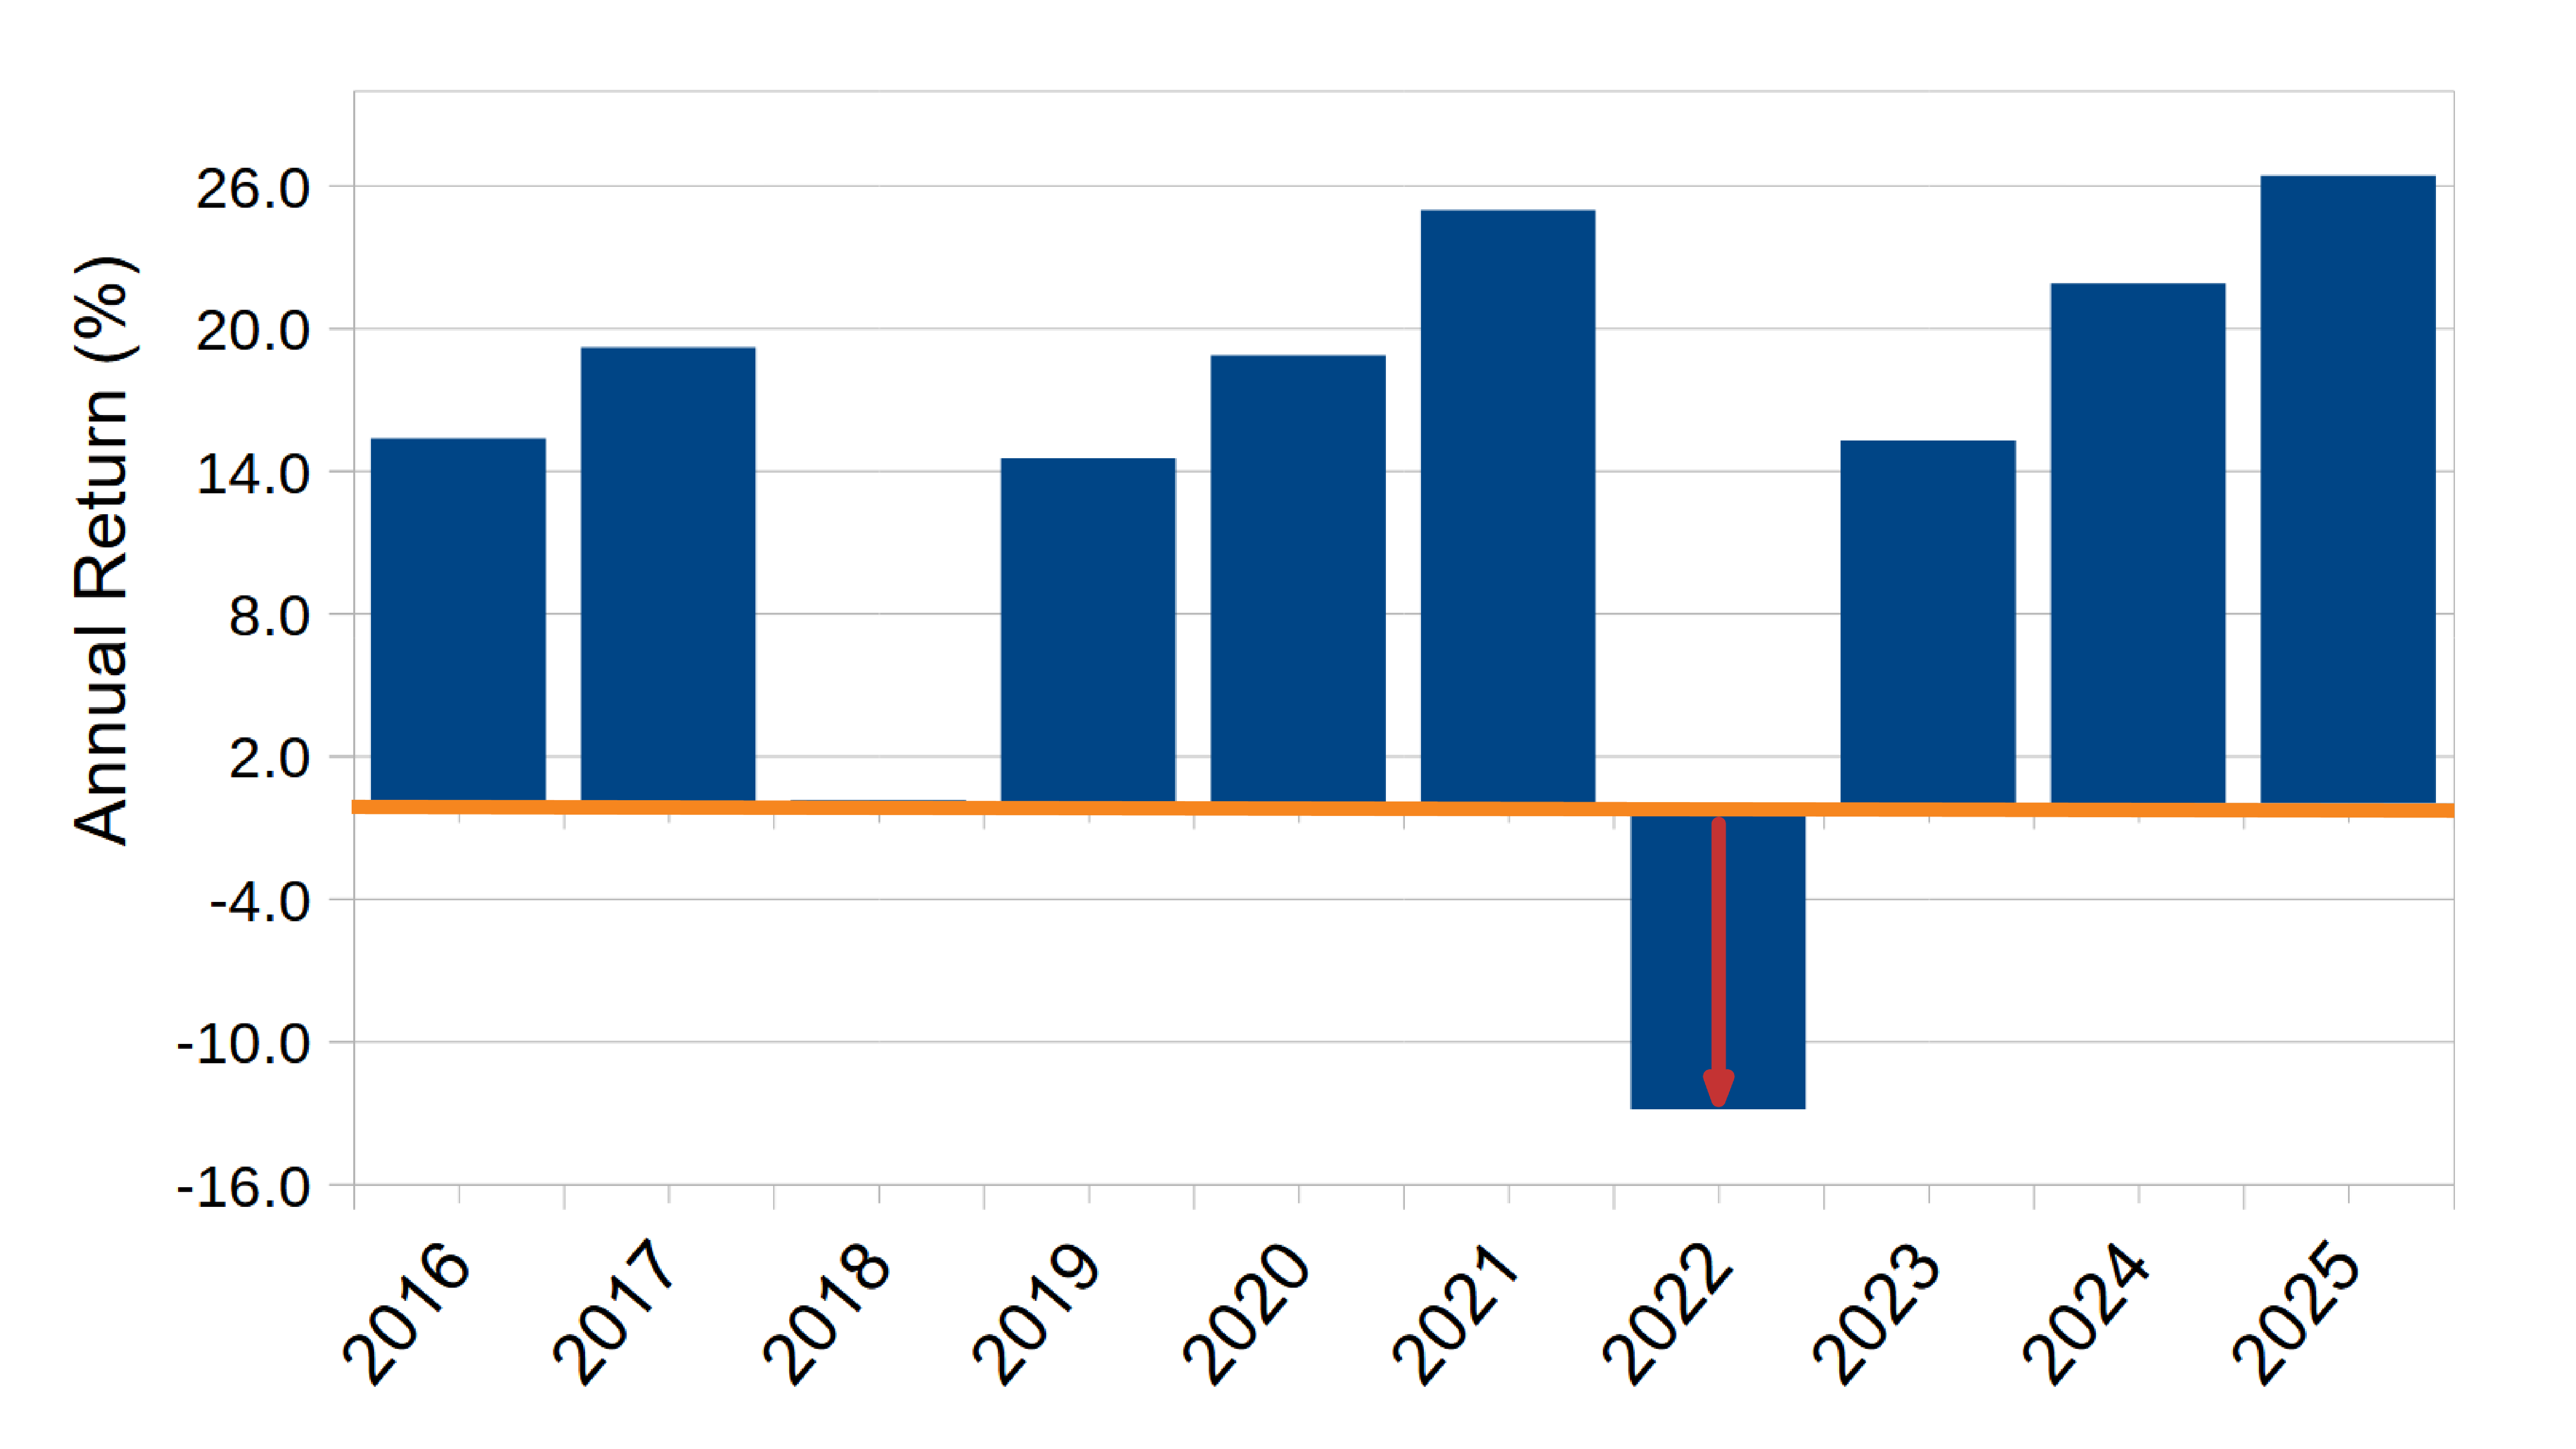
Step 2. Find the negative returns compared to the Minimum Acceptable Return for the years (shown as a red arrow)
Step 3. Square each difference (shown as a yellow square, below)
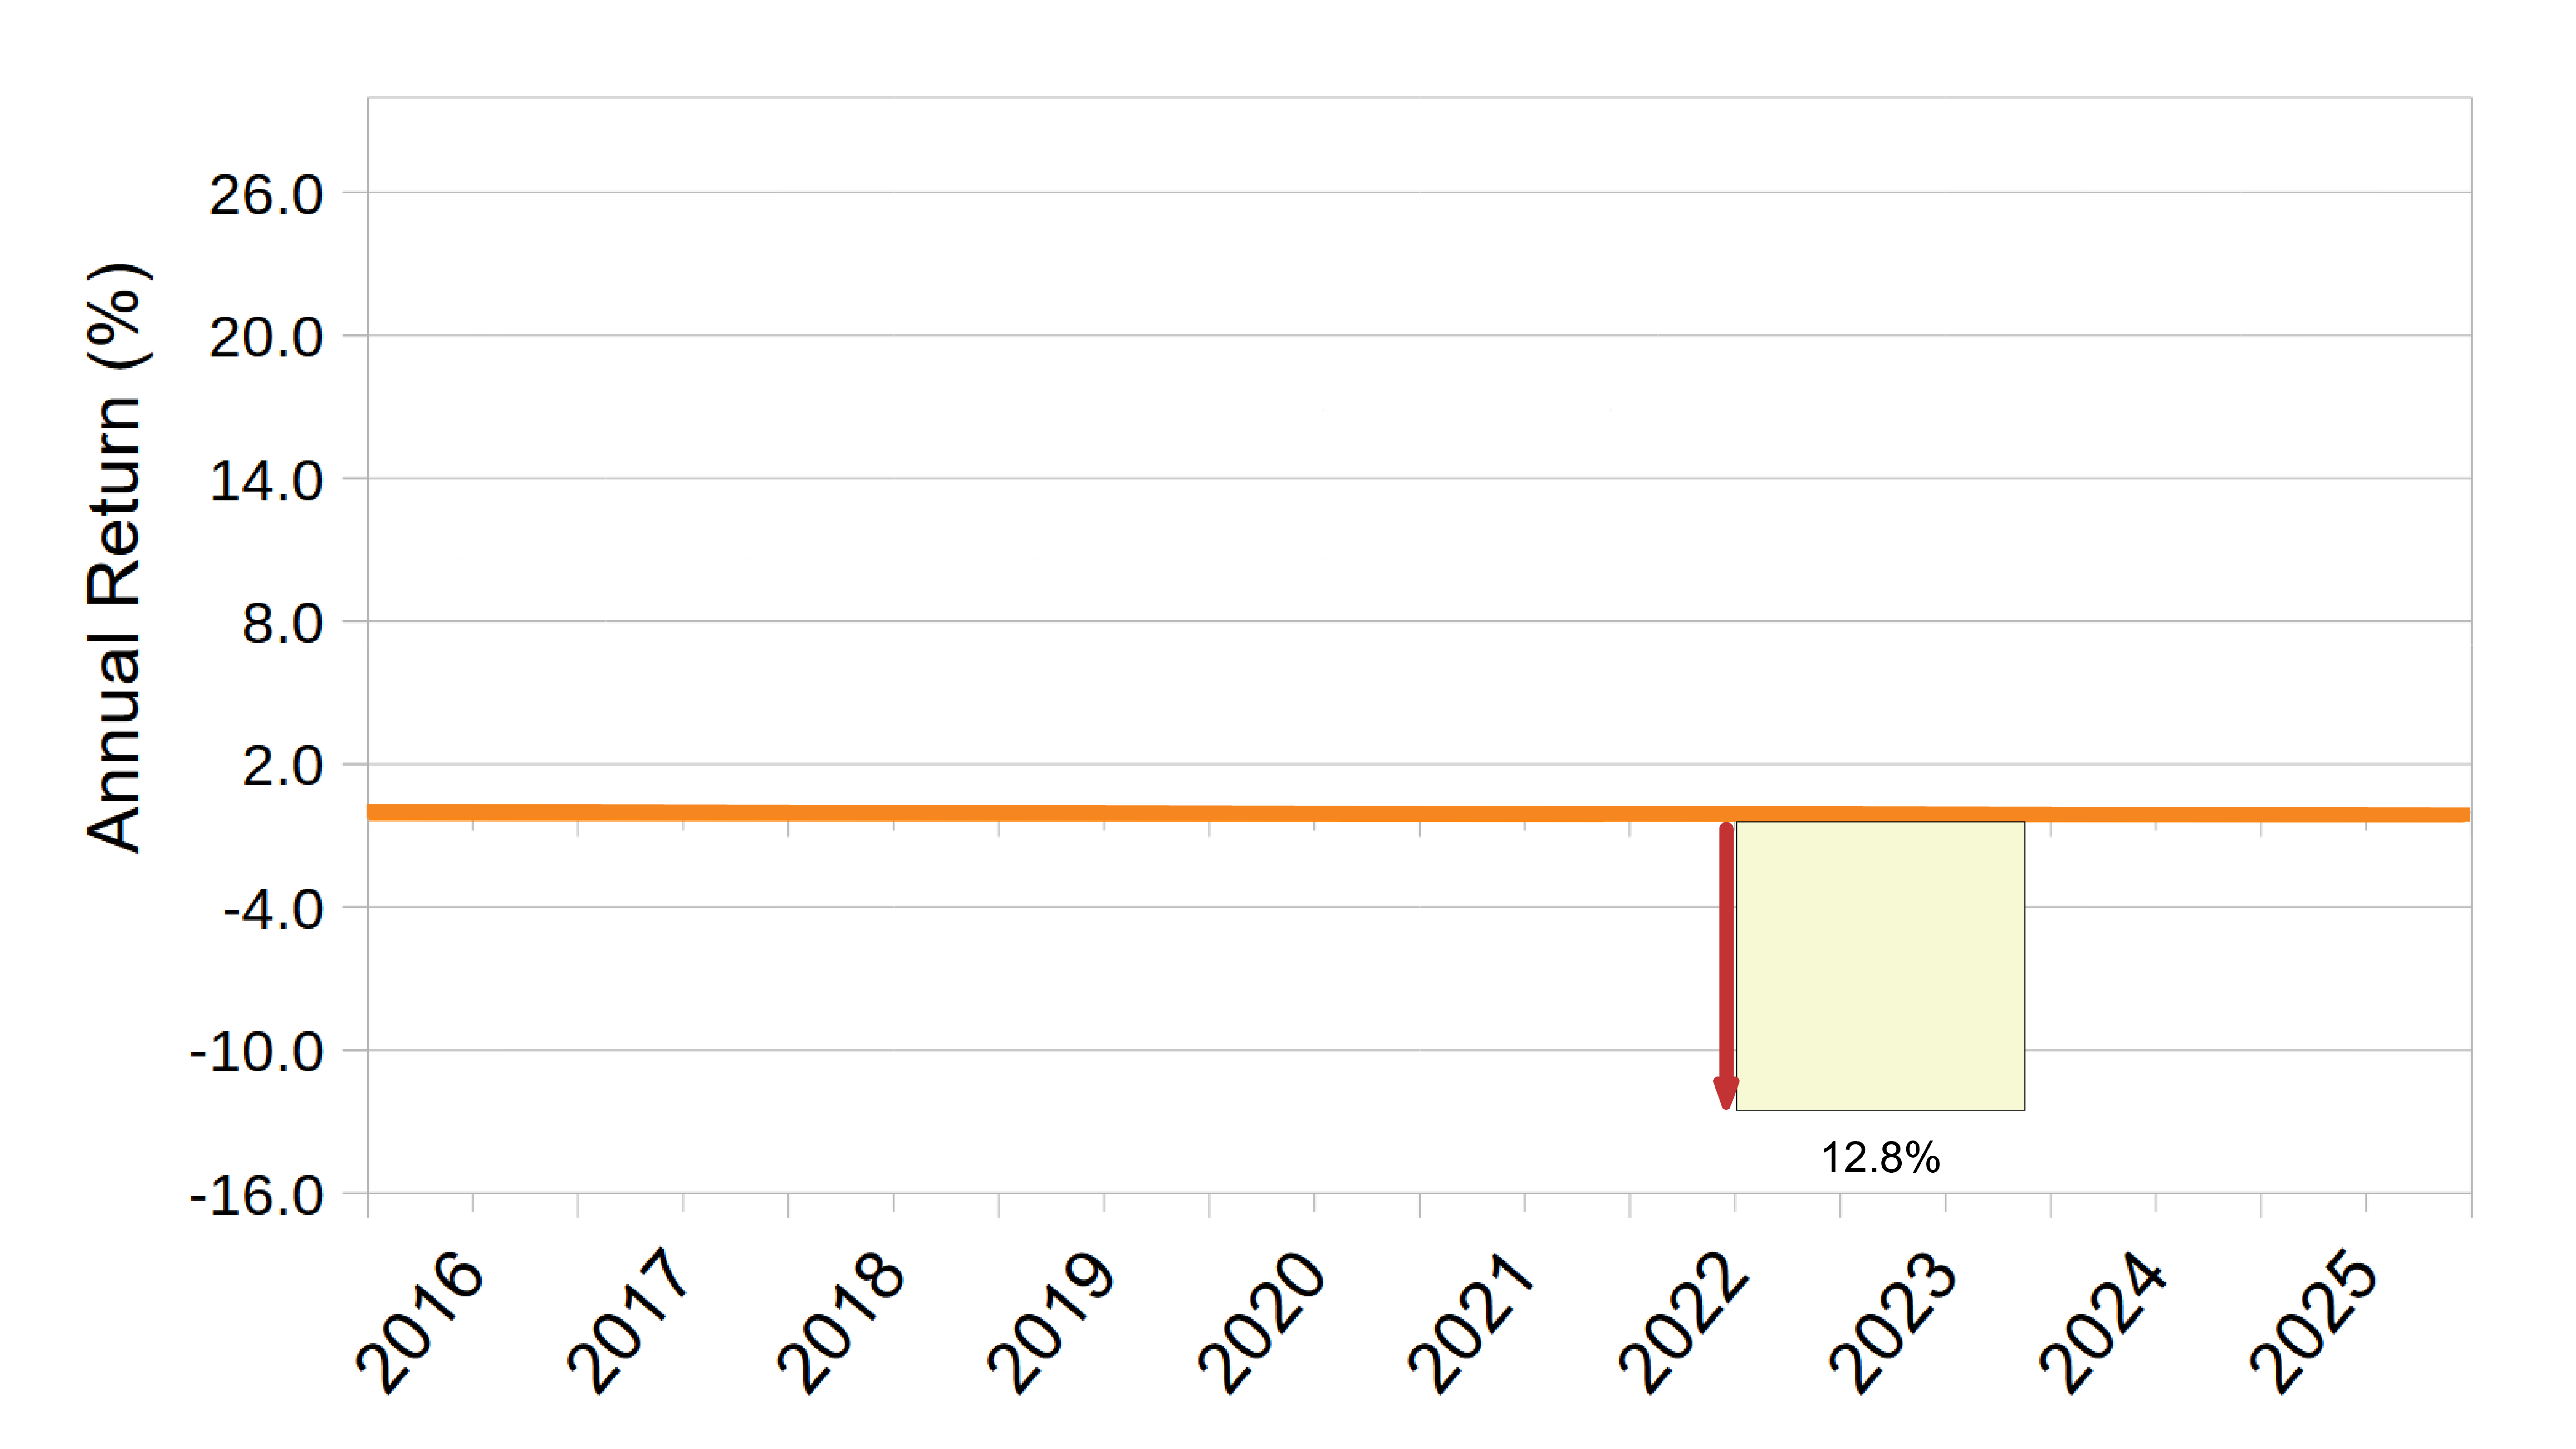
The area of this square is the average of the one square above and the nine other years which are counted as zero.
Step 4. Find the square whose area is the average of all the squared differences. The area of this square is the average of the 10 squares above.
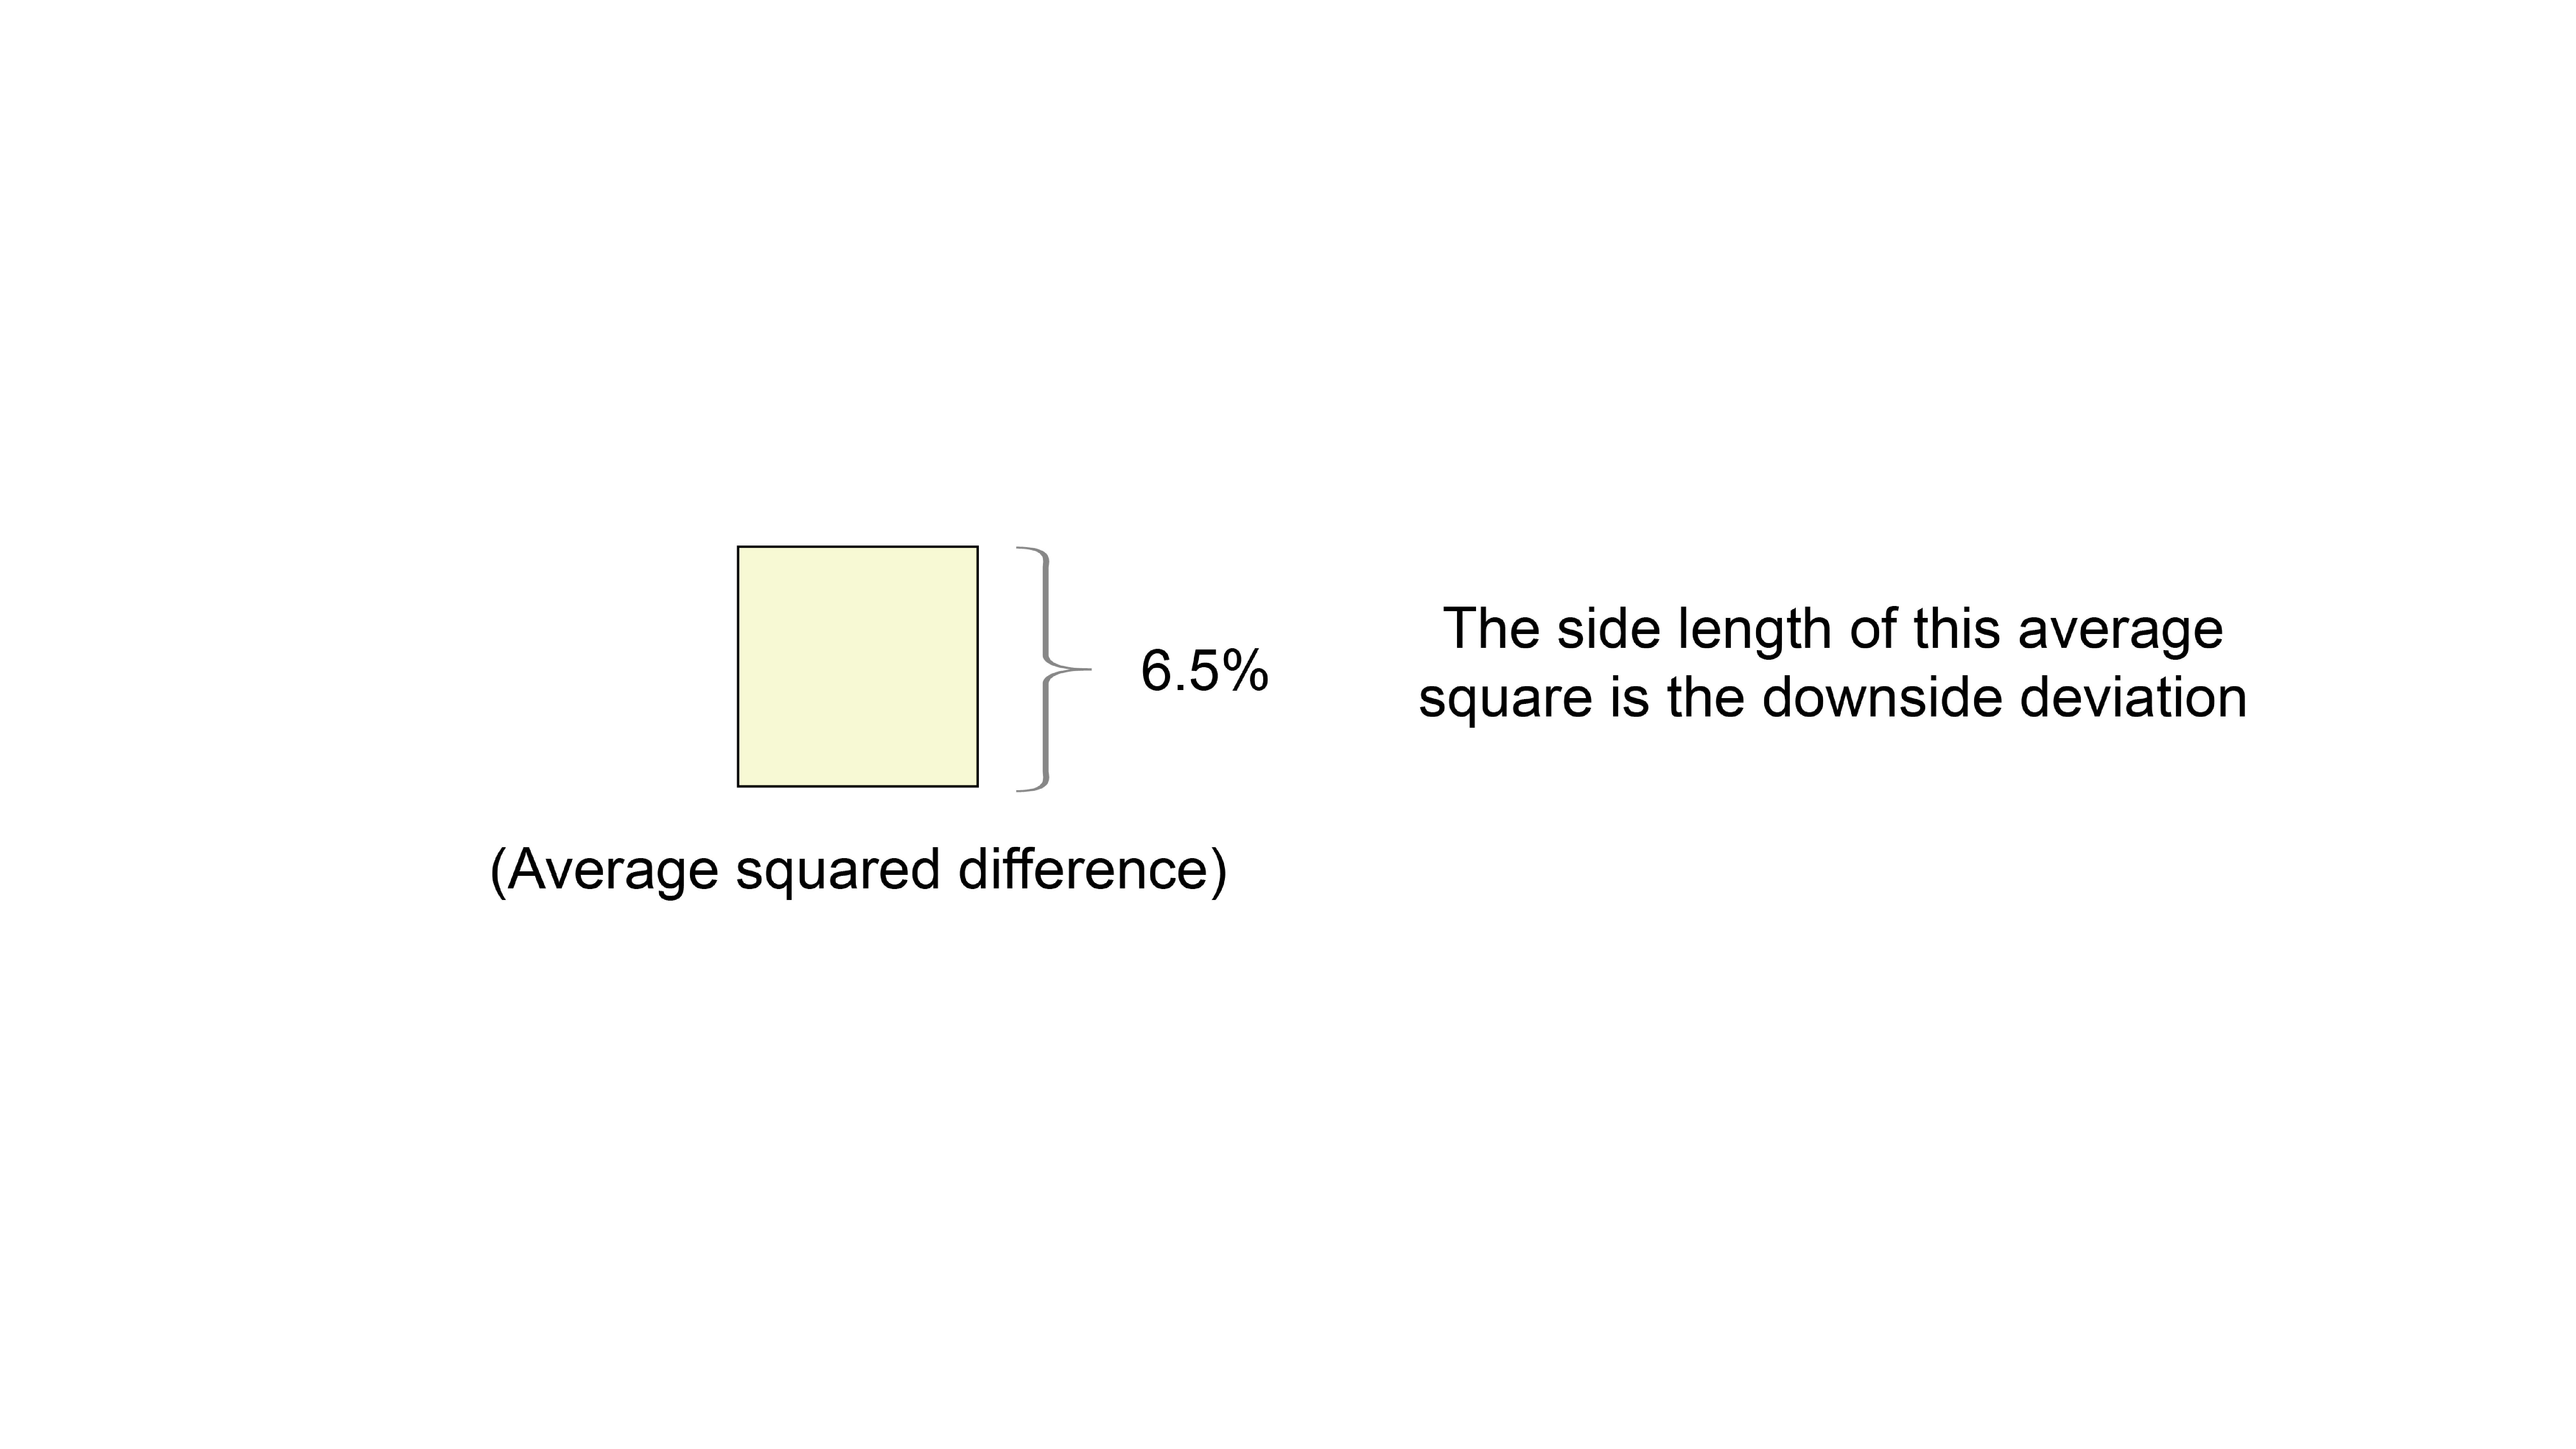
Step 5. The side length of this average square is the Downside Deviation: the typical, annual downside deviation below 0%. In the example above, the Downside Deviation is 6.5%.
What is the Downside Deviation for example portfolios?
Portfolio | Ticker or ID | Description | Risk Level | Downside Deviation | Annualized Return |
1-3 Year Treasury Bond fund | SHY | short-term bond fund | very low | 0.7% | 2.0% |
Total Bond Market fund | BND | aggregate bond fund | low | 2.8% | 3.3% |
Balanced Portfolio | s.6040 | 60% stocks, 40% bonds | medium | 7.1% | 8.0% |
S&P 500 fund | SPY | large company stocks | this is "market risk" | 11.1% | 10.9% |
Nasdaq 100 Index fund | QQQ | tech-heavy,large company fund | high | 13.3% | 15.4% |
Adaptive Asset Allocation F | t.aaaf | tactical Portfolio Recipe from RecipeInvesting.com | decent risk/return tradeoff | 6.4% | 14.8% |
What’s the difference between the Downside Deviation and the Standard Deviation?
- Downside Deviation measures only negative volatility, focusing on returns that fall below a minimum acceptable threshold, typically zero or a target return.
- Standard Deviation measures total volatility, including both upside and downside movements from the average return.