
M-Squared
M-Squared (M²): A Risk-Adjusted Performance Measure for Portfolios
What is M-Squared?
M-Squared shows what a portfolio’s return would look like if it had the same risk as the market. So a portfolio with a high return, but with risk greater than the market, has a lower M-Squared percentage.
What does M-Squared tell you?
M-Squared measures a portfolio's risk-adjusted return relative to a benchmark, showing how much return it generated for the level of risk taken. It expresses performance in percentage terms, making it easier to compare portfolios with different risk levels on an equal footing.
Why is M-Squared important?
- It allows for a fair comparison between portfolios by adjusting returns to match the same level of risk, removing the distortion that comes from simply comparing raw returns.
- It makes risk-adjusted performance easy to interpret since the result is expressed as a percentage, unlike other metrics such as the Sharpe Ratio.
- It helps identify whether a portfolio is truly outperforming its benchmark or simply taking on more risk to generate higher returns.
What is a good M-Squared?
Generally, a higher M-Squared is better, as it indicates more return for each unit of risk taken. A positive value means the portfolio has outperformed the benchmark on a risk-adjusted basis, while a negative value signals underperformance.
What is a typical range for M-Squared?
This represents the range of m-squared values for the 20-year period ending November 2025, as tracked by RecipeInvesting.com.
- Portfolio Recipes (investable model portfolios) range from a low of -6.7% for Westwood Real Estate (KIFYX) to a high of 9.1% for Adaptive Allocation Portfolio F (t.aaaf).
- Portfolio Ingredients (asset class ETFs) range from a low of -9.4% for Invesco DB Commodity Index Tracking Fund (DBC) to a high of 2.1% for Invesco QQQ Trust (QQQ).
What do specific M-Squared values mean?
- An M-Squared of -2% means the portfolio delivers 2% less return than the benchmark for the same level of risk, indicating underperformance even after accounting for volatility.
- An M-Squared of 0% means the portfolio matches the benchmark on a risk-adjusted basis, offering no additional return beyond what the market provides for the same level of risk.
- An M-Squared of 5% means the portfolio outperforms the benchmark by 5% on a risk-adjusted basis, reflecting strong and meaningful excess return relative to the risk taken.
What is the formula for M-Squared?
$$\text{M}^2 = (\frac{\sigma_m}{\sigma_p}) \cdot (R_p - R_f) + R_f$$
Where:
- Rp = portfolio return
- Rf = risk-free rate
- σm = standard deviation of the market
- σp = standard deviation of the portfolio
How do you calculate M-Squared?
This calculation can be explained as follows (if calculating based on annual returns)
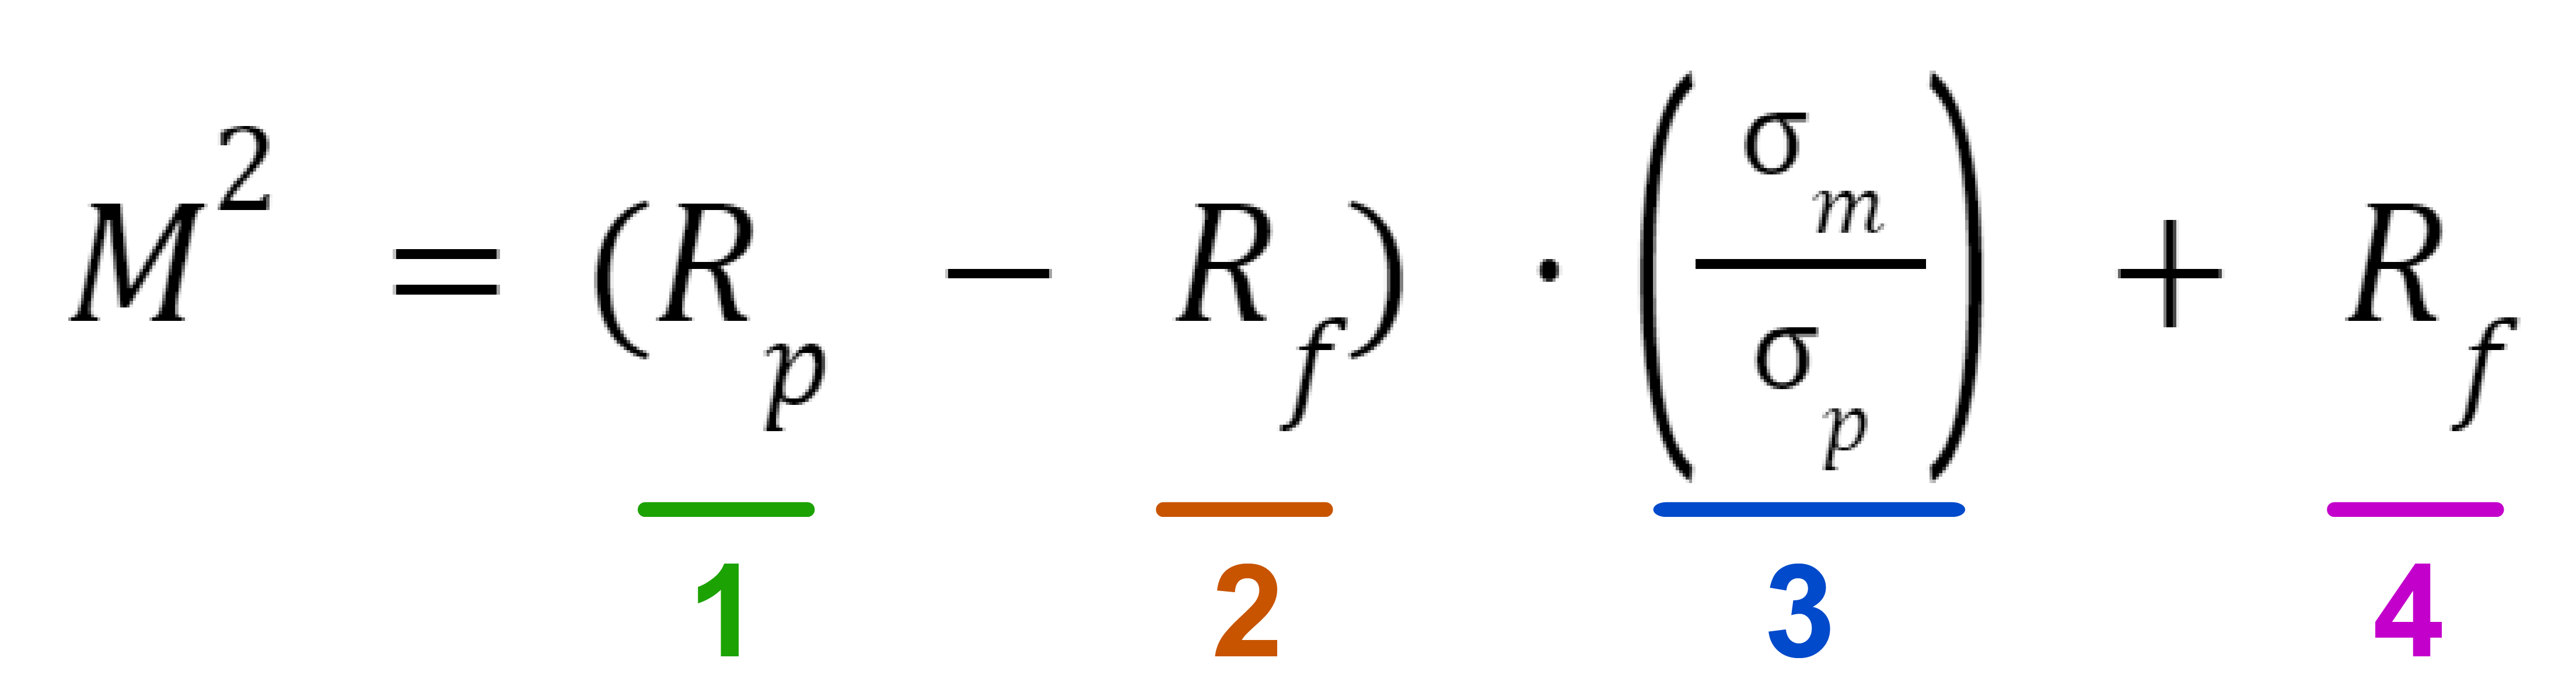
- We start with the portfolio's return (1)
- Then we subtract the risk-free return (2) since nobody should get credit for what they can get for free.
- Then we multiply by a risk ratio (3) to scale the return up or down based on the portfolio's risk. This ratio is the market risk divided by the portfolio's risk.
- So if the portfolio is riskier than the market, this ratio will be less than 1 and we will be scaling down the portfolio's return as a penalty for being riskier than the market.
- If the portfolio is less risky than the market, this ratio will be greater than 1 and we will be scaling up the portfolio's return as a reward for being less risky than the market.
- Then we add back the risk-free return (4) to get a total return percentage that we can compare to other total return percentages. When we hear about any portfolio's total return, the risk-free return is included, even if the portfolio manager didn't really earn the risk-free return. So to compare multiple portfolios based on "total return," we need to add back the risk-free return to get the final M-squared value.
Can you explain M-Squared graphically?
The waterfall chart above breaks down exactly how M-Squared is calculated step by step, turning the formula into a visual story.
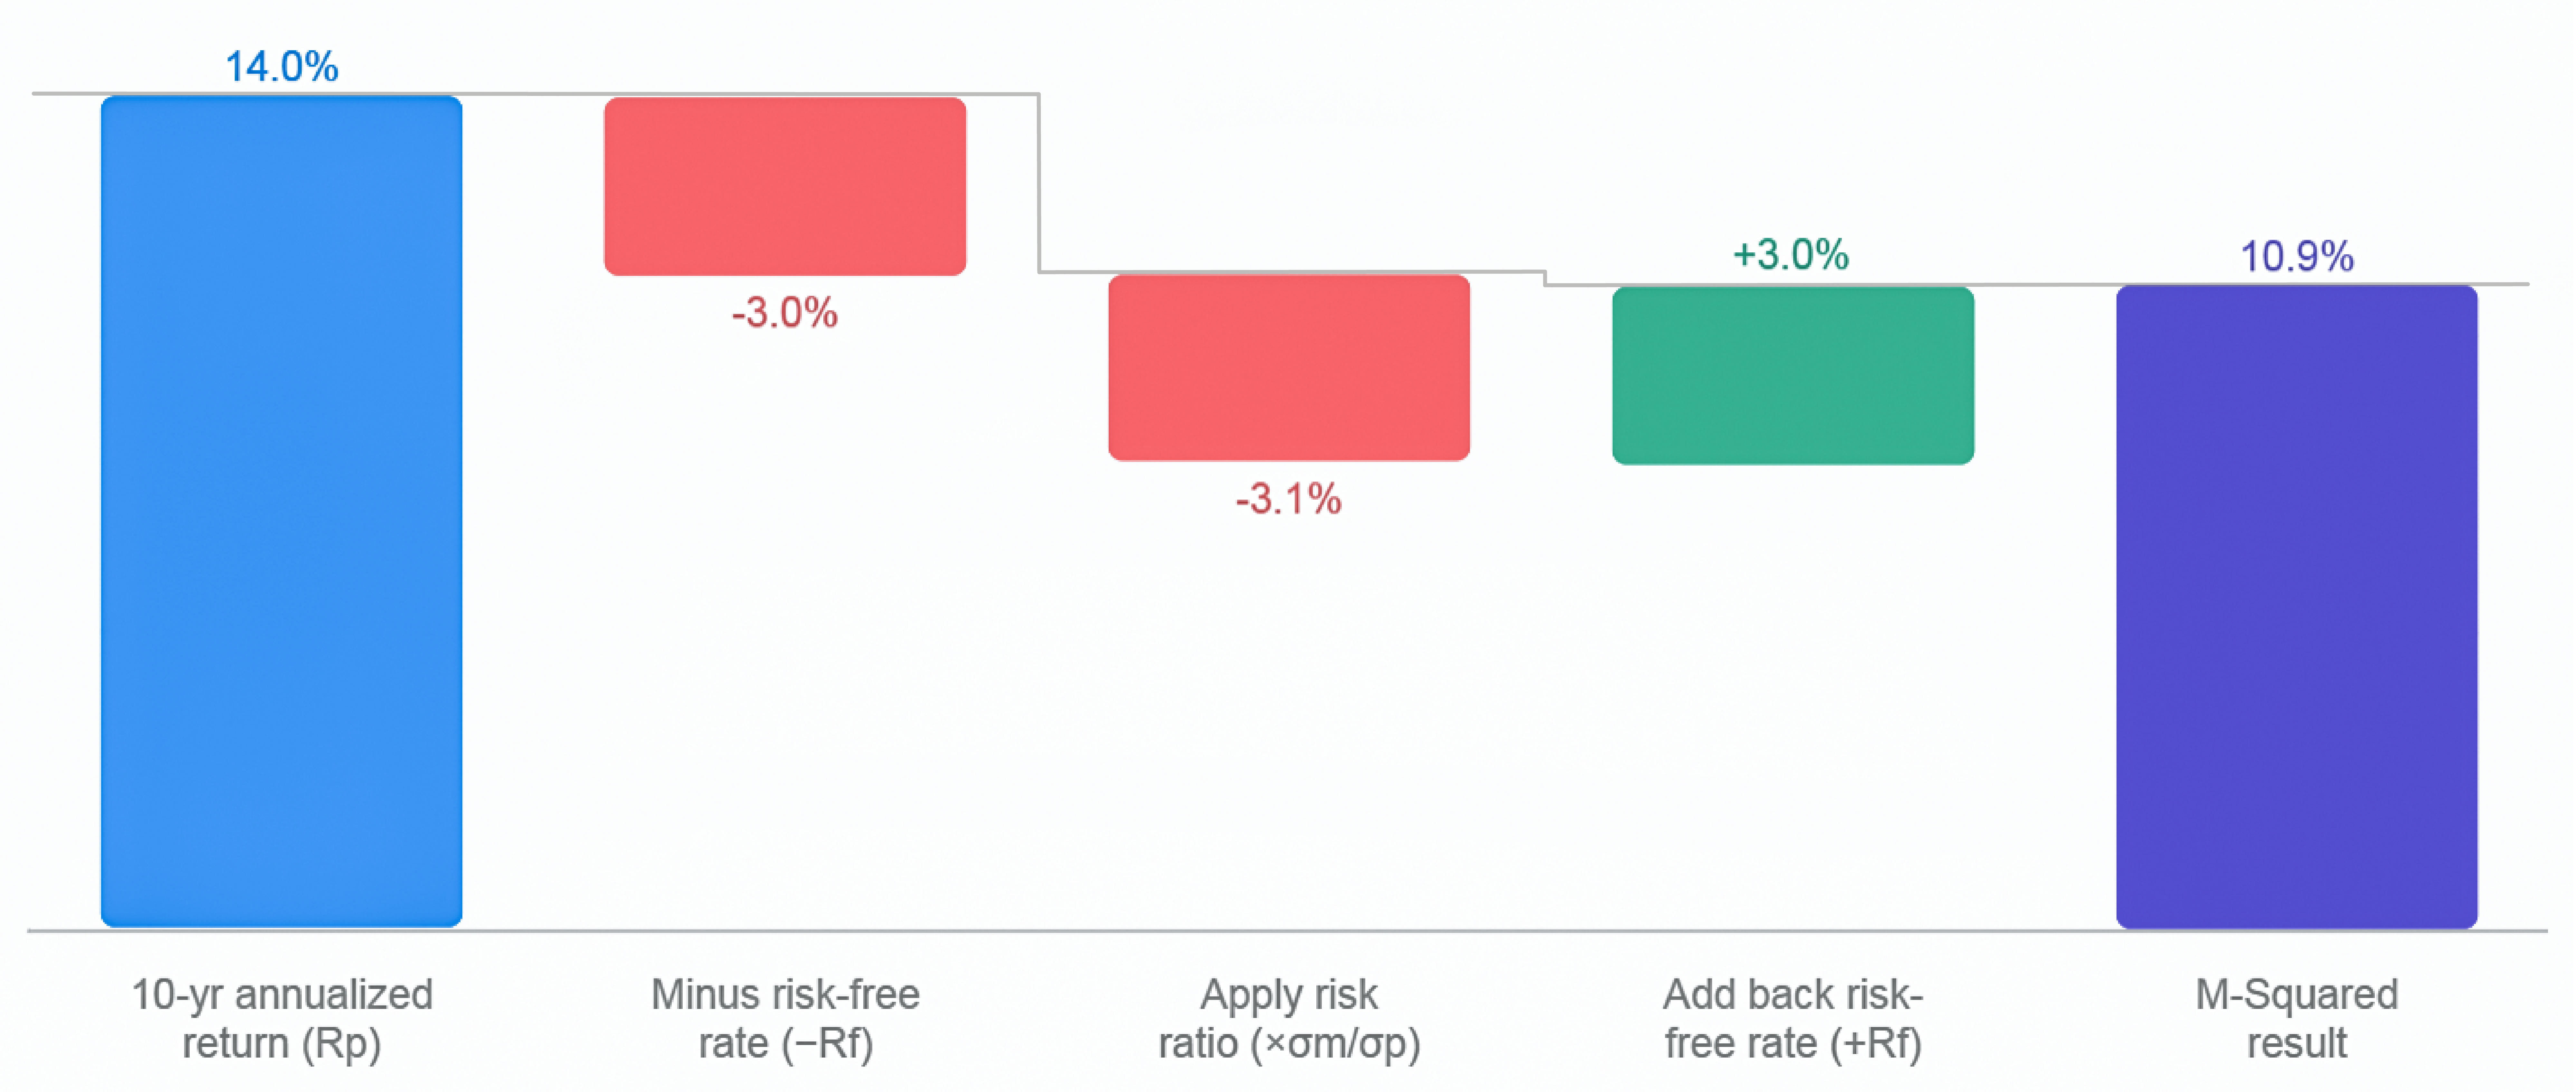
- The portfolio starts with a 10-year annualized return of 14.0%, but similar to Alpha, not all of that return reflects true performance since it still needs to be adjusted for risk.
- First, we subtract the risk-free rate of 3.0%, removing the portion of return that any investor could have earned without taking on any risk, bringing the excess return down to 11.0%.
- Then we apply a risk ratio which scales the excess return up or down based on how the portfolio's risk compares to the market's risk. This risk ratio is calculated as the market's standard deviation divided by the portfolio's standard deviation (σm/σp). In this case, the portfolio carried more risk than the market, so the return is scaled down by -3.1% as a penalty.
- Finally, we add back the risk-free rate of 3.0% to convert the result into a total return figure comparable to other portfolios, giving us the final M-Squared result of 10.9%.
A positive M-Squared of 10.9% means that after leveling the portfolio's risk to match the market, it still delivered a competitive risk-adjusted return that can be directly compared against any other portfolio or benchmark.
What is the M-Squared for example portfolios?
Portfolio | Ticker or ID | Description | Risk Level | M-Squared | Annualized Return |
1-3 Year Treasury Bond fund | SHY | short-term bond fund | very low | -7.2% | 2.0% |
Total Bond Market fund | BND | aggregate bond fund | low | -4.2% | 3.3% |
Balanced Portfolio | s.6040 | 60% stocks, 40% bonds | medium | 0.3% | 8.0% |
S&P 500 fund | SPY | large company stocks | this is "market risk" | 0.0% | 10.9% |
Nasdaq 100 Index fund | QQQ | tech-heavy,large company fund | high | 2.1% | 15.4% |
Adaptive Asset Allocation F | t.aaaf | tactical Portfolio Recipe from RecipeInvesting.com | decent risk/return tradeoff | 9.1% | 14.8% |
What’s the difference between M-Squared and Sharpe Ratio?
- M-Squared expresses risk-adjusted performance as an actual percentage return, adjusting the portfolio's risk to match the market's risk level, making it more intuitive for benchmark comparison.
- Sharpe Ratio produces a unitless number measuring return per unit of the portfolio's own risk, making it a straightforward standalone measure for ranking portfolios by efficiency.