
Permanent Portfolio vs. 60/40 and PRPFX: Two Decades of Performance
The Permanent Portfolio vs. 60/40 and PRPFX: Two Decades of Performance
November 2026
Topics this month
- The Permanent Portfolio: how it works and its 20-year results versus Balanced 60/40
- PRPFX and Permanent Plus: comparing allocations, returns, and drawdowns
- Weighing risk and return across permanent and tactical portfolios
Welcome to the Recipe Investing Commentary for November 2026. This month’s topic is the Permanent Portfolio, and the question is whether it is still working after 20 years of performance that we are tracking.
Understanding the Permanent Portfolio
First, what is the Permanent Portfolio? It is based on Fail-Safe Investing, a book Harry Browne wrote in the late 1990s. As described on Wikipedia, it is a static, or strategic, portfolio with an allocation to four asset classes: 25% in stocks, 25% in long-term Treasuries, 25% in cash, and 25% in gold.
The idea is that this allocation makes the portfolio, in effect, an all-weather portfolio. Although it is passive and static, it can be rebalanced periodically, such as quarterly or annually. If one asset class is not doing as well, another would be doing better, and over time the results would average out to a consistent positive return. In this way, the Permanent Portfolio is meant to weather different market conditions. Each asset class is expected to do well under different circumstances:
- Treasury bonds: prosperity and deflation
- Stocks: prosperity
- Gold: inflation
- Cash: a hedge against a period of tight money
The Harry Browne Portfolio vs. Balanced 60/40
Recipe Investing serves as something of a test kitchen for portfolios, many of which are easier said than done. It has tracked the results of the Permanent Portfolio for a number of years.
The portfolio recipes and results page lists all of the different portfolio recipes and includes scatter plots for easy reference. Interestingly, the Permanent Portfolio is listed as the Harry Browne Inspired portfolio (s.brow). On the scatter plots, it appears as an orange dot, plotted against all of the other tactical, strategic, and professionally managed portfolios in the Recipe Investing universe.
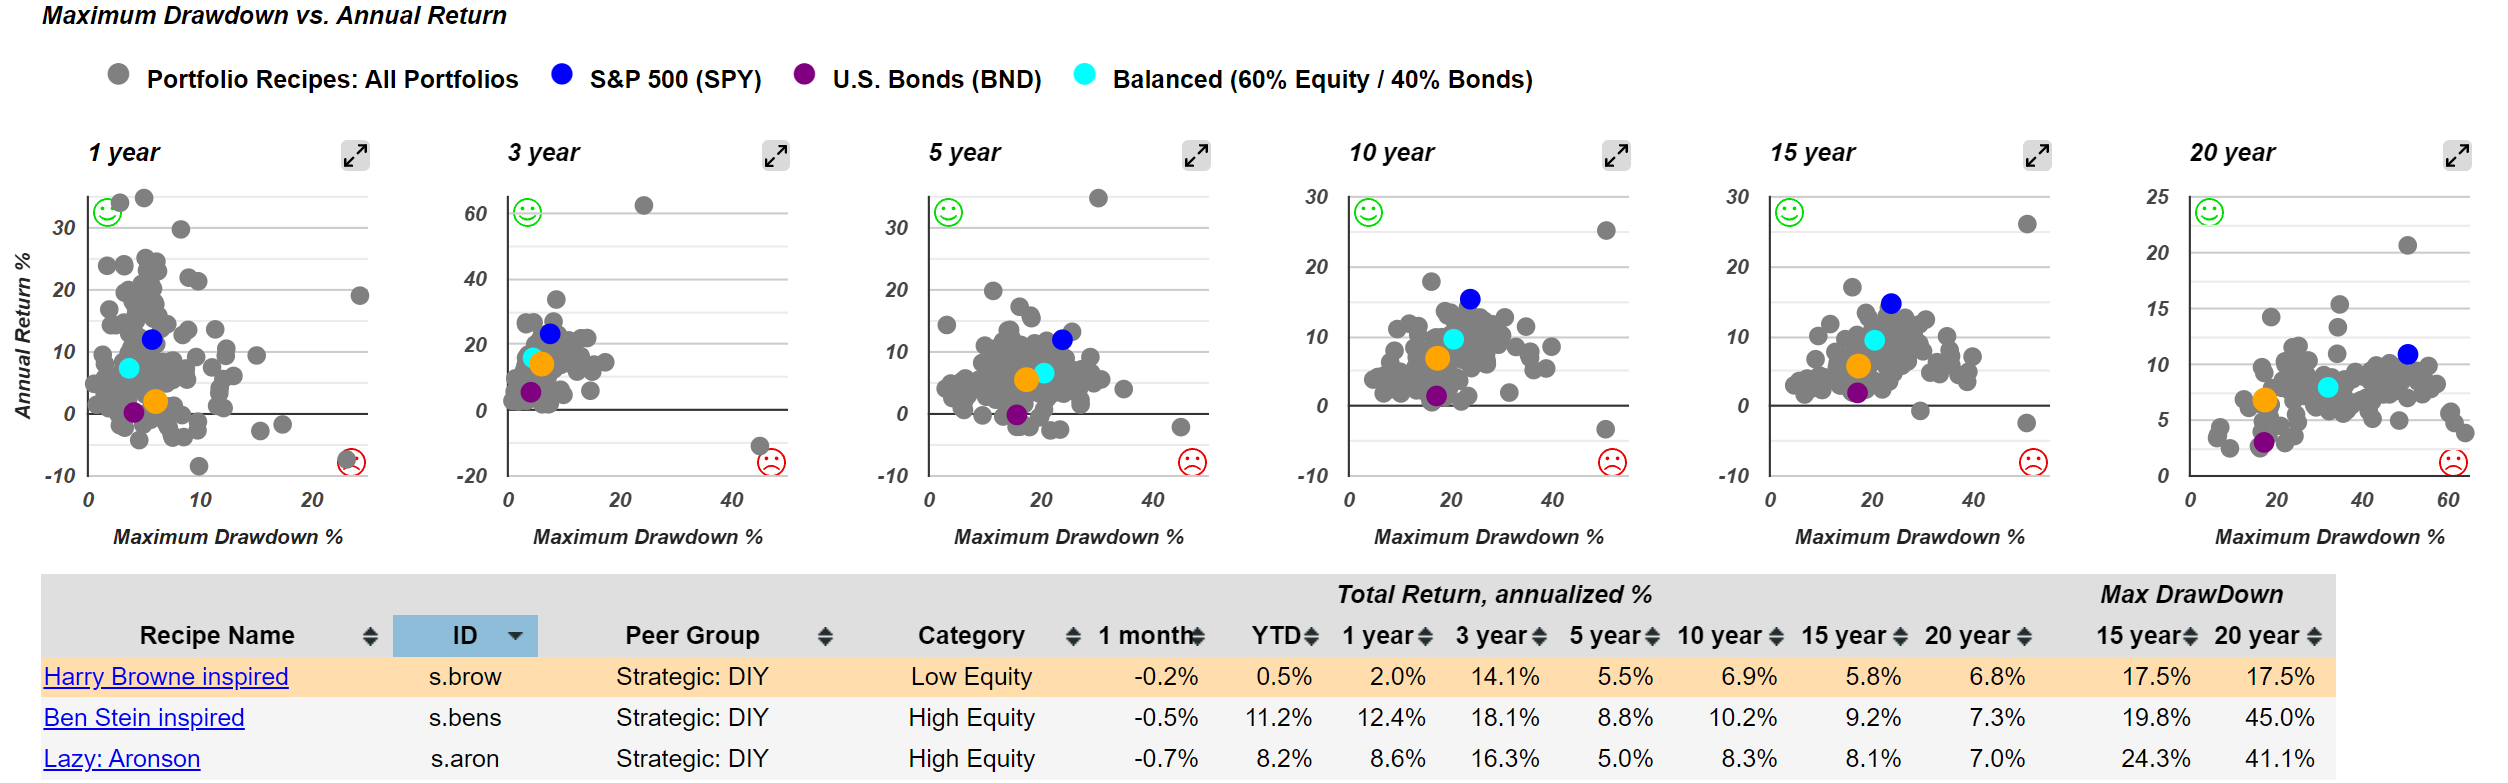
Over the past year, which may be too narrow a time horizon but is worth a quick look, the Permanent Portfolio has had a higher maximum drawdown than, for example, the Balanced 60/40 portfolio (s.6040), which has been discussed quite a bit and holds 60% broad equities and 40% broad bonds. Relative to that portfolio, the Permanent Portfolio sits to the right, which means a greater drawdown, and below, which means a lower return. This is not a very pretty picture for the Permanent Portfolio over the past year.
Over the past ten years, the Permanent Portfolio (in orange) sits below and to the left of the Balanced 60/40 portfolio. It has a lower drawdown, which is good, but also a lower return, which is an expected risk-return tradeoff. Over the past 15 years, the result is similar: a lower drawdown along with a lower return.
Even over the past 20 years, shown at the far right of the charts, the Permanent Portfolio has had a slightly lower return but quite a bit less drawdown. In fact, its drawdown over the past 20 years has been on par with the broad bond fund, as shown by the purple dot. An argument can be made that the investor receives almost as much return as a Balanced 60/40 portfolio with quite a bit less risk, as measured by maximum drawdown over the 20-year period.
According to the performance table, the Harry Browne Inspired Permanent Portfolio has returned 6.8% annualized over the last 20 years (roughly 7%), with a 17.5% drawdown.
PRPFX: A Mutual Fund Variation
Two other portfolios tracked by Recipe Investing are closely related to the Permanent Portfolio. Having seen how the Harry Browne portfolio has performed, the first to consider is PRPFX, a mutual fund designed around the Permanent Portfolio.
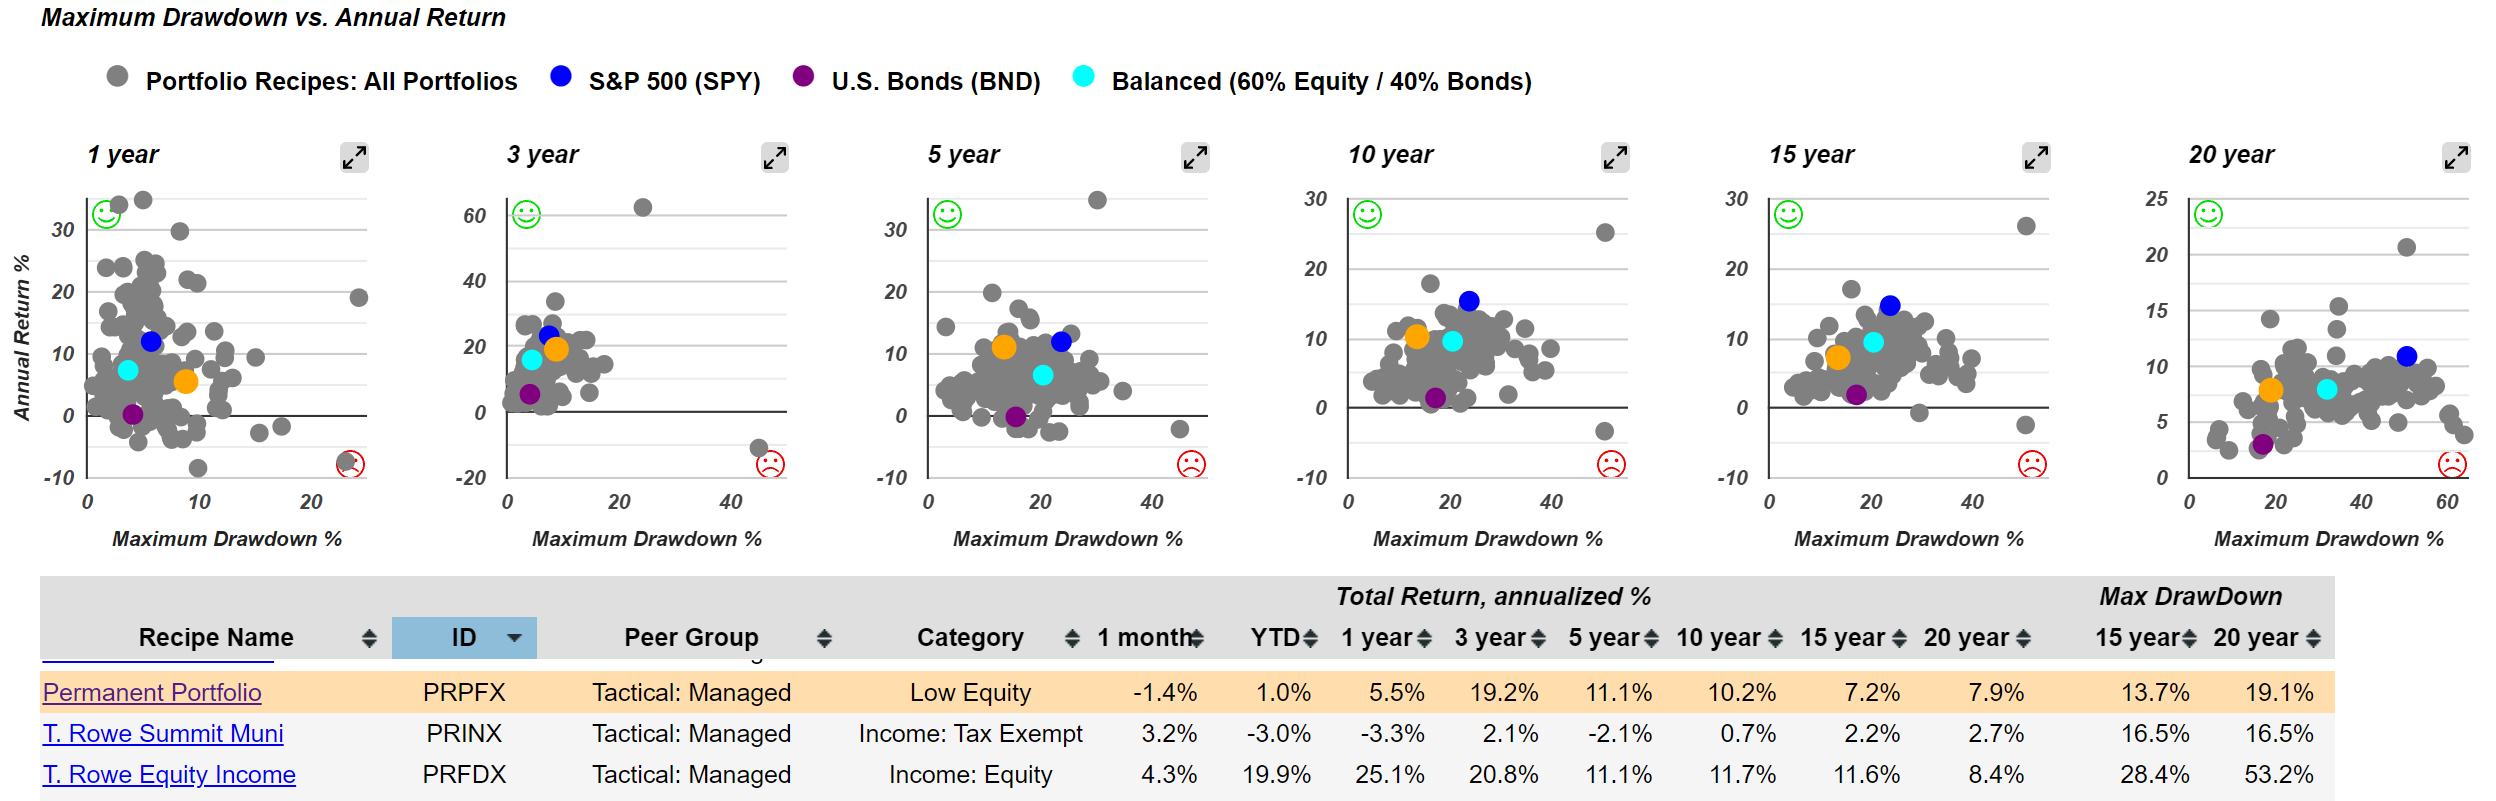
Interestingly, PRPFX is still within striking distance of the strict four-fund Permanent Portfolio built using the Harry Browne formula:
- PRPFX: about 7.9% annualized with a 19% drawdown
- Harry Browne Inspired Permanent Portfolio: 6.8% annualized with a 17.5% drawdown
PRPFX has done a bit better, and it does not hold only those four asset classes. Investors interested in the fund can research it further.
PRPFX has performed as follows over different periods:
- Past 20 years: it sits directly to the left of the Balanced 60/40 portfolio on the scatter plot, meaning its annualized return is almost identical, but with considerably less drawdown, which would be a positive for most investors
- Past 10 years: a better return with a lower drawdown
- Past 5 years: a better return with a lower drawdown
- Past 1 year: the results are not as strong
There seems to be some merit here, and the results lean toward an answer to the question of whether the Permanent Portfolio is still working after 20 years. It would appear so.
Permanent Plus: Removing the Cash Component
One additional portfolio is a variation of the Permanent Portfolio. It is called Permanent Plus (s.plus). The cash component has been removed because cash is designed to offer basically zero return. The reasoning is that, if markets are expected to go up on average with some down years, the cash component can simply be removed, which turns the Permanent Portfolio into a three-ETF portfolio recipe.
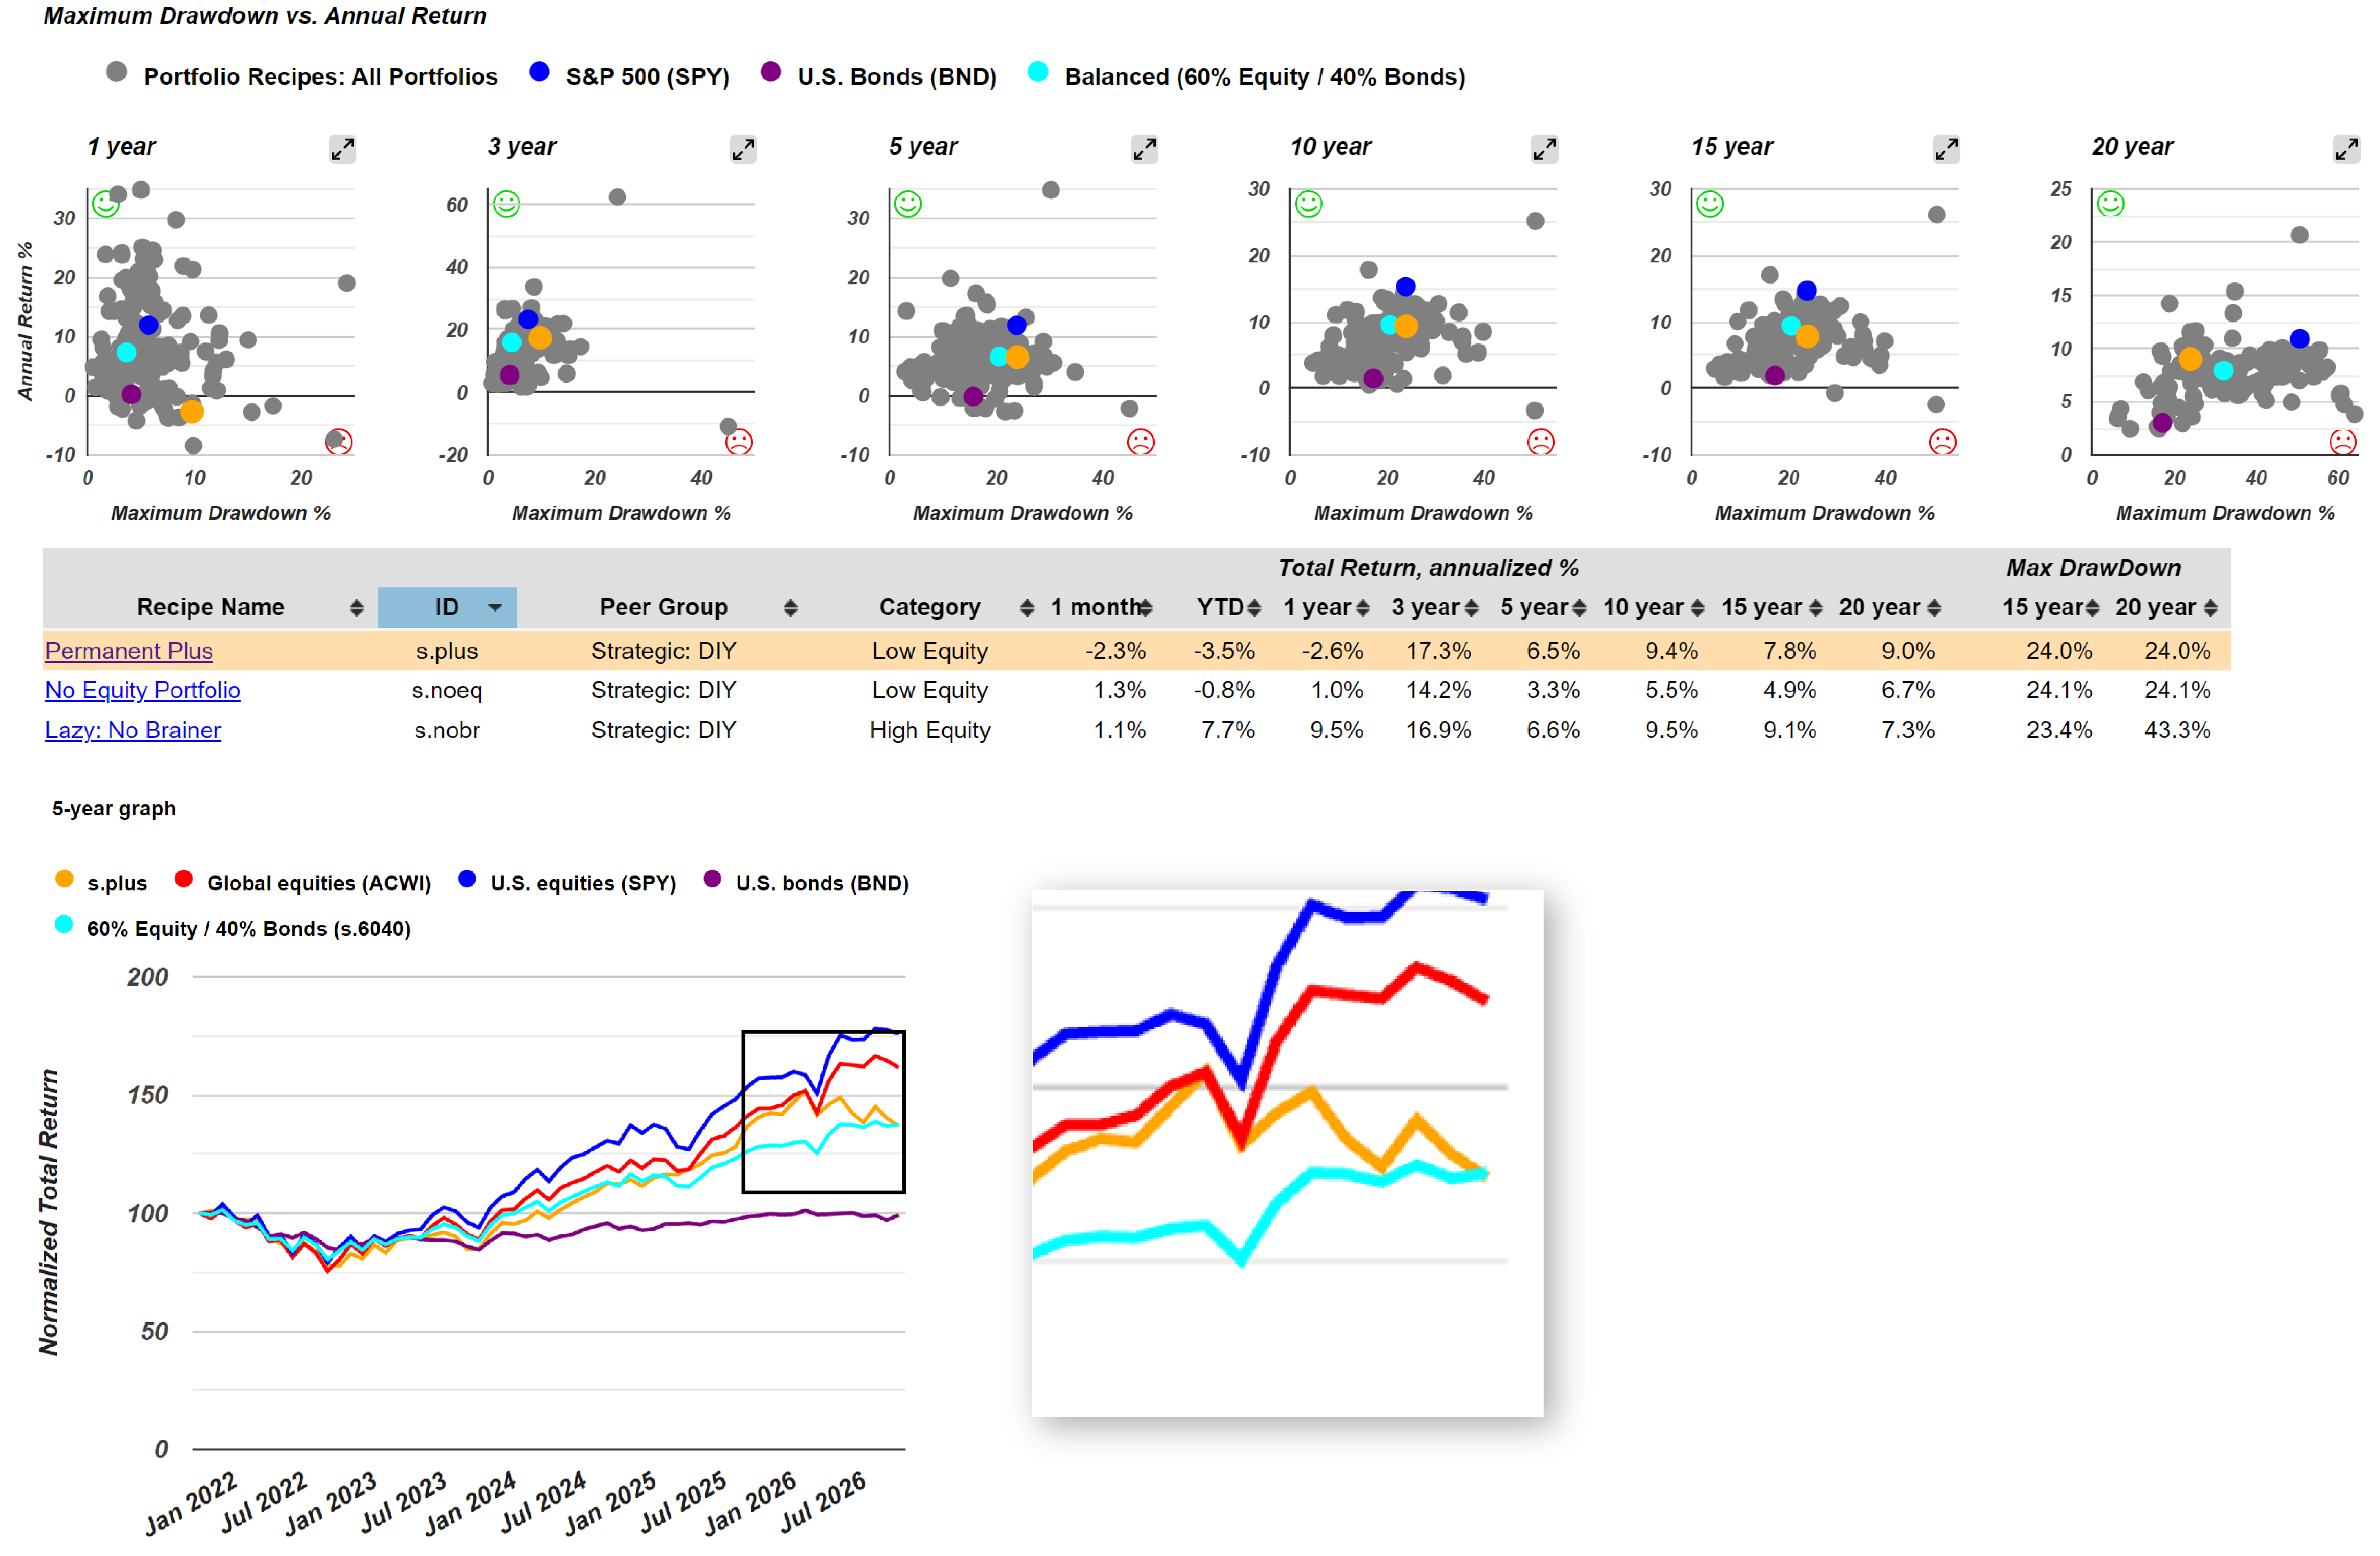
Permanent Plus has performed as follows over different periods:
- Past five years: It has lagged the S&P 500 (SPY) and Global Equities (ACWI), but it has landed in about the same place as the Balanced 60/40 portfolio. It has also had periods, especially over the last couple of years, when it did better than the Balanced 60/40 portfolio.
- Past 10 and 15 years: It has done worse than the Balanced 60/40 portfolio, with a greater drawdown and a lower return, which is fairly decisive in the wrong direction.
- Past 20 years: It has done better than the Balanced 60/40 portfolio in terms of return, with less drawdown.
Compared to the Balanced 60/40 portfolio, there is evidence of the Permanent Portfolio and its variations returning:
- Roughly 7% a year for the pure Harry Browne portfolio
- Approximately 8% a year for the mutual fund
- 9% annualized over the last 20 years for this variation, which removes the cash component, with a 24% drawdown
What the 20-Year Results Mean for Investors
Based on the 20-year results, the Permanent Portfolio is still working, and it does appear to offer some advantages over the Balanced 60/40 portfolio. The Harry Browne Inspired portfolio returned 6.8% annualized with a 17.5% drawdown, PRPFX returned about 7.9% with a 19% drawdown, and Permanent Plus (s.plus) returned 9% with a 24% drawdown. Returns and risk rose together, but for investors who want a largely set-it-and-forget-it portfolio, the trade-off may be acceptable.
Recipe Investing also tracks tactical portfolios that are momentum based or that look at individual sectors:
- Adaptive Allocation F (t.aaaf): a clear standout over the past 20 years
- Pure Momentum (t.pure)
- Quartile Sector Rotation (t.srqr): for investors with an appetite for something quite a bit riskier with quite a bit higher return, this portfolio rotates sectors on a quarterly basis and does a good job of getting in and out of sectors based on market dynamics
Together, these portfolios cover a range of risk and return profiles, from the static Permanent Portfolio and its variations to the tactical approaches above.