
Maximum Drawdown
Maximum Drawdown: How to Measure the Worst-Case Loss of a Portfolio
What is Maximum Drawdown?
Maximum Drawdown is the largest percentage drop a portfolio experienced from peak to trough over a given period, reflecting the worst-case loss for an investor who bought at the top and sold at the bottom. Since it is based on month-end data, the actual drawdown could be slightly larger if measured at a daily or intraday level.
What does the Maximum Drawdown tell you?
It tells you the worst loss a portfolio could have delivered over a given period, showing how much value was lost from its peak before recovering. It is a measure of downside risk and helps gauge how painful the ride could have been for an investor.
Why is the Maximum Drawdown important?
- It reveals the worst-case loss scenario, giving investors a realistic sense of the risk they are taking on.
- It helps compare portfolios by showing which one held up better during difficult market conditions.
What is a good Maximum Drawdown?
Lower is better, since we don't like our portfolio to lose value.
What is a typical range for the Maximum Drawdown?
This represents the range of maximum drawdown values for the 20-year period ending November 2025, as tracked by RecipeInvesting.com.
- Portfolio Recipes (investable model portfolios) range from a low of 6.3% for The Arbitrage Fund (ARBNX) to a high of 64.1% for Westwood Real Estate Inc Inst (KIFYX).
- Portfolio Ingredients (asset class ETFs) range from a low of 5.3% for iShares 1-3 Year Treasury Bond (SHY) to a high of 74.5% for Invesco DB Commodity Index Tracking Fund (DBC).
What do specific Maximum Drawdown values mean?
- A Maximum Drawdown of 0% means that the portfolio has not experienced any significant losses, indicating no major declines from its peak value. This suggests an extremely stable performance but is rare in real-world investing.
- A Maximum Drawdown of or 25% means that the portfolio has experienced a peak-to-trough decline of 25% before recovering. This indicates moderate risk, where the portfolio has faced notable but not extreme losses.
- A Maximum Drawdown of or 50% means that the portfolio has experienced a peak-to-trough decline of 50% before recovering. This indicates high risk, where the portfolio has lost half its value at some point.
What is the formula for the Maximum Drawdown?
$$ \text{Maximum Drawdown} = \frac{Peak - Trough}{\text{Peak}} $$
Where:
- Peak = highest portfolio value observed during a specific period
- Trough = lowest portfolio value following the peak before recovery
- Maximum Drawdown = largest percentage loss from peak to trough before a new peak occurs
How do you calculate Maximum Drawdown?
- Identify the peak, which is the highest portfolio value recorded during the period.
- Identify the trough, which is the lowest portfolio value that follows the peak before any recovery occurs.
- Subtract the trough from the peak to get the total drop in value.
- Divide that result by the peak value.
- The final figure, expressed as a percentage, is the Maximum Drawdown.
Can you explain Maximum Drawdown graphically?
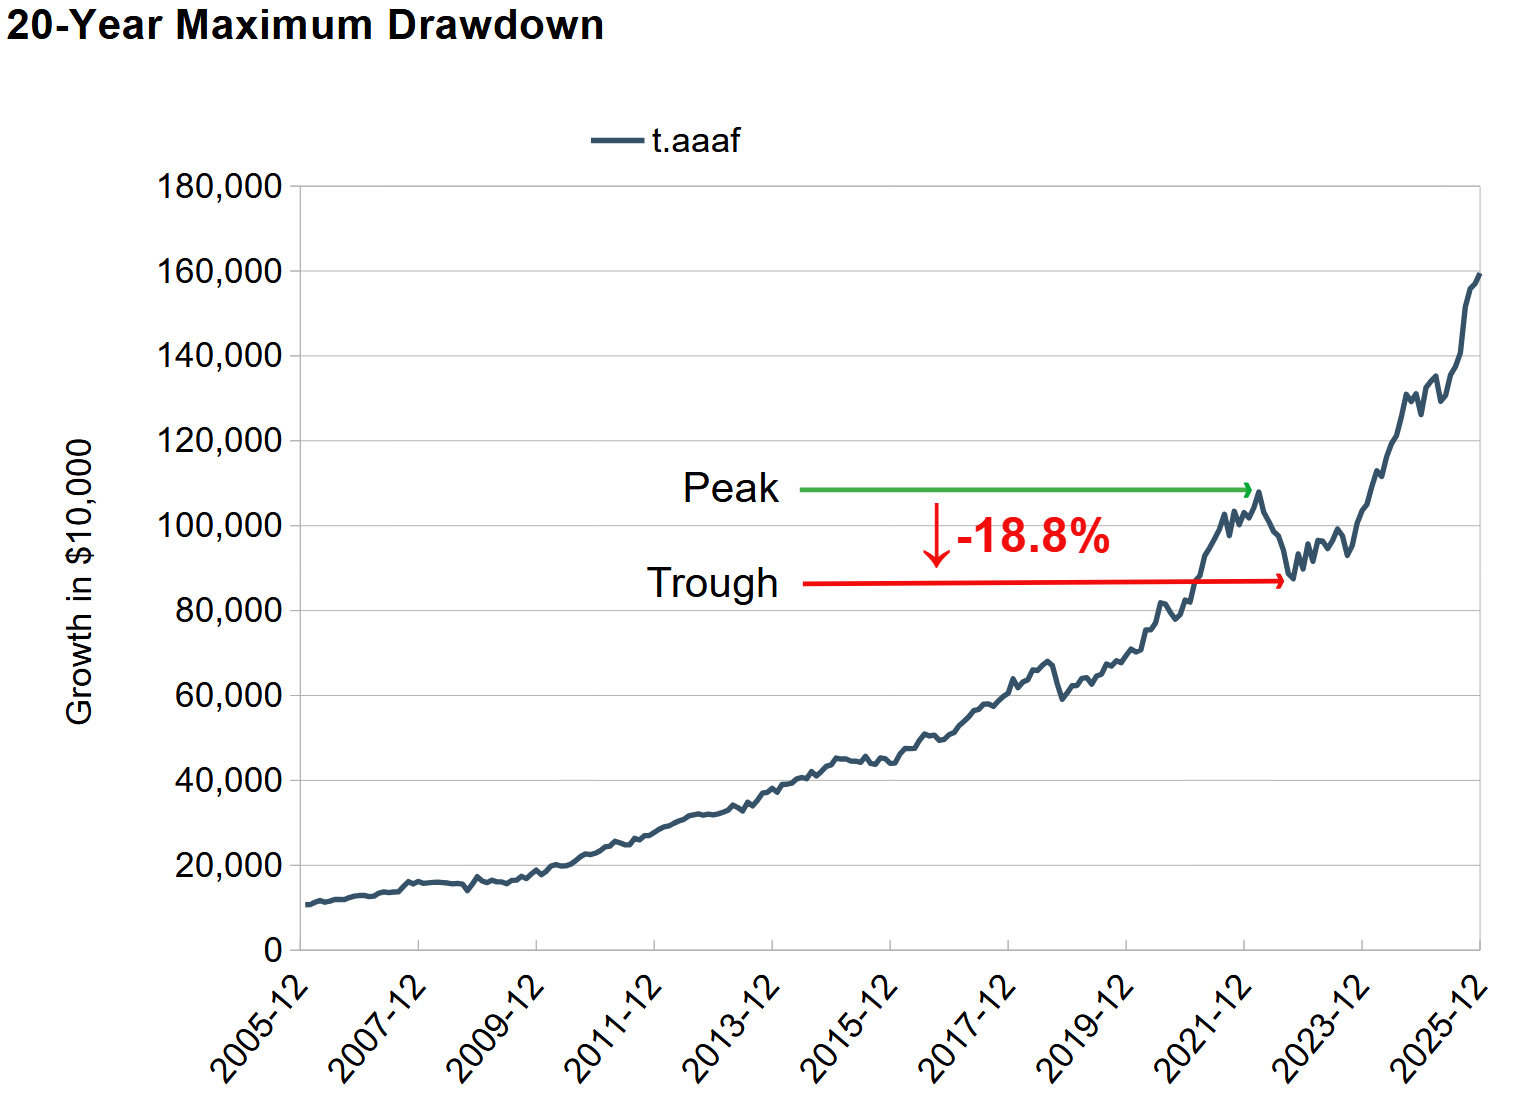
The chart illustrates Maximum Drawdown by marking the peak, the highest point the portfolio reached, and the trough, the lowest point that followed before recovery. The vertical distance between these two points, shown as -18.8%, represents the Maximum Drawdown, capturing the steepest decline the portfolio experienced over the 20-year period.
What is the Maximum Drawdown for example portfolios?
Portfolio | Ticker or ID | Description | Risk Level | Maximum Drawdown | Annualized Return |
1-3 Year Treasury Bond fund | SHY | short-term bond fund | very low | 5.3% | 2.0% |
Total Bond Market fund | BND | aggregate bond fund | low | 17.3% | 3.3% |
Balanced Portfolio | s.6040 | 60% stocks, 40% bonds | medium | 32.2% | 8.0% |
S&P 500 fund | SPY | large company stocks | this is "market risk" | 50.8% | 10.9% |
Nasdaq 100 Index fund | QQQ | tech-heavy,large company fund | high | 49.7% | 15.4% |
Adaptive Asset Allocation F | t.aaaf | tactical Portfolio Recipe from RecipeInvesting.com | decent risk/return tradeoff | 18.9% | 14.8% |