
Bonds, Risk, and Return: Portfolios That Might Beat the Balanced 60/40
Bonds, Risk, and Return: Portfolios That Might Beat the 60/40
October 2026
Topics this month
- How bonds have affected the Balanced 60/40 portfolio as the Fed raised rates, including flat bond returns in recent years and the portfolio's lower drawdown compared with the S&P 500
- Why the 60/40 portfolio remains a useful benchmark at the center of the tracked portfolios
- How the risk versus return compass identifies portfolios that beat the 60/40 portfolio over 20 years
- The Permanent Portfolio (PRPFX) and Faber Relative Strength: Top 3 (t.frs3) as portfolios that beat the 60/40 portfolio across multiple periods, with t.aaaf nearly making the cut
Welcome to the October 2026 RecipeInvesting Commentary. This month, we’re looking at bonds and their role in the balanced 60/40 portfolio. When bond yields are low, investors are unhappy with the income they receive. When yields rise, bond prices fall, and the grumbling continues. With the Fed raising rates, bond prices falling, and yields rising, how has this affected a portfolio made up of 60% equities and 40% bonds?
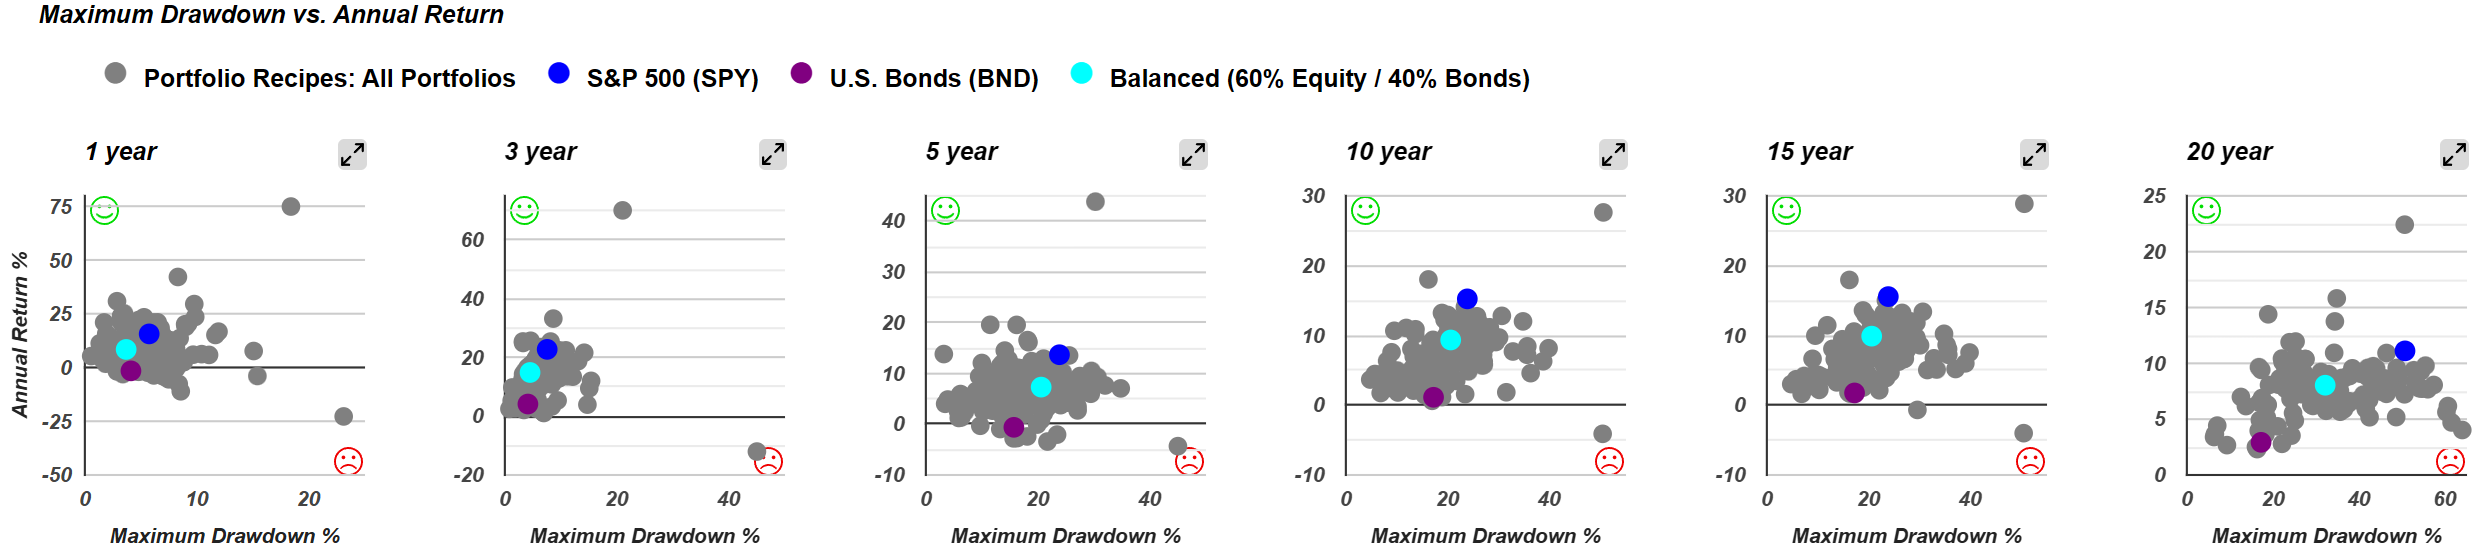
We use the balanced 60/40 portfolio (s.6040) as a benchmark for the hundreds of portfolios we track. On our scatter plots, a teal dot marks its position between a pure equity portfolio, represented by the S&P 500 ETF SPY in blue, and the aggregate bond fund BND in purple. As might be expected, the 60/40 portfolio falls approximately halfway between them.
Measuring return and drawdown
That position makes 60/40 a useful benchmark for asking which portfolios have delivered better returns with less risk, even during a difficult period for bond investors. Over the past 20 years, the balanced 60/40 portfolio has returned 8.0% annually, with a maximum drawdown of 32%.

Maximum drawdown is one measure of risk. We calculate it as the largest peak-to-trough decline using values at the end of each calendar month. To compare portfolios, we can look at both annualized return and maximum drawdown over several periods, including 5, 10, and 20 years. A portfolio may have a higher return than 60/40, but the question is whether it achieved that return with less risk.
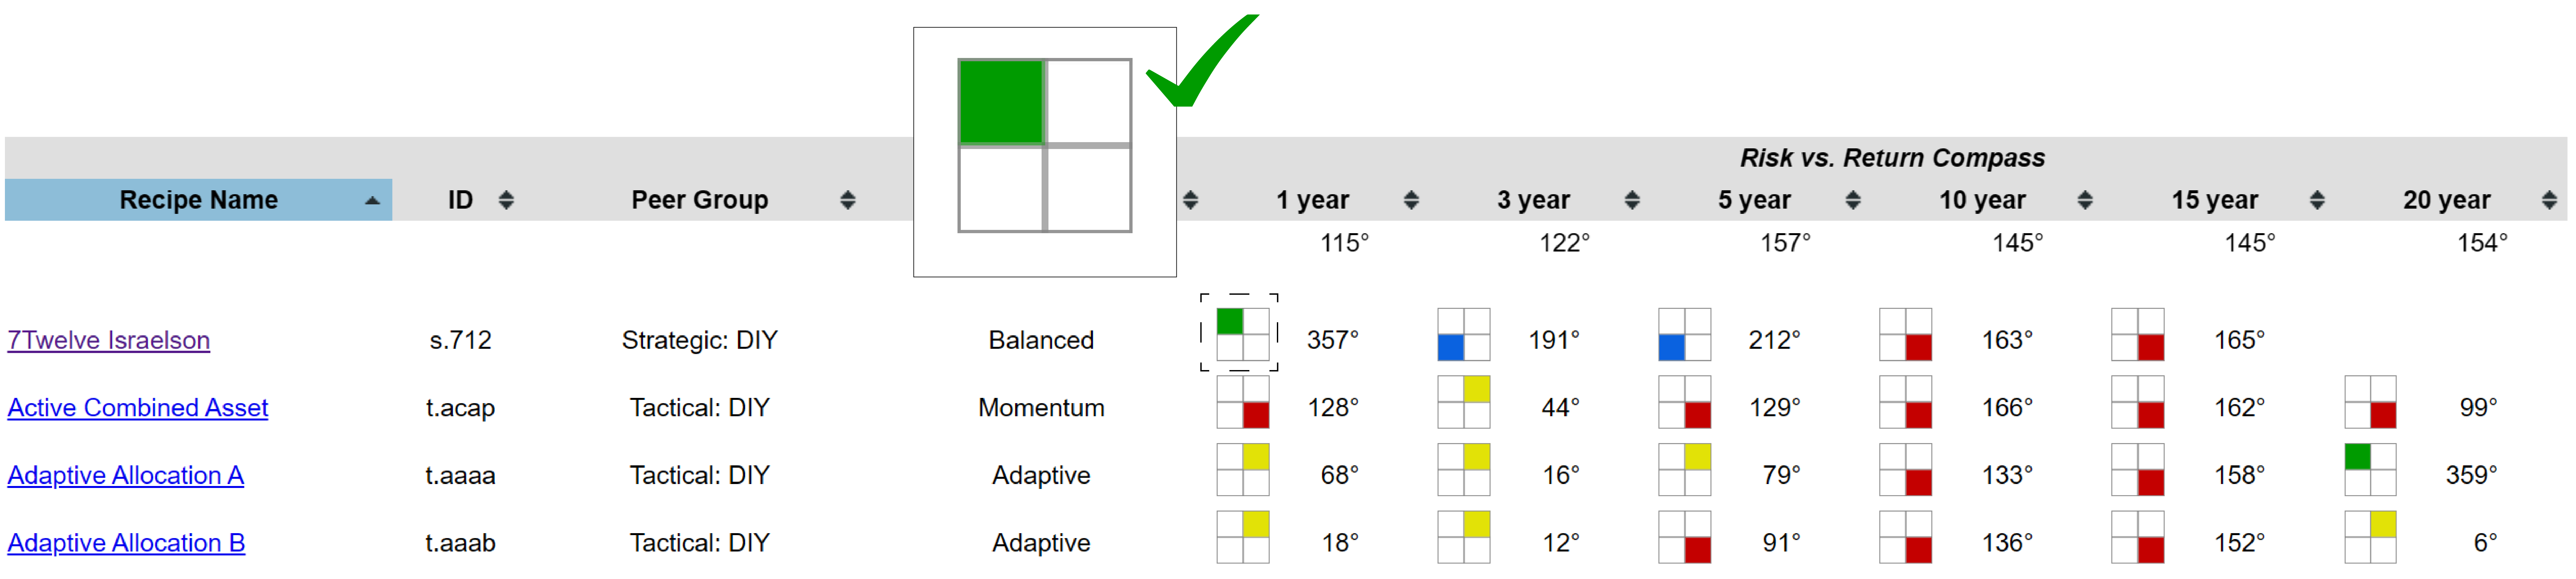
Our risk versus return compass presents that comparison graphically. It places risk on one axis and return on the other, with colored squares indicating how a portfolio compares with a 60/40 portfolio. A green square in the upper-left corner means the portfolio produced a higher return with lower risk. For example, the 7Twelve Israelson portfolio (s.712) receives a green square for the past year: it sits above 60/40 on return and to its left on risk.
Comparing portfolios over multiple periods

Three portfolios stand out in the comparison:
- Permanent Portfolio (PRPFX) receives green squares over the 5-, 10-, and 20-year periods. Over the past 1 and 3 years, it received yellow squares, indicating both higher return and higher risk than 60/40. That trade-off may appeal to investors comfortable with somewhat more risk. For the 5-, 10-, and 20-year periods, however, the Permanent Portfolio compares favorably on both measures.
- Faber Relative Strength: Top 3 (t.frs3) also comes out ahead over the 5-, 10-, and 20-year periods. We’ve tracked several portfolios published by Mebane Faber, and this one compares favorably over the past 1 and 15 years as well. It has not done so over the past 3 years, so investors would need to consider how that period fits their investment preferences.
- Adaptive Asset Allocation Portfolio F (t.aaaf) compares favorably over 10, 15, and 20 years. It has also delivered higher returns over the past 1, 3, and 5 years, but with somewhat more risk than 60/40 during those shorter periods. It therefore does not meet the same 5-, 10-, and 20-year test as the other two portfolios.
The 60/40 portfolio’s returns and stability
It is also useful to consider how 60/40 has performed on its own. In a five-year comparison, the bond portfolio started at a normalized value of about 100 and now sits slightly below that level. Its total return over the period has been essentially flat. Pure equity portfolios, both U.S. and international, have performed well.
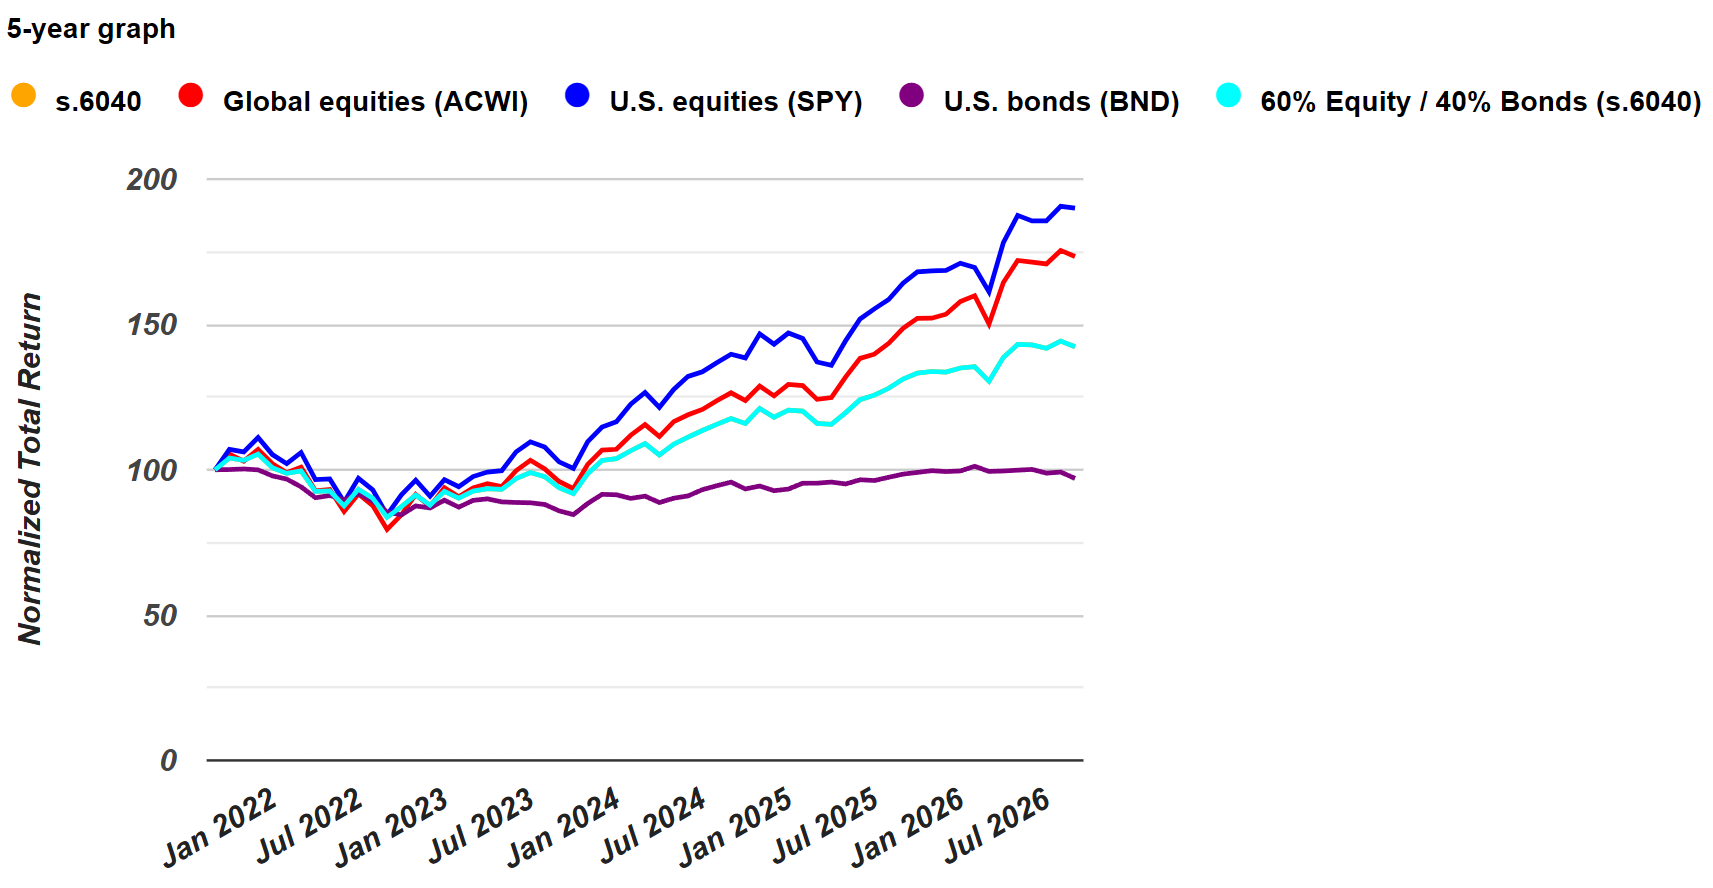
Bonds have been disappointing, but they have also provided stability. Their modest returns have held back the 60/40 portfolio relative to a pure equity portfolio, while helping to limit its drawdowns. On a risk comparison, 60/40 falls roughly between a pure bond portfolio and a pure equity portfolio.
In that sense, the balanced portfolio has done its job. It has not delivered the returns of a pure equity portfolio, but it has carried less risk. A 32% maximum drawdown over 20 years is still substantial, yet it is well below the roughly 50% drawdown of the S&P 500 over the same period. Investors need to weigh both sides of that trade-off.
Even in the current bond environment, we continue to use 60/40 as a benchmark because it sits near the middle of the portfolios we track. Portfolios such as t.aaaf, t.pure, and t.srqr have performed well on a risk-adjusted basis, while 60/40 provides a useful reference for judging whether a portfolio’s return has justified its risk.