Article - 4 Steps To Prepare Your Portfolio For The Coming Uncertainty
4 Steps To Prepare Your Portfolio For The Coming Uncertainty
- Market volatility is at an historic low, but uncertainty is all around us.
- The Minimum Variance Algorithm (MVA) presents an interesting way to build a lower-risk portfolio.
- We discuss the steps to choose the best inputs to run this algorithm for creating an effective portfolio.
- The resulting MVA portfolio has returned 10% annually over the past 10 years, based on the backtest.
"Never think that lack of variability is stability. Don't confuse lack of volatility with stability, ever."
- Nassim Nicholas Taleb
For many investors, a primary objective is to safeguard their investment from the market's volatility. The market may seem quiet (or at least favorable) at times, but that does not mean it's stable, as Taleb reminds us.
The benchmark S&P 500 Index has edged closer to an all-time high after Federal Reserve Chair Janet Yellen signaled that an interest rate increase is forthcoming. Also, there is an increased expectation that Donald Trump may stimulate the economy by reducing taxes and increasing infrastructure investment.
Looking at Exhibit A (below) the VIX is hovering near its 12-month low, which also happens to be near its all-time low.
Exhibit A: Chicago Board Option Exchange Volatility Index (VIX), past 12 months (Source: Yahoo Finance)
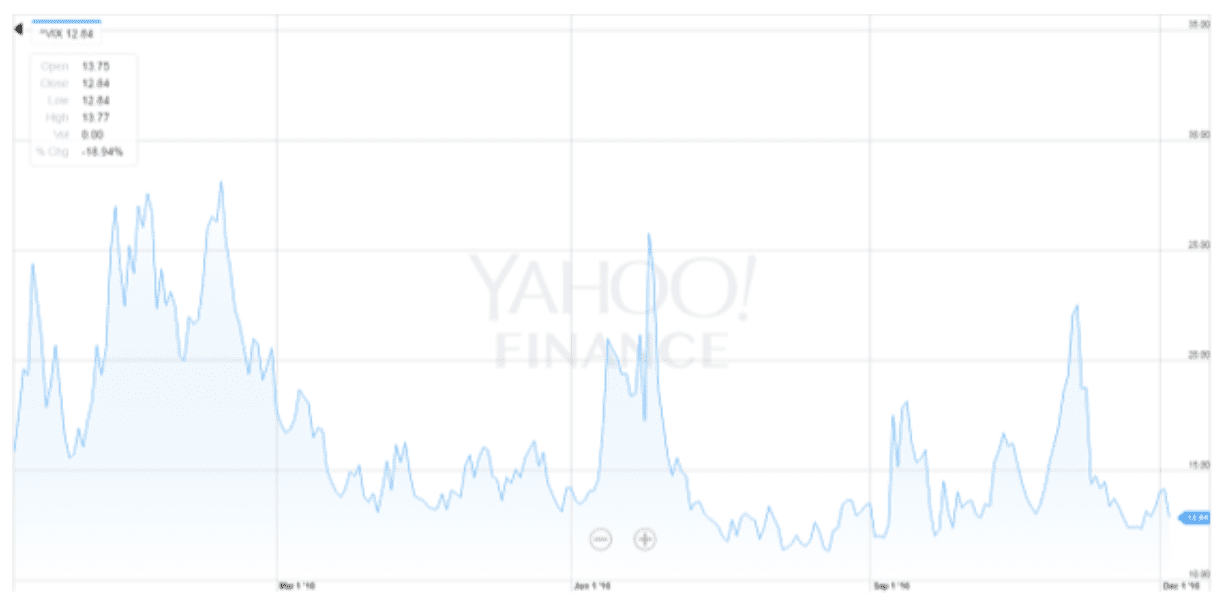
The S&P 500 Index is near an all-time high level, and its volatility is close to an all-time low. Even the CBOE S&P 500 Short-Term Volatility Index, which exhibits the market expectation of S&P 500 Index swings in the next nine days, has also reached to its all-time lowest level relative to the VIX.
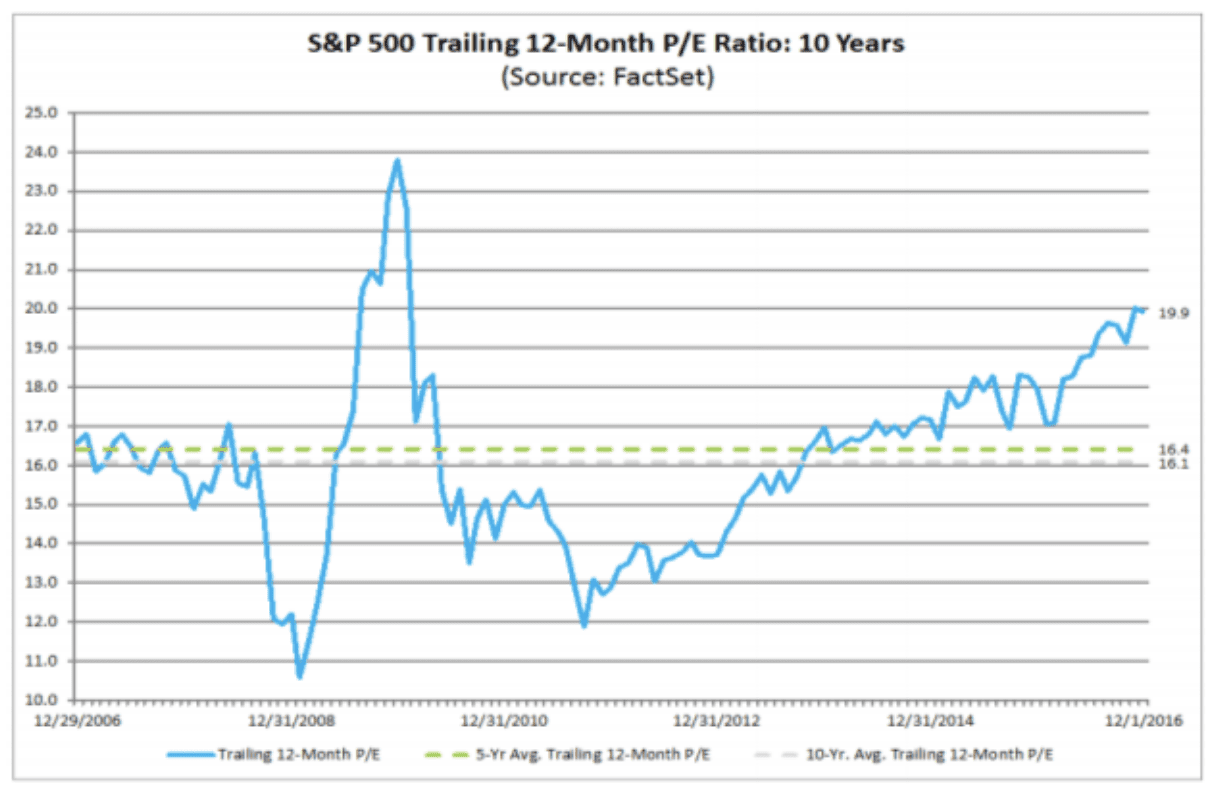
Exhibit B (below) shows that the trailing 12-month price-to-earnings ratio of the S&P 500 is trading at a post-crisis high of 19.9%. This could point to the current market being overly optimistic.
Exhibit B: S&P 500 Trailing 12-Month Price-to-Earnings Ratio
Using the CME FedWatch Tool, we see that future traders are pricing a more than 90% likelihood of higher interest rates in December. And the U.S. dollar index is currently trading at all-time high. Higher borrowing costs from rising interest rates combined with dollar appreciation may impact the corporate earnings unfavorably. So it's important that we diversify our portfolio so that we don't get burned by focusing too much on a particular asset class such as U.S. equities.
Applying the Minimum Variance Portfolio
We track the ingredients and performance for over 200 "portfolio recipes" (our name for asset allocation models) at RecipeInvesting.com. Several asset allocation portfolios continue to outperform the benchmarks. All of these use portfolio diversification to allocate into different asset classes and then re-allocate monthly. One portfolio diversification technique for reducing risk and maximizing returns is to select assets using the Minimum Variance Algorithm.
The fundamental approach of this portfolio recipe is to allocate each asset class such that the resulting portfolio has the lowest overall covariance. The Minimum Variance Portfolio (which we identify using the tag "t.mva3") gives investors access to a dynamic, tactical portfolio that uses an asset allocation algorithm which maximizes risk-adjusted return and responds to market conditions.
Let's take a closer look at four steps we can take to make the most of this method for creating a portfolio.
Four Steps to build an effective portfolio using the Minimum Variance Algorithm
- Choose a set of global asset classes
- Choose a reasonable lookback period
- Confirm that the results beat the benchmarks
- Beware of data snooping
Now let's discuss each of these in more detail, and review the performance of a portfolio that was created using these steps.
Step 1. Choose a set of global asset classes
We want to select a set of asset classes that are not distinct to one country, sector, or asset type. This increases the flexibility of the algorithm, and allows us to benefit from positive global trends, not just U.S. trends. This portfolio recipe invests in liquid, exchange-traded funds (ETFs). The 8 possible asset classes and corresponding ETFs are as follows:
- U.S. Large Cap Equity (SPY)
- U.S. Small Cap Equity (IWM)
- NASDAQ 100 Equity (QQQ)
- U.S. Real Estate (IYR)
- U.S. Long Term Treasury Bonds (TLT)
- Emerging Markets Equity (EEM)
- International Developed Markets Equity (EFA)
- Gold (GLD)
Although five of the eight are U.S. asset classes, the algorithm can choose an allocation to any of the assets in any proportion, thereby giving the portfolio global exposure.
Step 2. Choose a reasonable lookback period
The lookback period is the number of prior trading days that the algorithm uses to determine the relationships between the assets and the recommended amount of each asset to own. We want a lookback period that is short enough to adapt to market conditions, but long enough to capture the overall trend without jumping in and out of positions needlessly.
We are not interested in day-trading; we are interested in a portfolio recipe that updates once per month. So we should choose a lookback period that is at least one calendar month in length (approximately 22 trading days) but not so long that we are stuck in unfavorable assets based on their characteristics from many months ago.
We chose a lookback period of 60 trading days or approximately three calendar months for calculating the covariance required by the Minimum Variance Algorithm. This is the same lookback period specified by Michael Kapler in 2011 on his Systematic Investor blog.
Step 3. Confirm that the results beat the benchmarks
We want to make sure that effort to create this portfolio is worthwhile. The portfolio resulting from this algorithm must have the potential of at least outperforming the "no-brainer" benchmarks. For example, why bother with using a tactical algorithm like this if it can't even beat a dead-simple 60/40 (60% stocks and 40% bonds) portfolio?
Exhibit C (below) show portfolios ranked by total return over the past 1, 5, and 10 years. We have compared the t.mva3 portfolio to its tactical peer group and to three benchmarks: the S&P 500 , U.S. Bonds (NASDAQ:BND), and a balanced portfolio which is 60% Equity (NYSEARCA:VTI) and 40% Bonds . The time period is the span ending November 2016.
- Over the past year, t.mva3 portfolio has outperformed its peer group, the 60/40 balanced portfolio, and global equities.
- Over the past five years, t.mva3, with its 7.4% annual return, has lagged SPY's frothy 14.4% return. But it would be overly optimistic to think that SPY will continue to offer this return over the next five years. We need to prepare for more volatility.
- Over the past 10 years, t.mva3 does considerably better. Remember that only the 10-year period includes the market crisis of 2008. The 5-year column ignores the market turbulence of 2008.
Exhibit C: Total Return (Compound Annual Growth Rate)
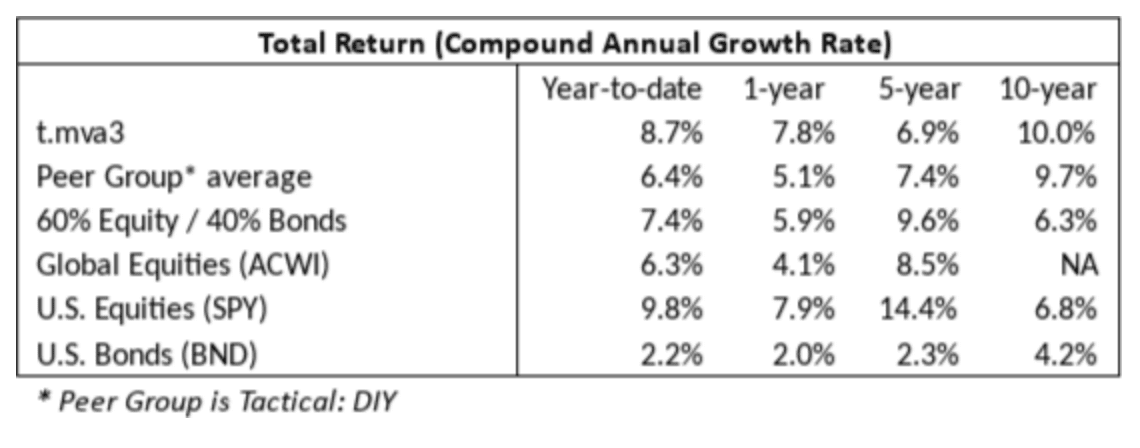
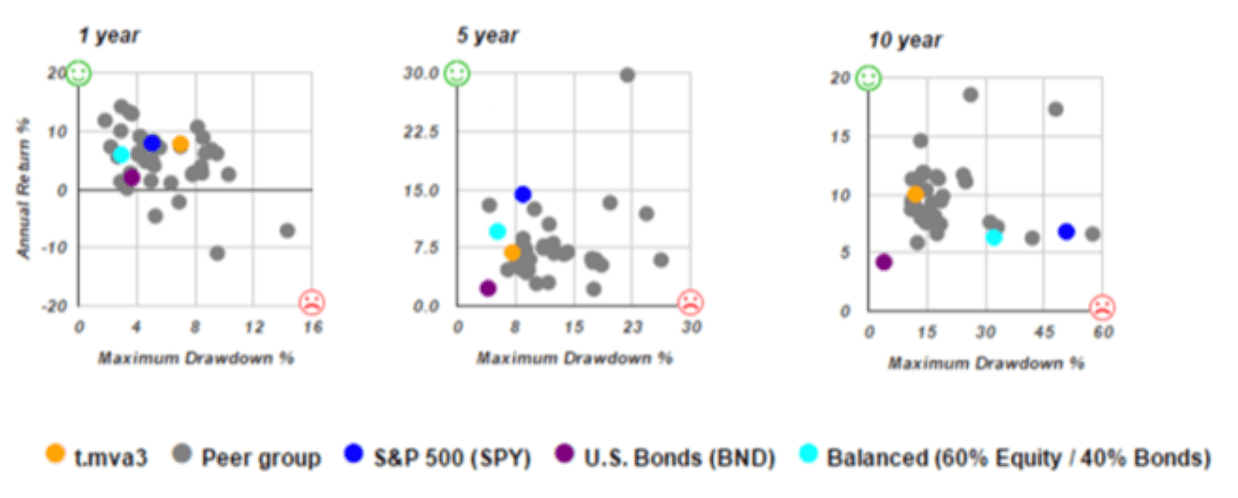
Exhibit D (below) gives a visual comparison of risk vs. return using scatterplots for the 1-, 5- and 10-year periods ending November 2016. We compare the Minimum Variance (t.mva3) recipe, shown as an orange dot, to three benchmarks. We use Maximum Drawdown as the risk measure. Standard deviation and downside deviation can also be used to measure risk and we create more scatterplots using those metrics at RecipeInvesting.com.
- In the 1-year scatterplot we can see the t.mva3 portfolio (the orange dot) slightly above the balanced portfolio (the light blue dot) but with a slightly larger maximum drawdown.
- Looking at the 10-year scatterplot, the real story emerges. This scatterplot includes the downturn of 2008, so we can see the brutal impact that period had on equity portfolios such as SPY. The dark blue dot represents the S&P 500 Index, using an ETF as a proxy. Note that the SPY blue dot is perilously close to the red frowny face, which is the worst-possible combination of low return with high risk. The orange dot, representing t.mva3, performs much better on a risk-adjusted basis. The t.mva3 orange dot is closer to the ideal top-right corner with green smiley face.
Exhibit D: Risk vs. Return Scatterplots
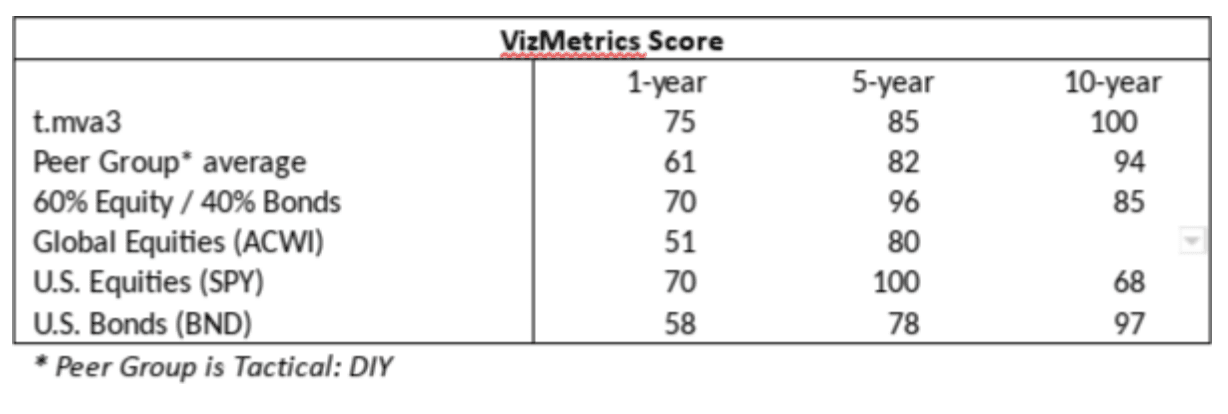
The VizMetrics Score is another method of ranking portfolios based on risk vs. return that has been described in a previous article. A score of 100 means that the portfolio has performed, on a risk adjusted basis, better than the best possible portfolio formed from a basket of global asset classes. In other words, the VizMetrics Score is a numerical measure of a portfolio's "northwest-ness" or how close it comes to reaching the ideal upper-left location (near the green smiley face) on the risk vs. return scatterplots.
Exhibit E (below) provides the VizMetrics Score for t.mva3 and benchmarks for the period ending November 2016. Based on the VizMetrics Score, we find t.mva3 portfolio to be a solid performer, and is the only portfolio shown that scores 75 or greater over the 1-, 5-, and 10-year time periods. Additional analysis at Recipeinvesting.com adds the 3-year and 7-year time period for all risk and return metrics.
Exhibit E: Exhibit E: The VizMetrics Score for the Minimum Variance Portfolio and Benchmarks
Step 4. Beware of Data Snooping
Data snooping is when an algorithm developer adjusts the input parameters to create the best possible output using historical data. In other words, the developer benefits from perfect hindsight. To minimize this, we have applied the same lookback period of 60 trading days that Michael Kapler used in 2011.
The antidote to data snooping is testing the algorithm out-of-sample, which means seeing how well the portfolio performs after the algorithm has been finalized. We have been running our MVA algorithm (which we identify as "t.mva3") since March 2014, but using Kapler's algorithm from 2011.
Conclusion
Since we don't know which global asset classes will zig upward and which will zag downward in the coming days, we need to be prepared with a strategy that can adapt to changing market conditions. We like the idea of a diversified portfolio that systematically minimizes risk.
The Minimum Variance Algorithm (as implemented in the t.mva3 example) provides a portfolio recipe that could help a prudent investor achieve a long-term return with less risk than the benchmark portfolios.
as published on
Disclosure: I am/we are long EFA, IWM, GLD, TLT, QQQ, SPY, EEM. I wrote this article myself, and it expresses my own opinions. I am not receiving compensation for it. I have no business relationship with any company whose stock is mentioned in this article.