Article - If Robert Parker Rated Portfolios: A New 100-Point Portfolio Scoring System For Measuring Risk Vs. Return
If Robert Parker Rated Portfolios: A New 100-Point Portfolio Scoring System For Measuring Risk Vs. Return
- We wanted a simple way to score portfolios, ETFs, and funds based on risk-adjusted return.
- But existing scoring methods have significant limitations.
- So we created the V-score™: a 100-point scale for identifying winners and losers based on risk vs. return.
- The V-score reveals some interesting investment ideas.
Robert Parker is a respected wine critic who publishes ratings for every major variety of wine. He rates wines from all over the world with a single, easy-to-understand score based on a maximum of 100 points. A score of 90 to 100 is outstanding, 80's are very good, and anything below 60 is awful. It's easy to compare hundreds of vintages using the "Parker Rating."
The Question
Since the Parker Rating is useful for choosing wine, how can we create a 100-point rating system for investment portfolios and funds?
Using risk and return analytics, we developed a 100-point scoring system that can be applied consistently to any portfolio, money manager, ETF, or fund. We calculated scores for some famous managers and portfolios and the surprising results are provided at the end of this article.
Limitations of existing scoring systems
Before we began work, we examined existing portfolio scoring methods to understand their limitations.
- Ranking by Return Only ignores risk and can emphasize managers who have achieved returns by taking on too much risk.
- The Sharpe ratio produces a risk-adjusted score but comparing portfolios can be tricky since it doesn't use a percentage or fixed scale. Also, the Sharpe Ratio treats all volatility the same, thereby penalizing portfolios for their desirable, upside variation.
- The Sortino ratio removes the upside penalty of the Sharpe ratio, but still produces an unscaled, unitless number.
- Morningstar Star Ratings™ range from 1-star to 5-star, but there have been several criticisms of the Morningstar rating approach, including the following:
- Turkeys and eagles in the same nest. Each star rating can cover a wide range of risk-adjusted performance. For example, a portfolio in the 89th percentile and another portfolio in the 68th percentile would both receive 4 stars.
- Penalty for soaring high. The star rating methodology penalizes portfolios for upside variation, although Morningstar says they place "an emphasis on downside variation."
- Fake eagles. Since each portfolio is scored against its peers a poor-performing portfolio can receive a high rating as long as it beats its peers. In fact, every peer group (e.g., Large Cap Equities, Commodities, Taxable Bonds) will include 5-star funds no matter how poorly the group has performed compared to other asset classes.
- Fake turkeys. The star ratings can force decent portfolios in top-performing peer groups to receive a low rating. This is because the star ratings are based on a forced ranking, where 32.5% of the portfolios in a peer group must receive a 1-star or 2-star rating, even if their performance is close to the top performers.
- Eaglets beat adults. Recently-founded portfolios that have only seen a bull market can beat solid, established portfolios that were around during the last downturn. Here's how this can happen: a young fund with just 3 years of history receives a top star rating. An older, more established fund gets a lower star rating, since ratings for older funds also include 5- and 10-year performance. We think this is unfair.
Our dream scoring system
Based on our research, an ideal method for scoring portfolios would include the following:
- A zero to 100-point scale. Like Robert Parker, we'd like a scale where the best portfolios can receive a score of 100. We want one number that combines risk and return.
- An absolute standard. We want a score that consistently measures risk vs. return using a tough standard. We want to judge all types of portfolios using the same measure. We do not want to give a portfolio a high score just because it beat its mediocre peers.
- No upside penalty. We do not want to penalize a portfolio for its upside performance.
- Multiple historical periods. We want to score a portfolio over the past 3, 5, 7, and 10 years. By doing this, the 7-year and 10-year scores include the 2008 downturn and allow us to measure a portfolio's consistency over time.
Solution: The V-score™
To implement our ideal scoring method, we created the V-score, a 100-point scoring system for measuring risk-adjusted return. We can use the V-score to rate any portfolio. Here's how the V-score is constructed:
Step 1. Find the benchmark portfolio.
For a given time period, such as the past 7 years, we find the "best global portfolio" (BGP) to serve as the benchmark for the V-score. The BGP is the best theoretical, risk-adjusted portfolio that could have been formed from a set of 14 global asset classes.
Yes, we know that "hindsight is 20-20," but the BGP serves as a tough benchmark and receives a V-score of 100. This "perfect hindsight" portfolio is a high bar, but we prefer using this high standard instead of giving one-third of all portfolios four or five stars.
Any active manager who maintains a consistently high V-score (and some do!) is performing quite well.
Figure 1 (below) shows the BGP benchmark portfolio (in green) which receives a V-score of 100. Note that the BGP has the optimal risk vs. return trade-off, and is the portfolio closest to the top left corner of the graph.
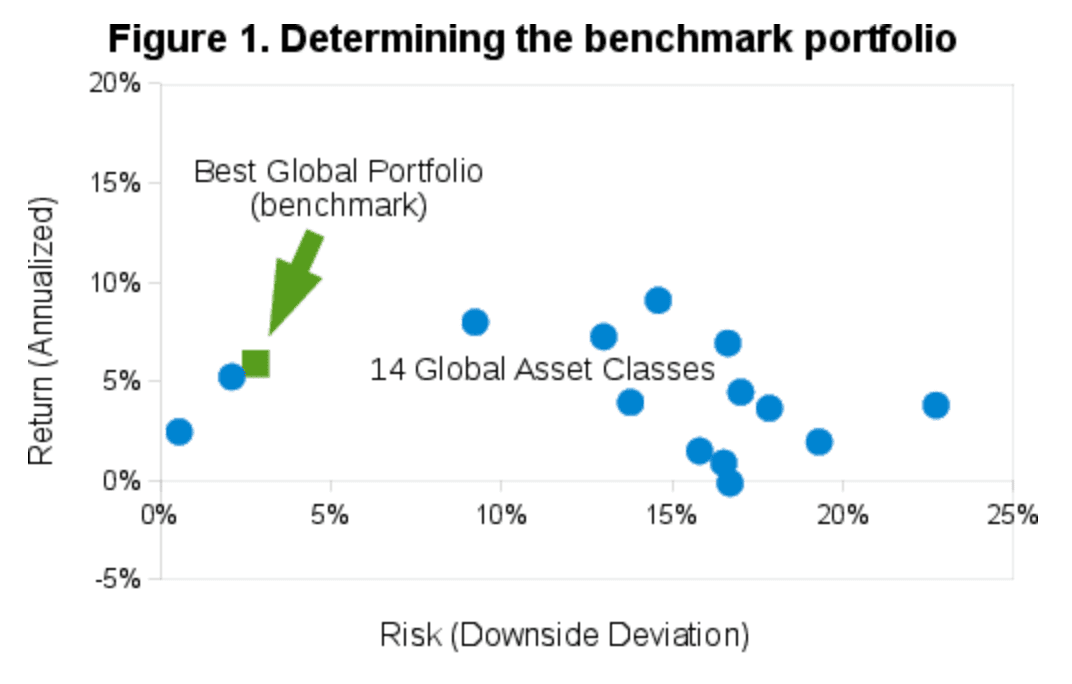
We also find the "worst global portfolio," again using the same set of global asset classes. This worst portfolio is the blue dot at the far right of Figure 1. This portfolio receives a V-score of zero.
Step 2. Create iso-score lines.
Next we draw diagonal lines for each V-score. Portfolios falling on each of these iso-score lines will receive the same V-score, since the portfolios each have the same risk-return trade-off. This is shown in Figure 2, below. The BGP appears as a green square on the yellow line, where V-score = 100. The "worst global portfolio" appears as a blue circle on the red line, where V-score = 0. In the middle, the orange line represents V-score = 50.
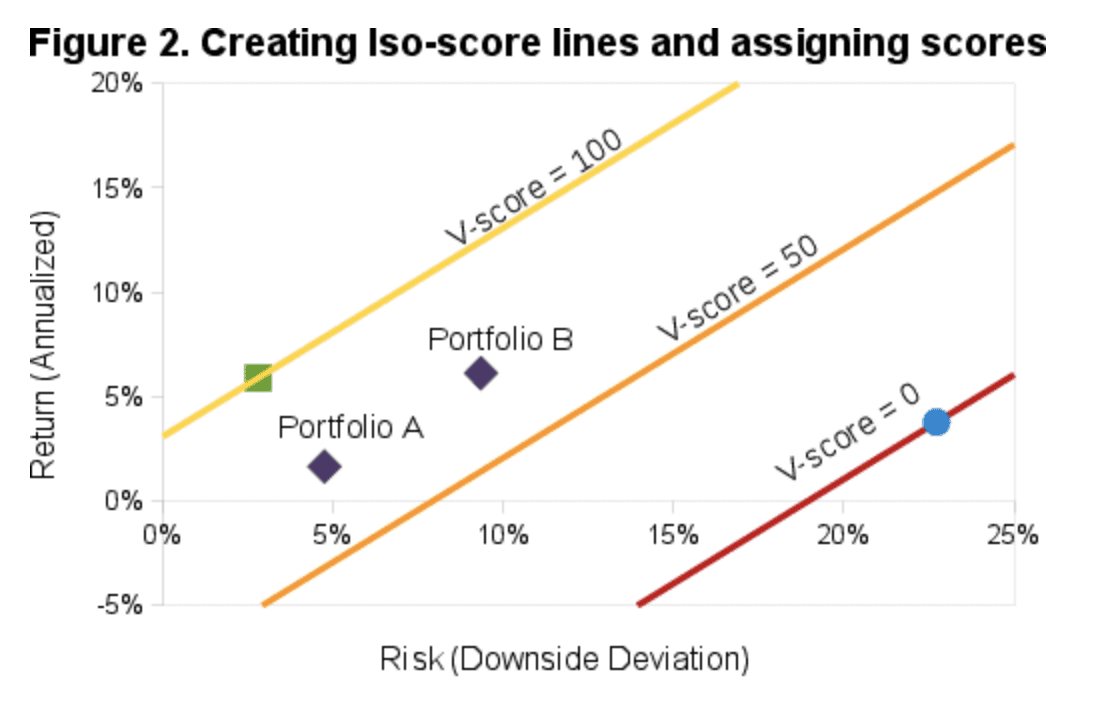
Step 3. Assign scores.
Now any portfolio can be plotted on this graph based on its risk (x-axis) and return (y-axis) and then assigned a score. For example, Portfolio A in Figure 2 (above) receives a score of 70 since it lies on the "V-score = 70" line. Portfolio B, which has higher risk, also has proportionally higher return, so it also receives a V-score of 70. An investor can decide between A or B based his risk/return preference.
To view the V-score for over 700 portfolios, funds, and managers, download a VizMetrics Report from the VizMetrics Free Trial subscription. These reports also include 1, 3, 5, and 10-year risk and return metrics.
The V-Score in Action
Now let's apply the V-score to some well-known portfolios and managers. Table 1 (below) shows V-score above 80 in bold, and V-scores below 50 in red
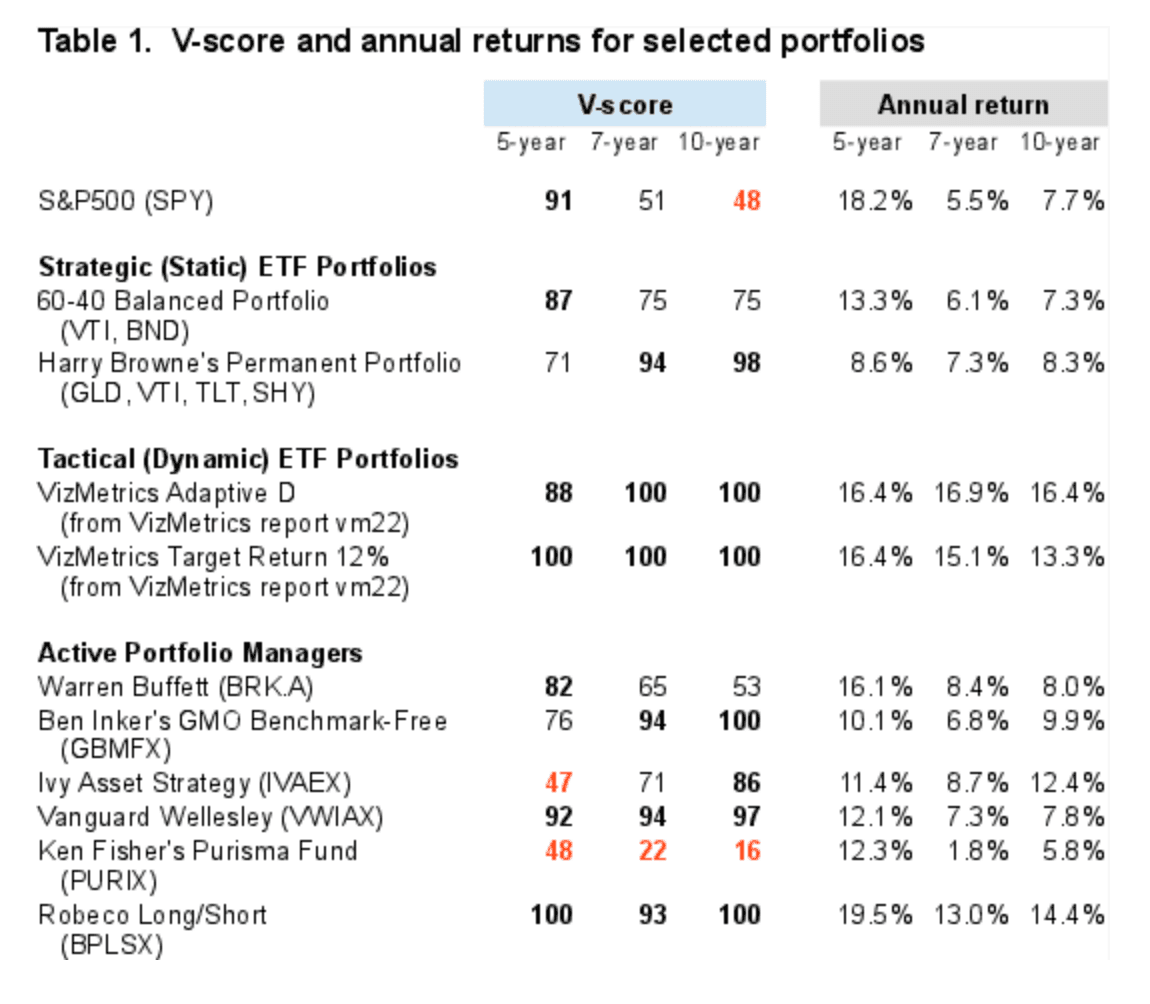
Some observations and investing ideas based on the V-score:
- Robeco's long-short fund (MUTF:BPLSX) has been a consistent high-performer, scoring a perfect 100 over the past 5 and 10 years.
- Tactical ETF portfolios perform better than static portfolios. The best tactical approaches can consistently score in the 90 to 100 range.
- Vanguard Wellesley is a strong performer with V-scores in the 90's over the past 5, 7, and 10 years. It appears to be "earning its keep" by consistently outperforming a static 60-40 balanced portfolio consisting of 60% VTI and 40% BND.
- Harry Browne's "Permanent Portfolio" (made of equal parts GLD, VTI, TLT, and SHY) has done well, but its V-score has slipped to 71 over the past 5 years.
- Ivy Asset Strategy (MUTF:IVAEX) and Ken Fisher's Purisma Fund (MUTF:PURIX) both get a 2-star rating from Morningstar, but the V-score shows that Ivy Asset Strategy, with a V-score of 86 over the past 10 years, is by far a more consistent performer.
- Ken Fisher's Purisma Fund (PURIX), with a V-score of 16 over the past 10 years, has been a consistently poor performer and ranks among the worst of all funds scored.
- On a risk-adjusted basis over the past 10 years, the old standby 60-40 balanced portfolio (with V-score of 75) has been a better choice than the S&P 500 (with V-score of 48), even though the annual returns are similar.
- Warren Buffett (NYSE:BRK.A) with a 10-year V-score of 53 has performed only slightly better than the S&P 500, which has a 10-year V-score of 48.
To see 129 portfolios ranked by V-score for the 7 years ending May 2014, visit the V-Score Ranking page.
conclusion
The V-Score™ is a valuable tool for comparing portfolios and managers on a risk-adjusted basis. The V-score requires a portfolio to earn a return that is consistent with the risk taken. Investors and advisers can use the V-score to quickly find top portfolios across multiple categories.
Achieving a high V-score is difficult since all portfolios are compared to an optimal global portfolio. By using this absolute standard for scoring, the V-score avoids "grade inflation" and does not allow poor performing portfolios to receive a high score.
as published on
Disclosure: I am/we are long EFA, IWM, GLD, TLT, QQQ, SPY, EEM. I wrote this article myself, and it expresses my own opinions. I am not receiving compensation for it. I have no business relationship with any company whose stock is mentioned in this article.