
Vanguard Funds Risk-Return Metrics: A 20-Year Performance Analysis
Vanguard Funds Risk-Return Metrics: A 20-Year Performance Analysis
March 2026
Topics this month
- 20-year risk-return analysis of Vanguard ETFs and mutual funds versus the S&P 500
- Evaluation of Vanguard funds using downside deviation and Sortino ratio metrics
- Benchmark comparison with the Balanced 60/40 portfolio
- Tactical portfolio recipes that outperform traditional index funds on a risk-adjusted basis
Welcome to the March 2026 commentary from RecipeInvesting.com. This edition highlights the specialized features available through the Pro subscription level, which expands upon the foundational tools provided in the standard Investor tier. A key benefit for the Pro investor is access to "Fund Insights." This feature provides an in-depth look at several of the industry's leading fund families, including Vanguard, Fidelity, iShares, and American Funds.
The primary focus of this analysis is a detailed exploration of Vanguard funds. By examining these specific offerings, an investor can better understand how they compare to the various tactical portfolio recipes tracked at RecipeInvesting.com, ultimately providing a clearer picture of available strategic options.
The 20-Year Benchmark Challenge
This analysis examines the comprehensive catalog of Vanguard exchange-traded funds (ETFs) and mutual funds, tracking their performance over the past 20 years. A central question many investors may have never considered is how many of these funds have successfully outperformed the S&P 500 (SPY) in terms of both risk and return over two decades. To visualize this, a scatter plot is utilized where the horizontal axis represents the chosen risk measure and the vertical axis represents the return measure.
An investor seeking superior performance looks for funds positioned in the upper-left region of this plot, indicating a higher return with lower risk than the benchmark. While several risk metrics are available, this analysis prioritizes downside deviation. Unlike standard deviation, which accounts for all price swings, downside deviation focuses exclusively on "bad" volatility or market drops. This metric serves as the foundation for the Sortino ratio and provides a highly practical risk assessment for the long-term investor.

The 20-year performance graph reveals a comprehensive view of Vanguard’s offerings. In this visualization, each gray dot represents a specific Vanguard portfolio, while the blue dot represents the S&P 500 benchmark. An analysis of this data yields a striking insight: not a single Vanguard fund has outperformed the S&P 500 in terms of both risk and return over the last two decades. For this comparison, performance is defined by two specific metrics: risk, which is measured by downside deviation and return, measured by total annual return. While various tactical asset allocation portfolios have successfully beaten the S&P 500, these options exist outside of the Vanguard fund family.
Alternative Benchmarking: The 60/40 Balanced Portfolio
If an investor shifts the benchmark from the S&P 500 to a 60/40 Balanced Portfolio (comprising 60% equities and 40% bonds), the landscape changes slightly. Under this criteria, one specific fund emerges as a top performer: Vanguard Balanced Index Fund (VBIAX) ; this fund is the sole Vanguard offering that appears to outperform the 60/40 benchmark.
However, it is important to note that the performance of VBIAX is effectively equivalent to the benchmark itself. For an investor utilizing a 60/40 strategy rather than focusing strictly on the S&P 500, this fund provides a result nearly identical to the target allocation.
Measuring Efficiency via the Sortino Ratio
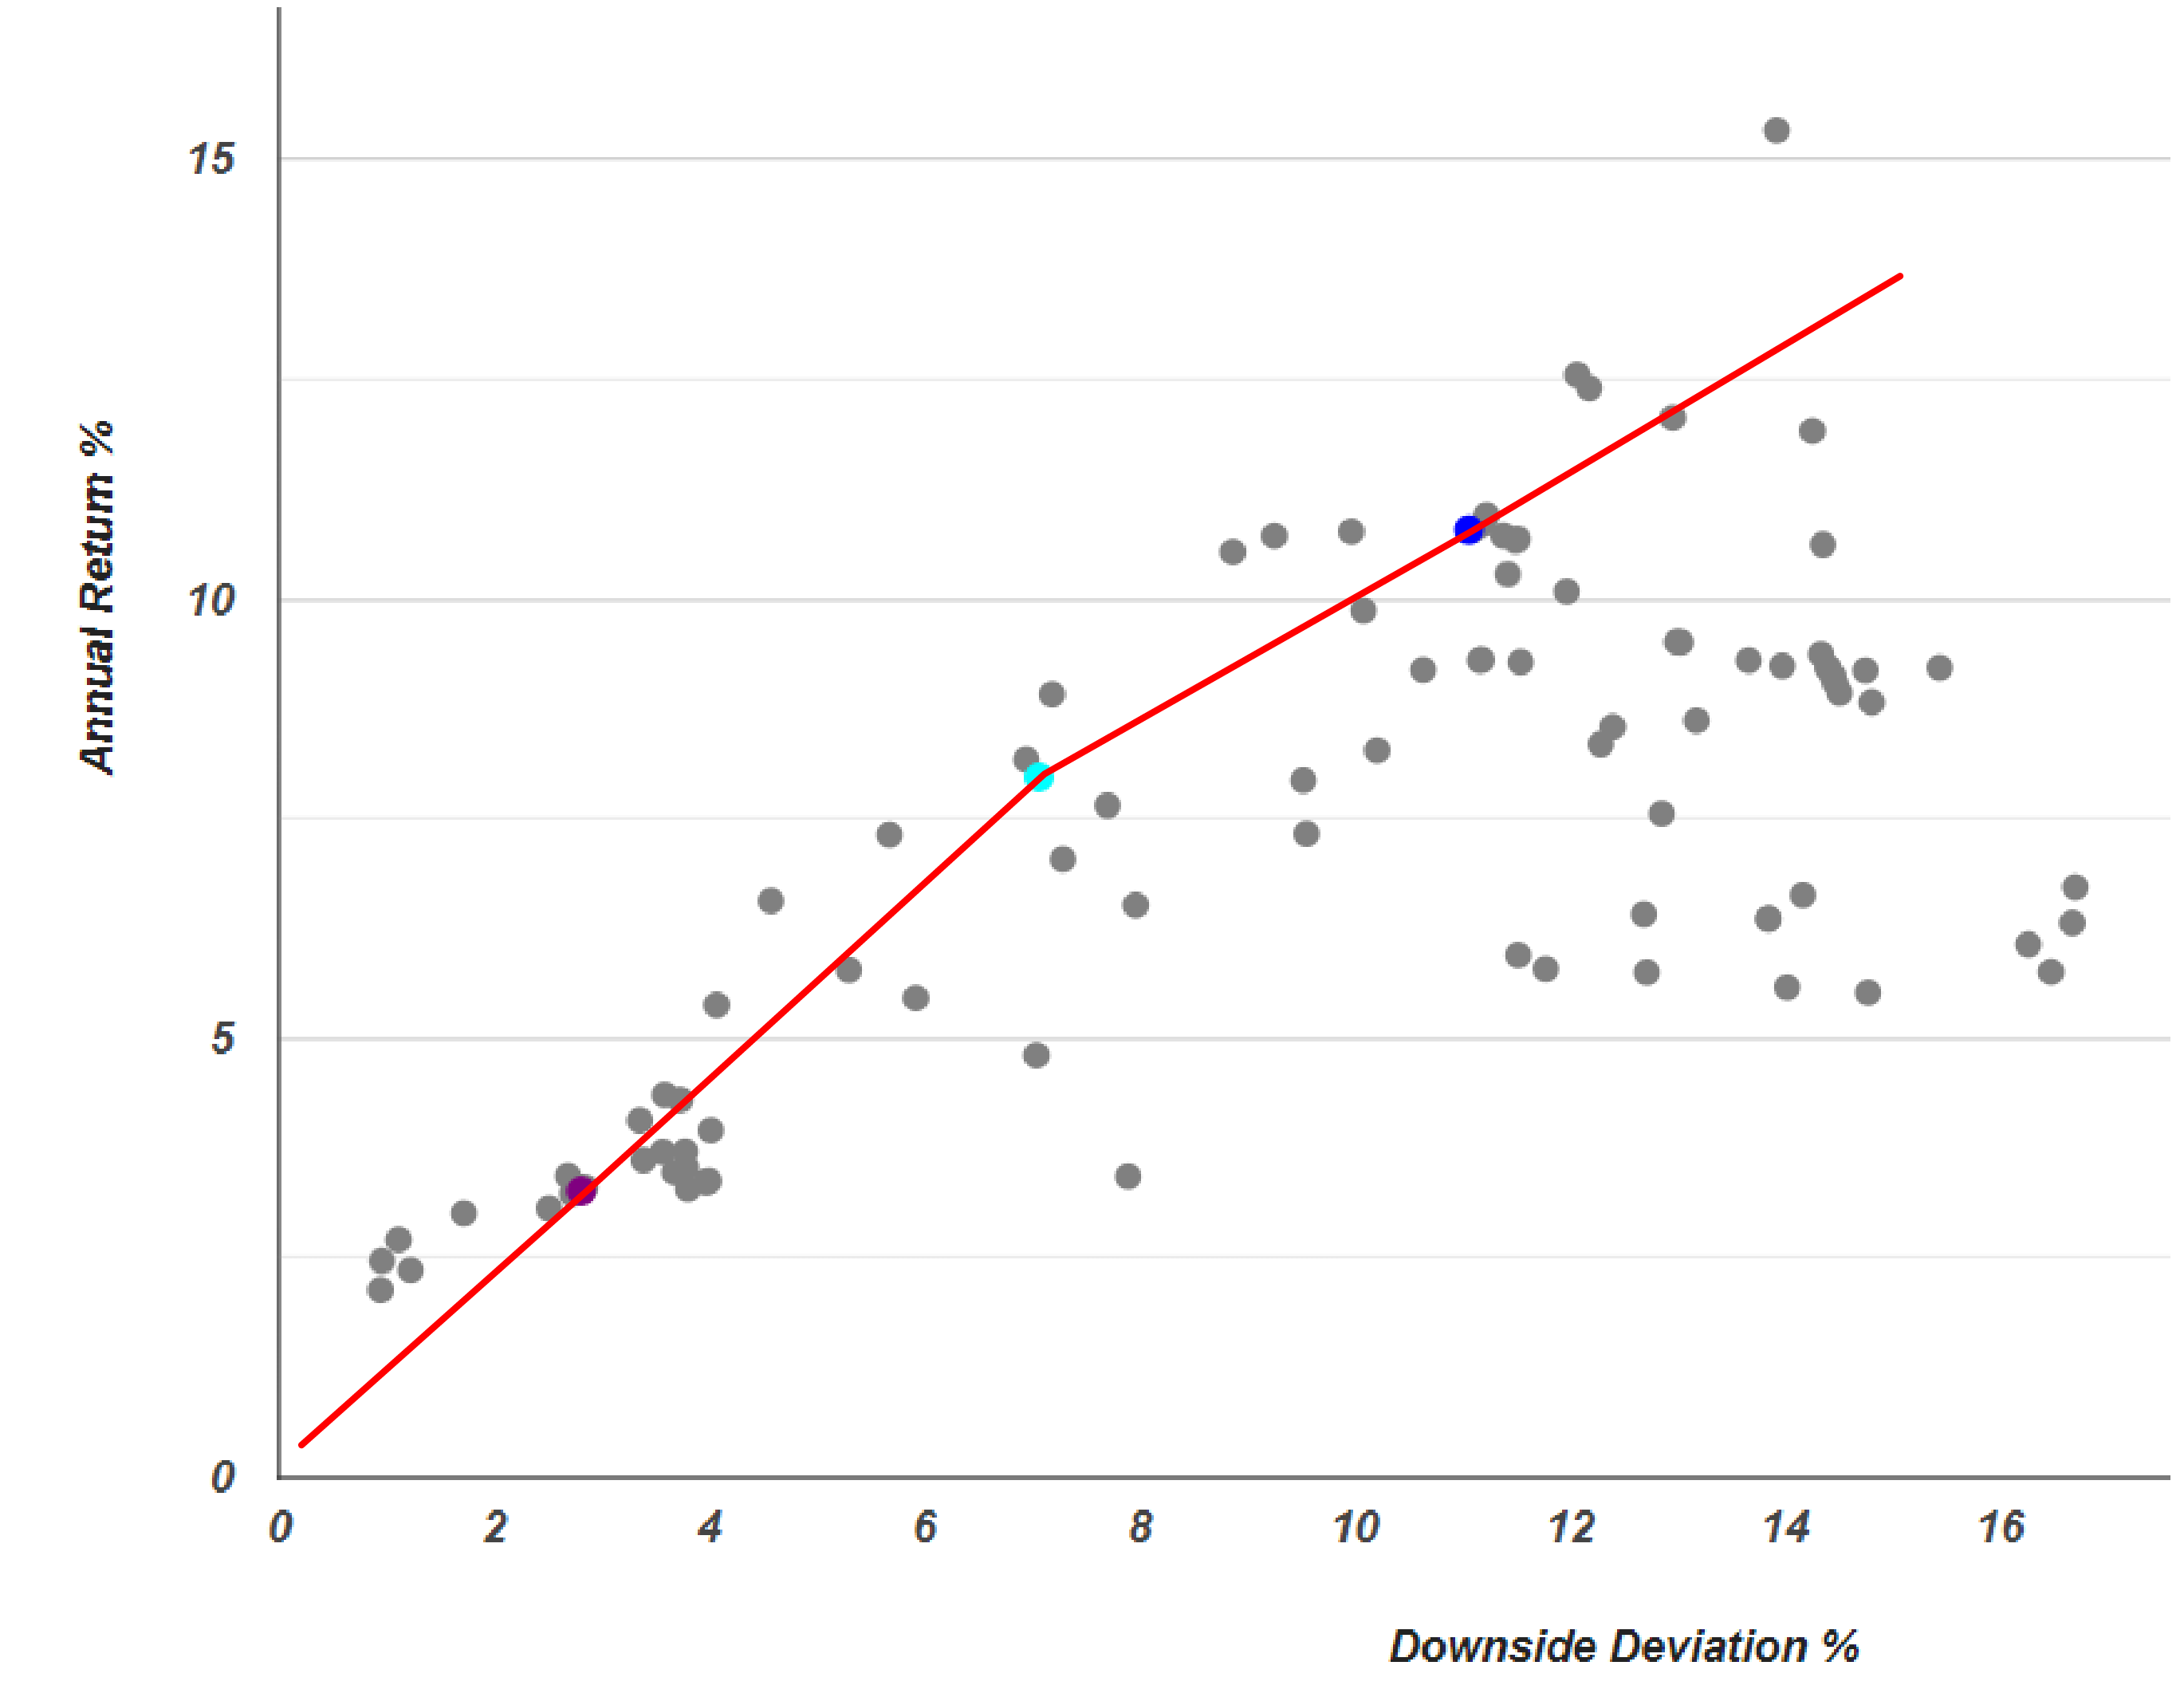
Returning to the scatter plot analysis based on downside deviation, several "high-flyers" emerge when evaluating funds through the lens of the Sortino ratio. The Sortino ratio represents the slope of the line from the risk-free rate of return to a specific benchmark. In a visual analysis, any fund positioned "northwest" or above and to the left of the benchmark line possesses a higher Sortino ratio than the S&P 500. While it is possible for a fund to achieve a superior ratio, it is important for an investor to distinguish between a better ratio and a "binary" win where a fund provides both lower risk and higher returns simultaneously.
The Top 12 Vanguard Performers
When ranking Vanguard’s extensive catalog by their 20-year Sortino ratios, the data reveals a selective group of top performers:
- The Benchmark: The S&P 500 maintains a Sortino ratio of 0.93.
- The Outperformers: Only 12 Vanguard funds have successfully beaten the S&P 500 on a Sortino ratio basis over the past 20 years.
- Notable Leaders: These high-performers include the Vanguard Wellesley Income Fund (VWINX) and the Vanguard Balanced Index Fund (VBIAX).
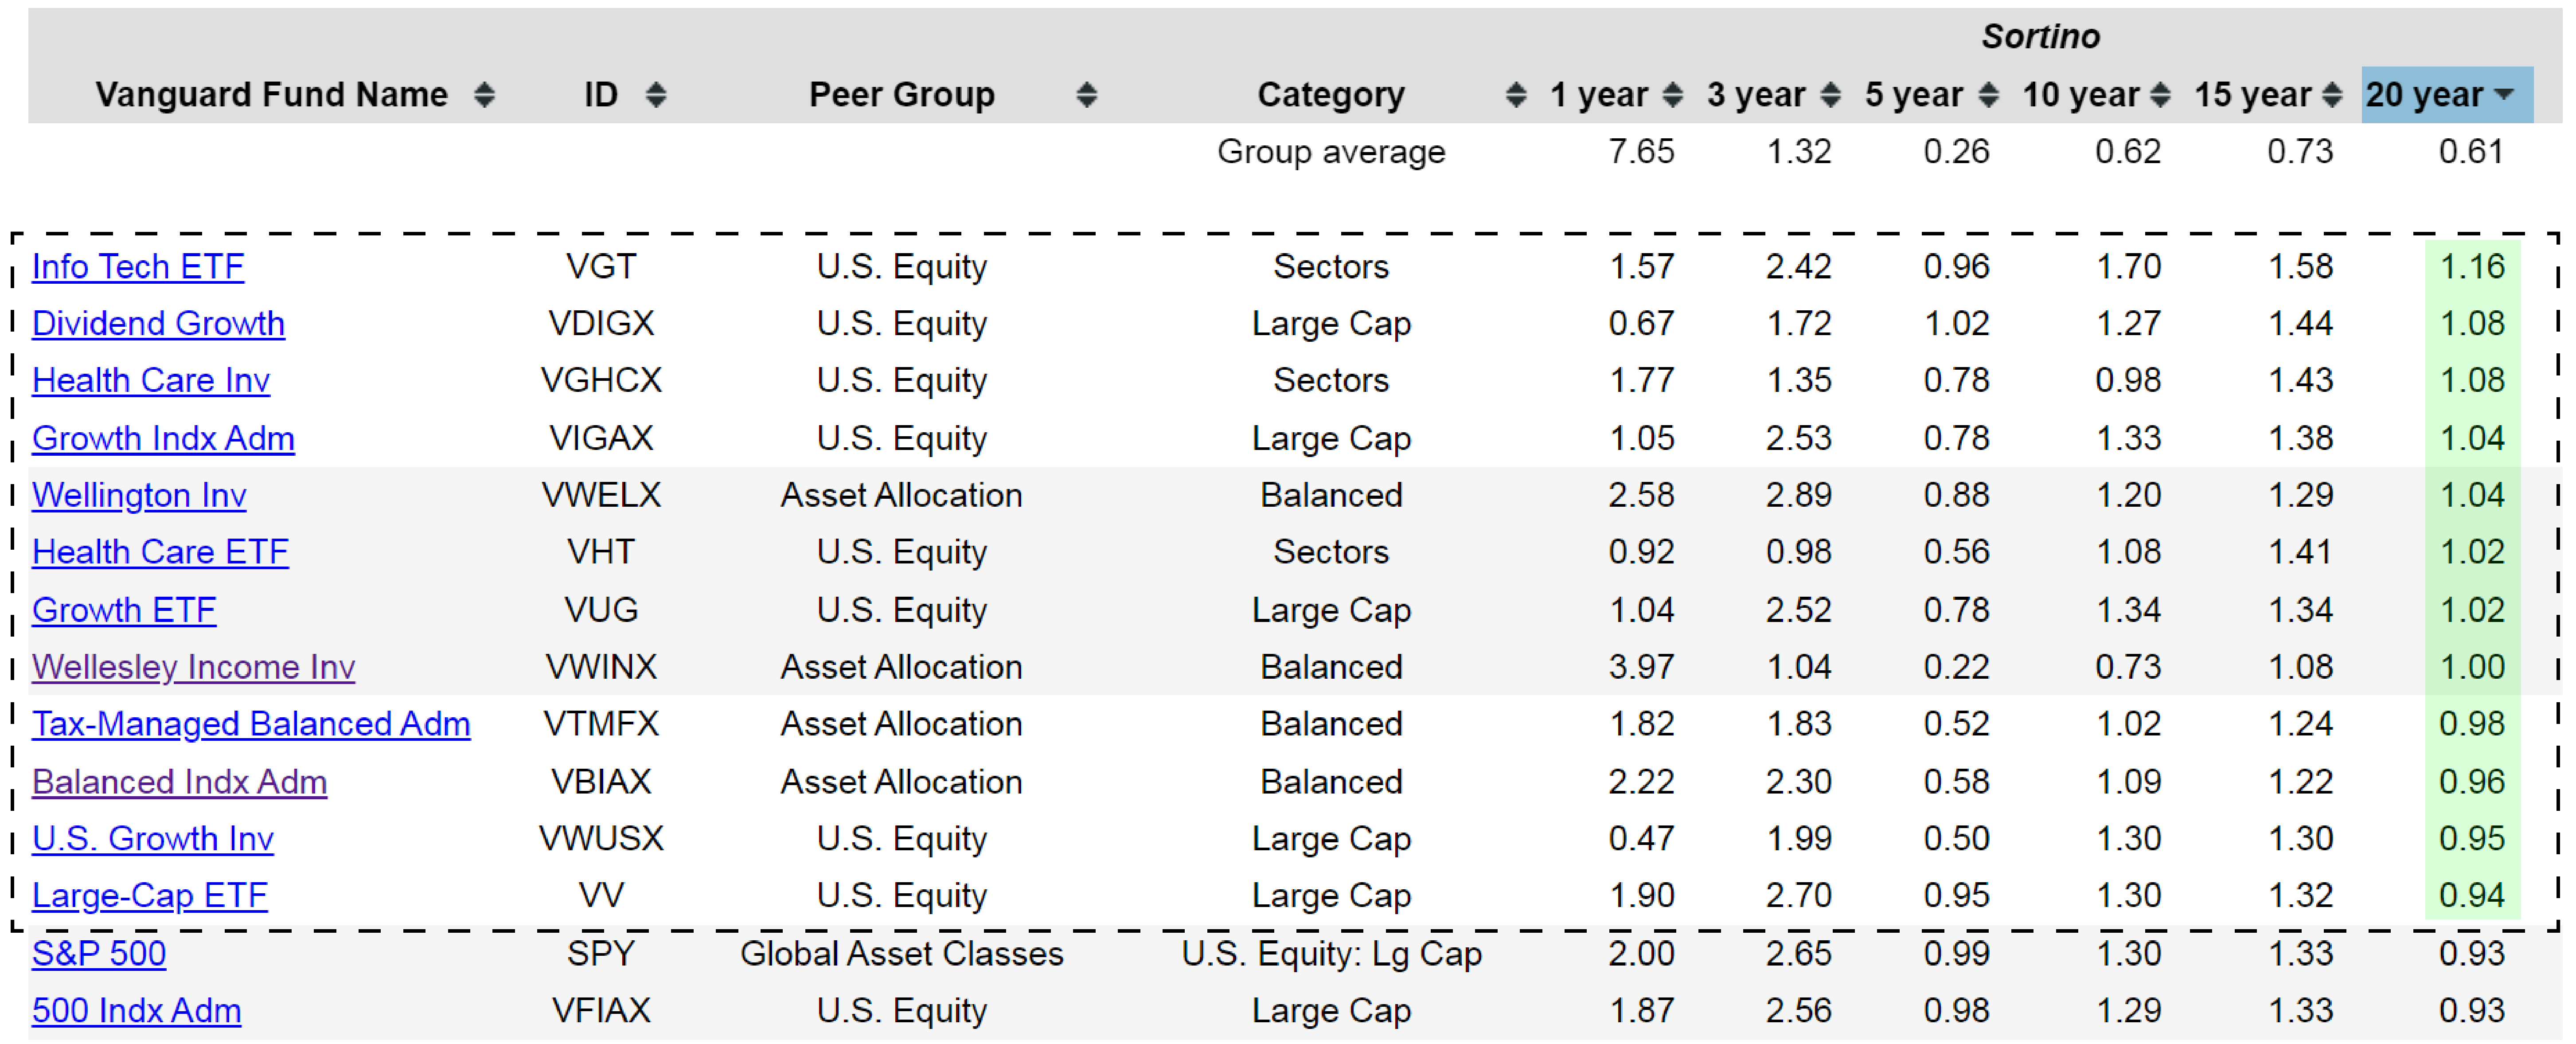
The Vanguard Balanced Index Fund (Admiral Shares), for instance, carries a Sortino ratio of 0.96. While these specific mutual funds and ETFs outperform the benchmark on a risk-adjusted ratio basis, they often fail to beat it on a strictly binary basis, delivering higher total returns while also maintaining lower absolute risk. This data provides significant insight for the long-term investor. While Vanguard is a clear industry leader in managing low-cost, efficient index funds, finding "alpha", returns that significantly exceed standard passive benchmarks, remains a challenge within their ecosystem. An investor may find that while Vanguard excels at market tracking, generating returns above and beyond passively managed funds often requires looking toward more tactical asset allocation strategies.
Shifting focus from specific fund families to "Portfolio Recipes" the asset allocation strategies tracked at RecipeInvesting.com reveals a broader range of investment opportunities. A 20-year performance analysis highlights several strategies that have successfully navigated market volatility while outperforming the S&P 500.
Strategic Outperformance: Maximum Drawdown & Downside Deviation
Performance via Maximum Drawdown
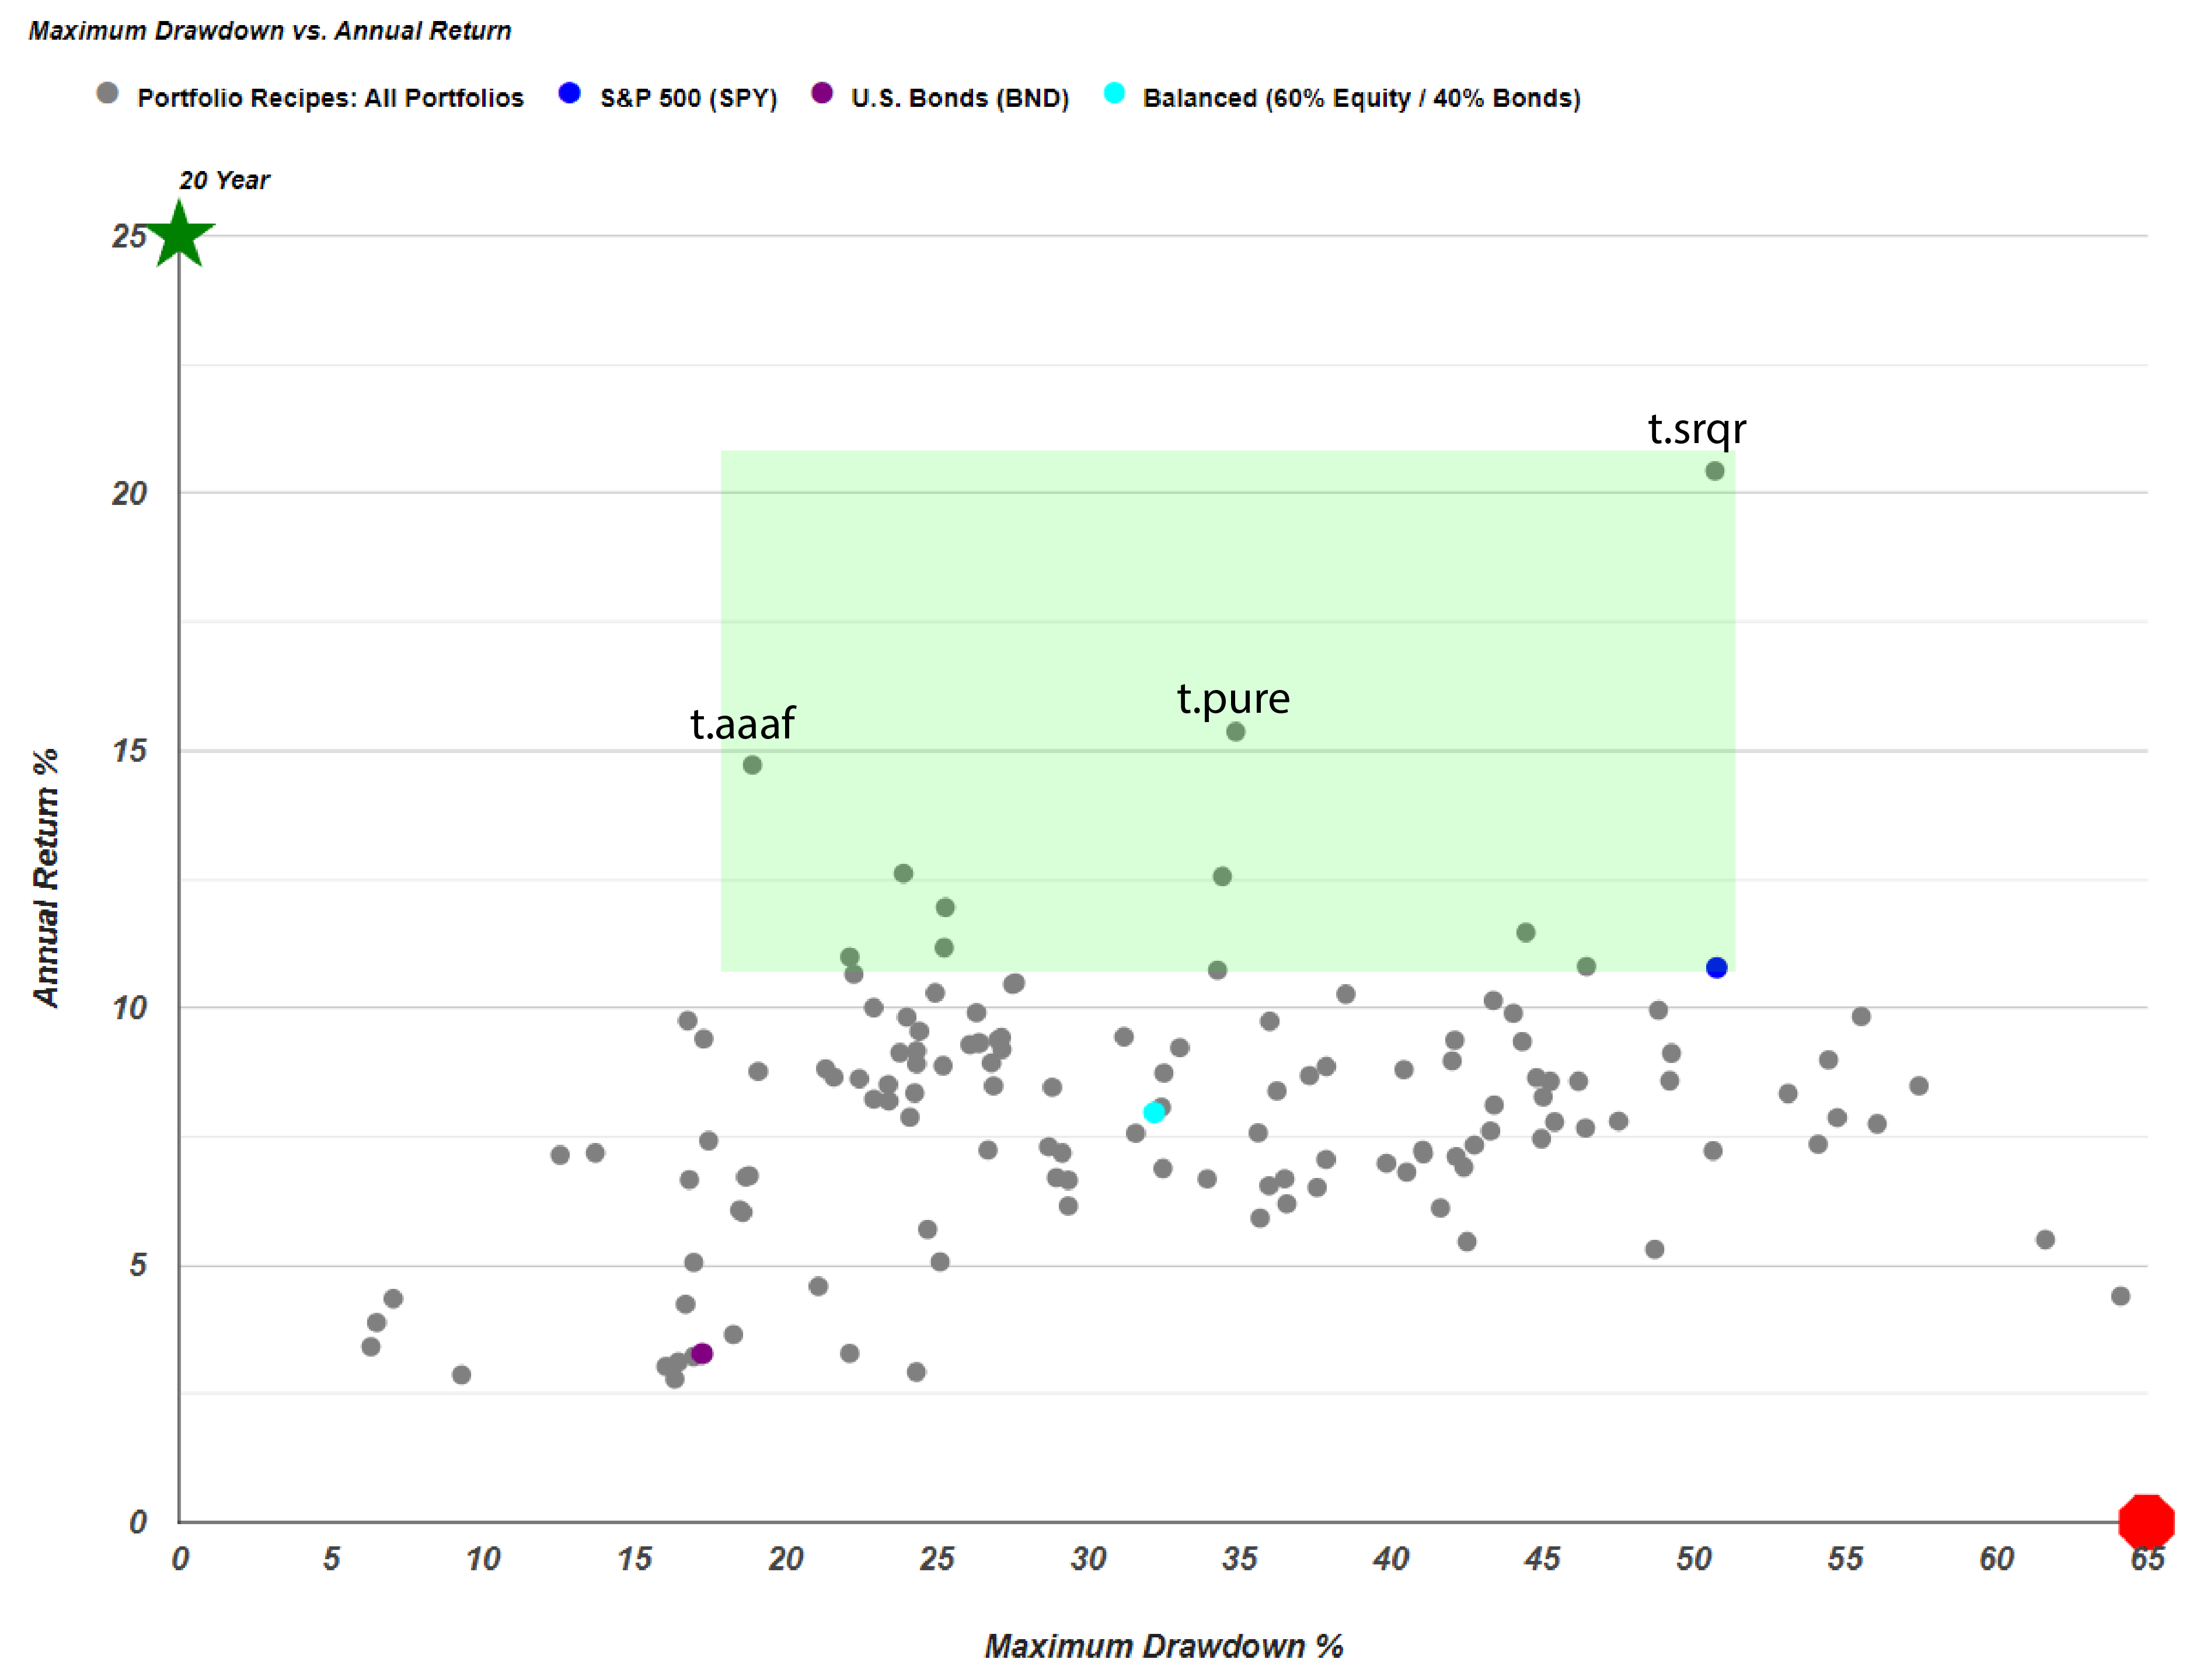
When evaluating risk through the lens of Maximum Drawdown (the largest peak-to-trough decline), a group of approximately ten portfolios emerges as superior to the S&P 500 benchmark.
- Adaptive Allocation F (t.aaaf): This portfolio has performed exceptionally well, maintaining a drawdown of approximately 18% while delivering returns significantly higher than the S&P 500.
- Pure Momentum (t.pure): This portfolio also demonstrates a stronger risk-return profile than the broader market over the long term.
Performance via Downside Deviation
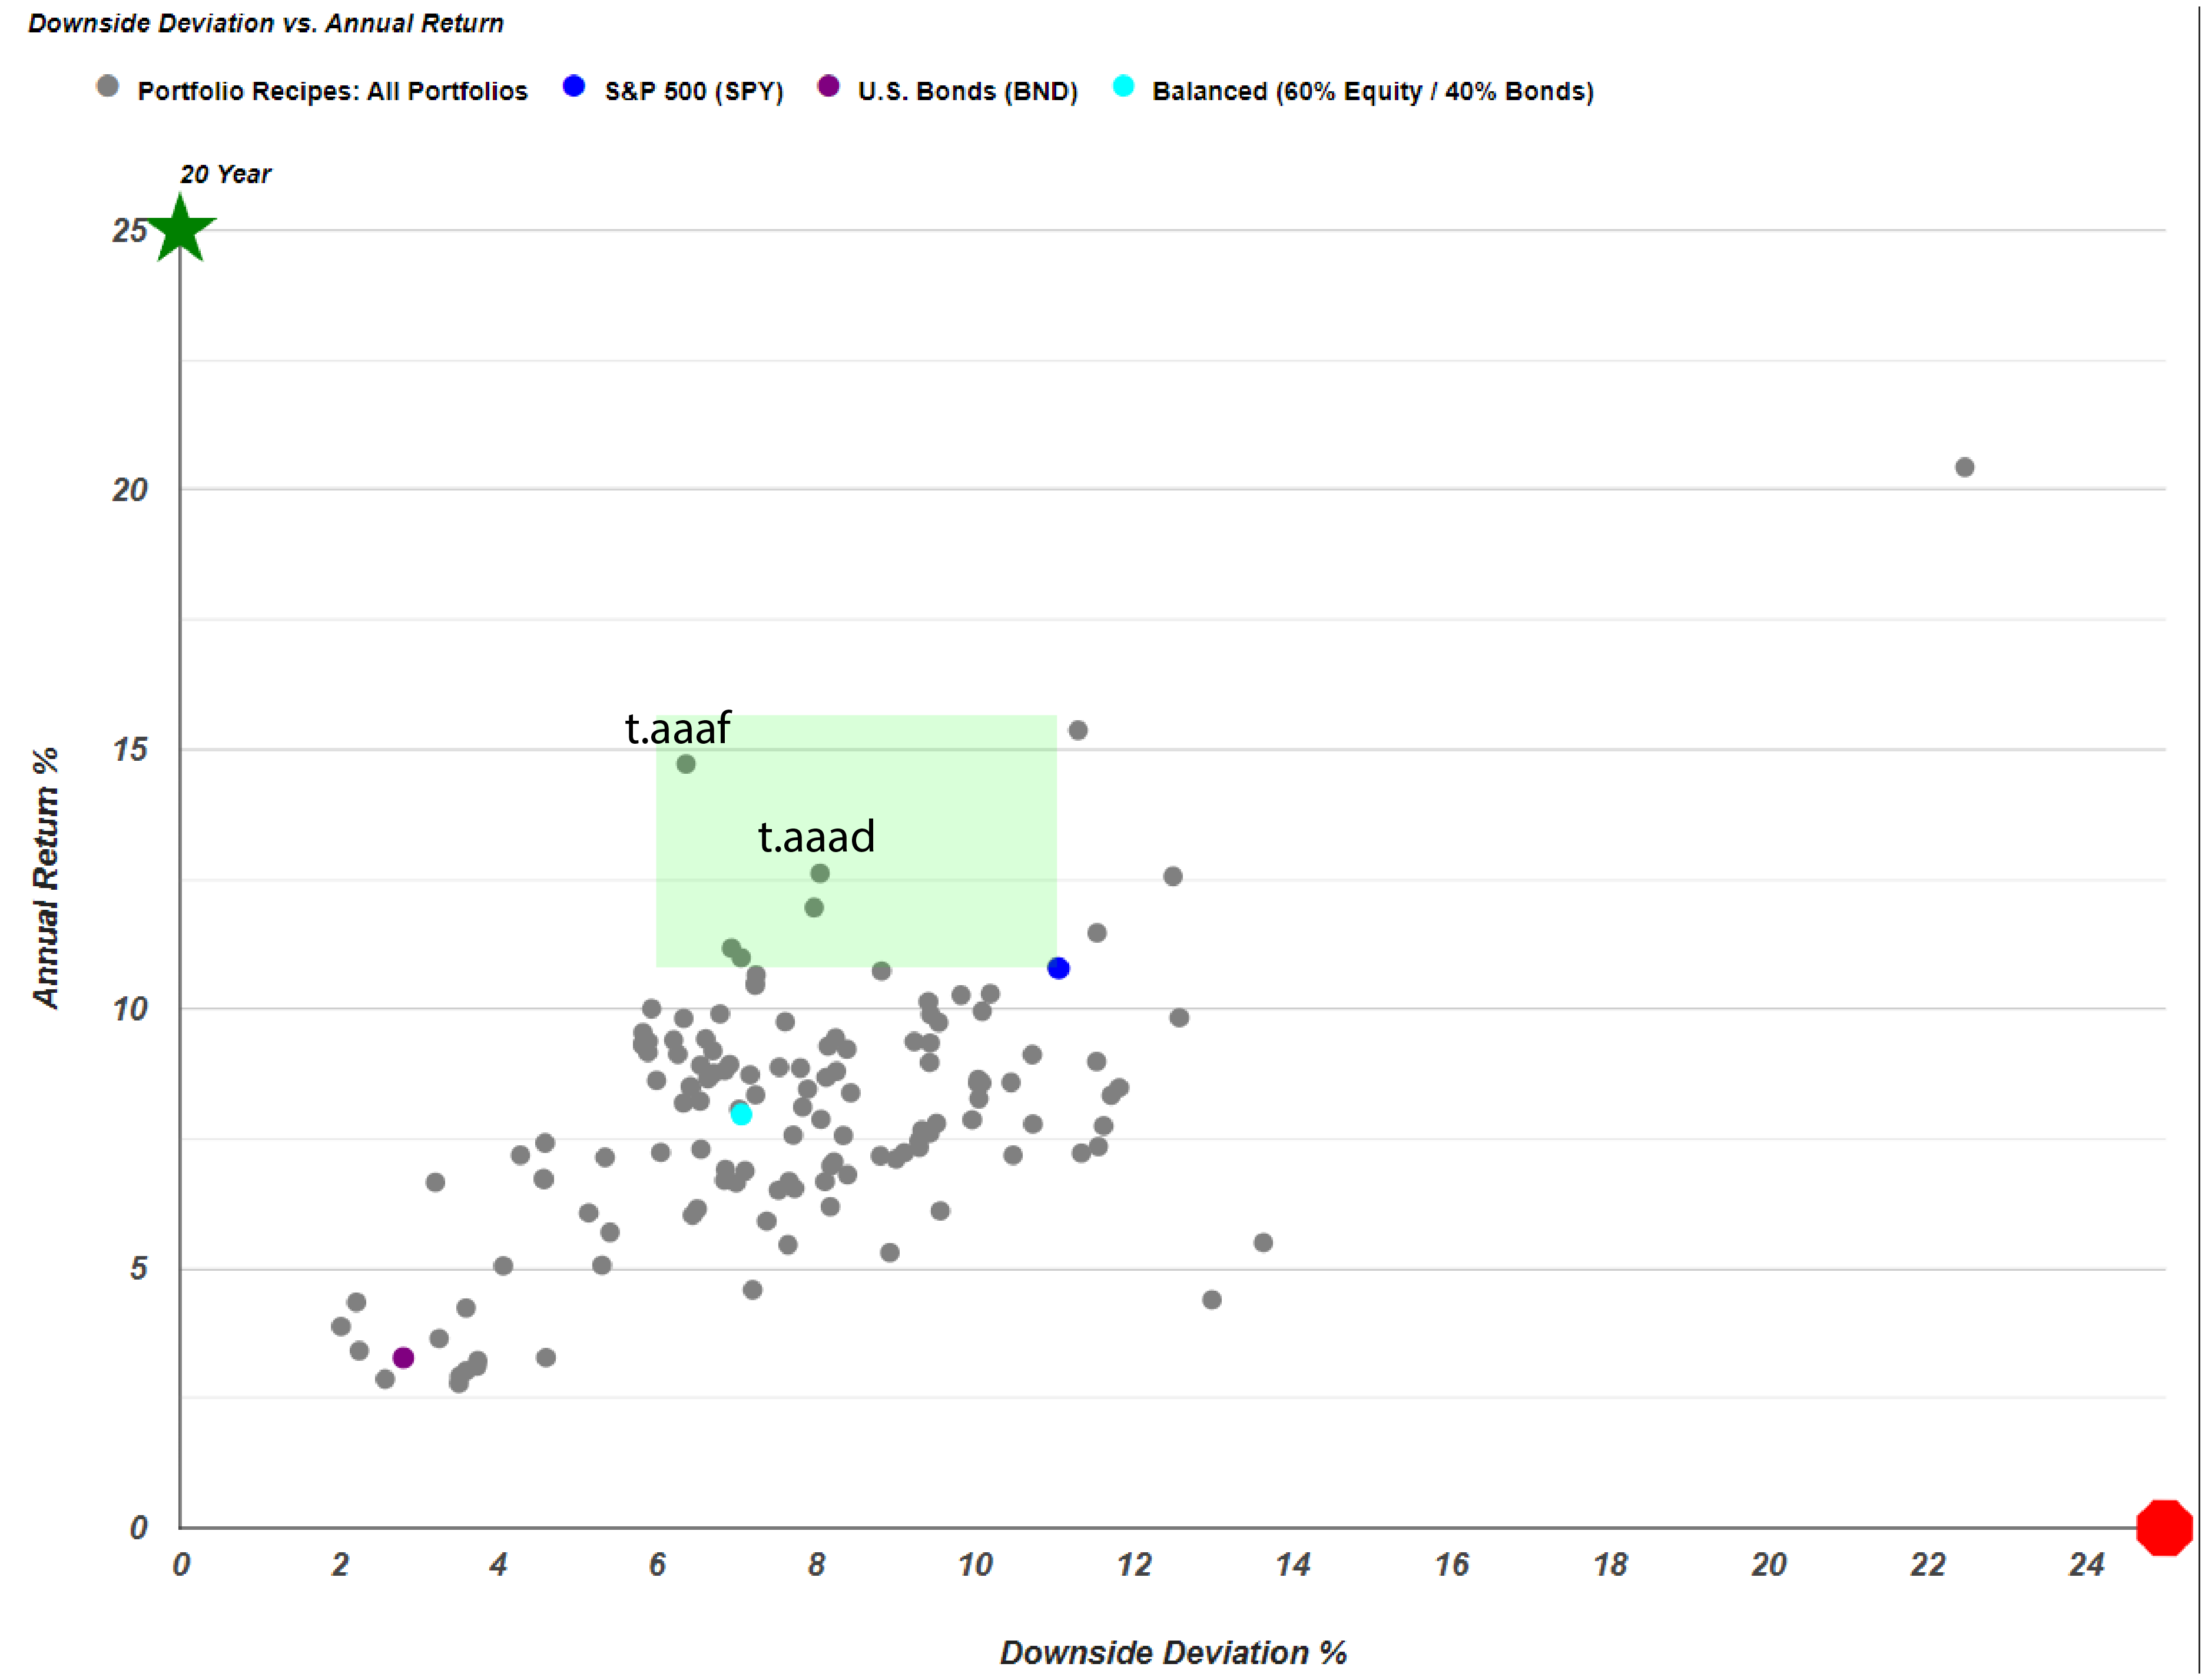
To maintain a consistent "apples-to-apples" comparison with previous analyses, an investor can evaluate these same portfolio recipes using downside deviation. This metric allows for a clearer view of risk-adjusted returns by focusing only on negative price swings.
While the S&P 500 serves as a formidable benchmark, several portfolios consistently reside in the preferred "upper-left" region of the performance chart:
- Quartile Sector Rotation (t.srqr): This is a standout performer, though it should be viewed as an outlier. Its success stems from a highly concentrated approach, investing in only one specific sector fund at any given time.
- Consistent Risk-Adjusted Leaders: For the investor seeking more diversified outperformance, several other recipes surpass the S&P 500 on a risk-adjusted basis such as t.aaaf, t.aaad, t.aaae, and BPLSX.
These results demonstrate that while traditional index funds offer stability, specialized asset allocation strategies can provide the "alpha" that many long-term investors seek.
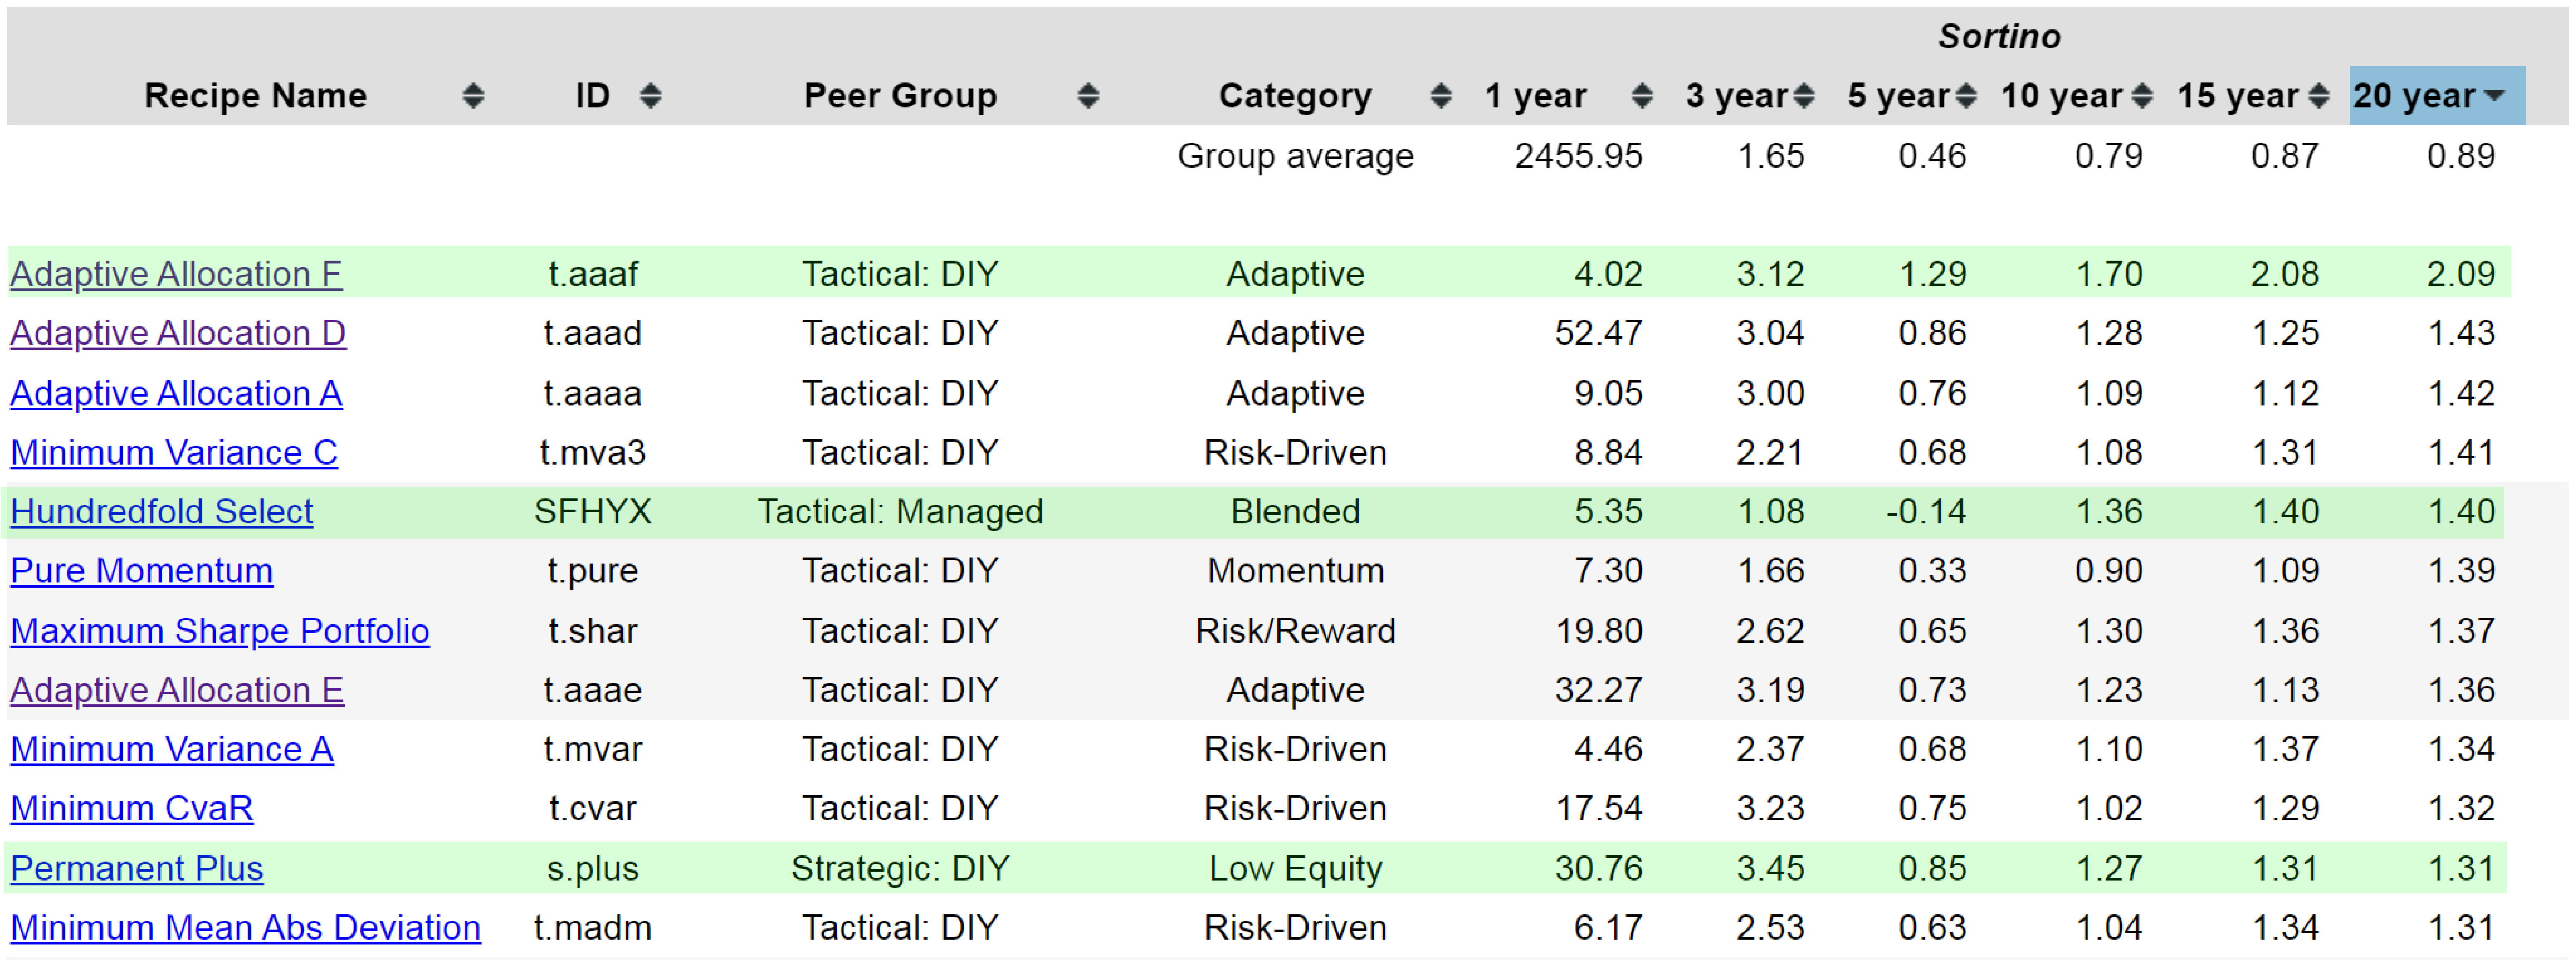
Evaluating the collection of portfolio recipes by Sortino ratio reveals a significant number of options that outperform the Vanguard catalog. This specific ratio is a measure substantially similar to the risk-return scatter plot. While the S&P 500, represented by the SPY exchange-traded fund, maintains a Sortino ratio of 0.93, dozens of alternative strategies exceed this benchmark.
Several standout portfolios illustrate the potential for higher risk-adjusted returns over a 20-year horizon:
- Adaptive Allocation F (t.aaaf): This strategy leads the rankings with a Sortino ratio of 2.09.
- Hundredfold Select (SFHYX): A mutual fund that has demonstrated strong historical performance.
- Permanent Plus (s.plus): A static, three-fund portfolio that is relatively straightforward to implement while maintaining a 20-year Sortino ratio of 1.31.
Conclusion
Vanguard remains a solid choice for most investors, offering low-cost, diversified, and accessible funds. However, it is important for an investor to recognize that these funds do not necessarily represent the performance ceiling.
Through careful analysis and comparison of specialized portfolio recipes, an investor can identify both static (s.) and tactical (t.) strategies. Tactical recipes, which can be updated on a monthly or quarterly basis, often provide significantly better returns than standard Vanguard funds. While Vanguard excels at market tracking, its offerings often struggle to break through the "risk-return frontier" that these more specialized asset allocation strategies successfully navigate. By looking beyond traditional index funds, an investor can uncover pathways toward superior long-term performance and more efficient risk management.