
2026 The Talmud Portfolio Strategy: History, Structure, and 20-Year Performance Analysis
The Talmud Portfolio Strategy: History, Structure, and 20-Year Performance Analysis
February 2026
Topics this month
- The historical and philosophical foundations of the Talmud portfolio allocation strategy
- Key structural differences among the five Talmud-based investment portfolios
- Long-term performance analysis and historical return data of the Talmud portfolios
- Performance comparison between Talmud portfolios and other diversified portfolios
The focus for this month’s commentary is the Talmud Portfolios category. Within this category, there are five distinct Talmud-based portfolios. Although they share a common conceptual foundation, each portfolio is structured somewhat differently. This commentary will explore the origins of these portfolios, evaluate their performance over time, and assess how they stack up against other strategies available on the platform.
History of Talmud Portfolio
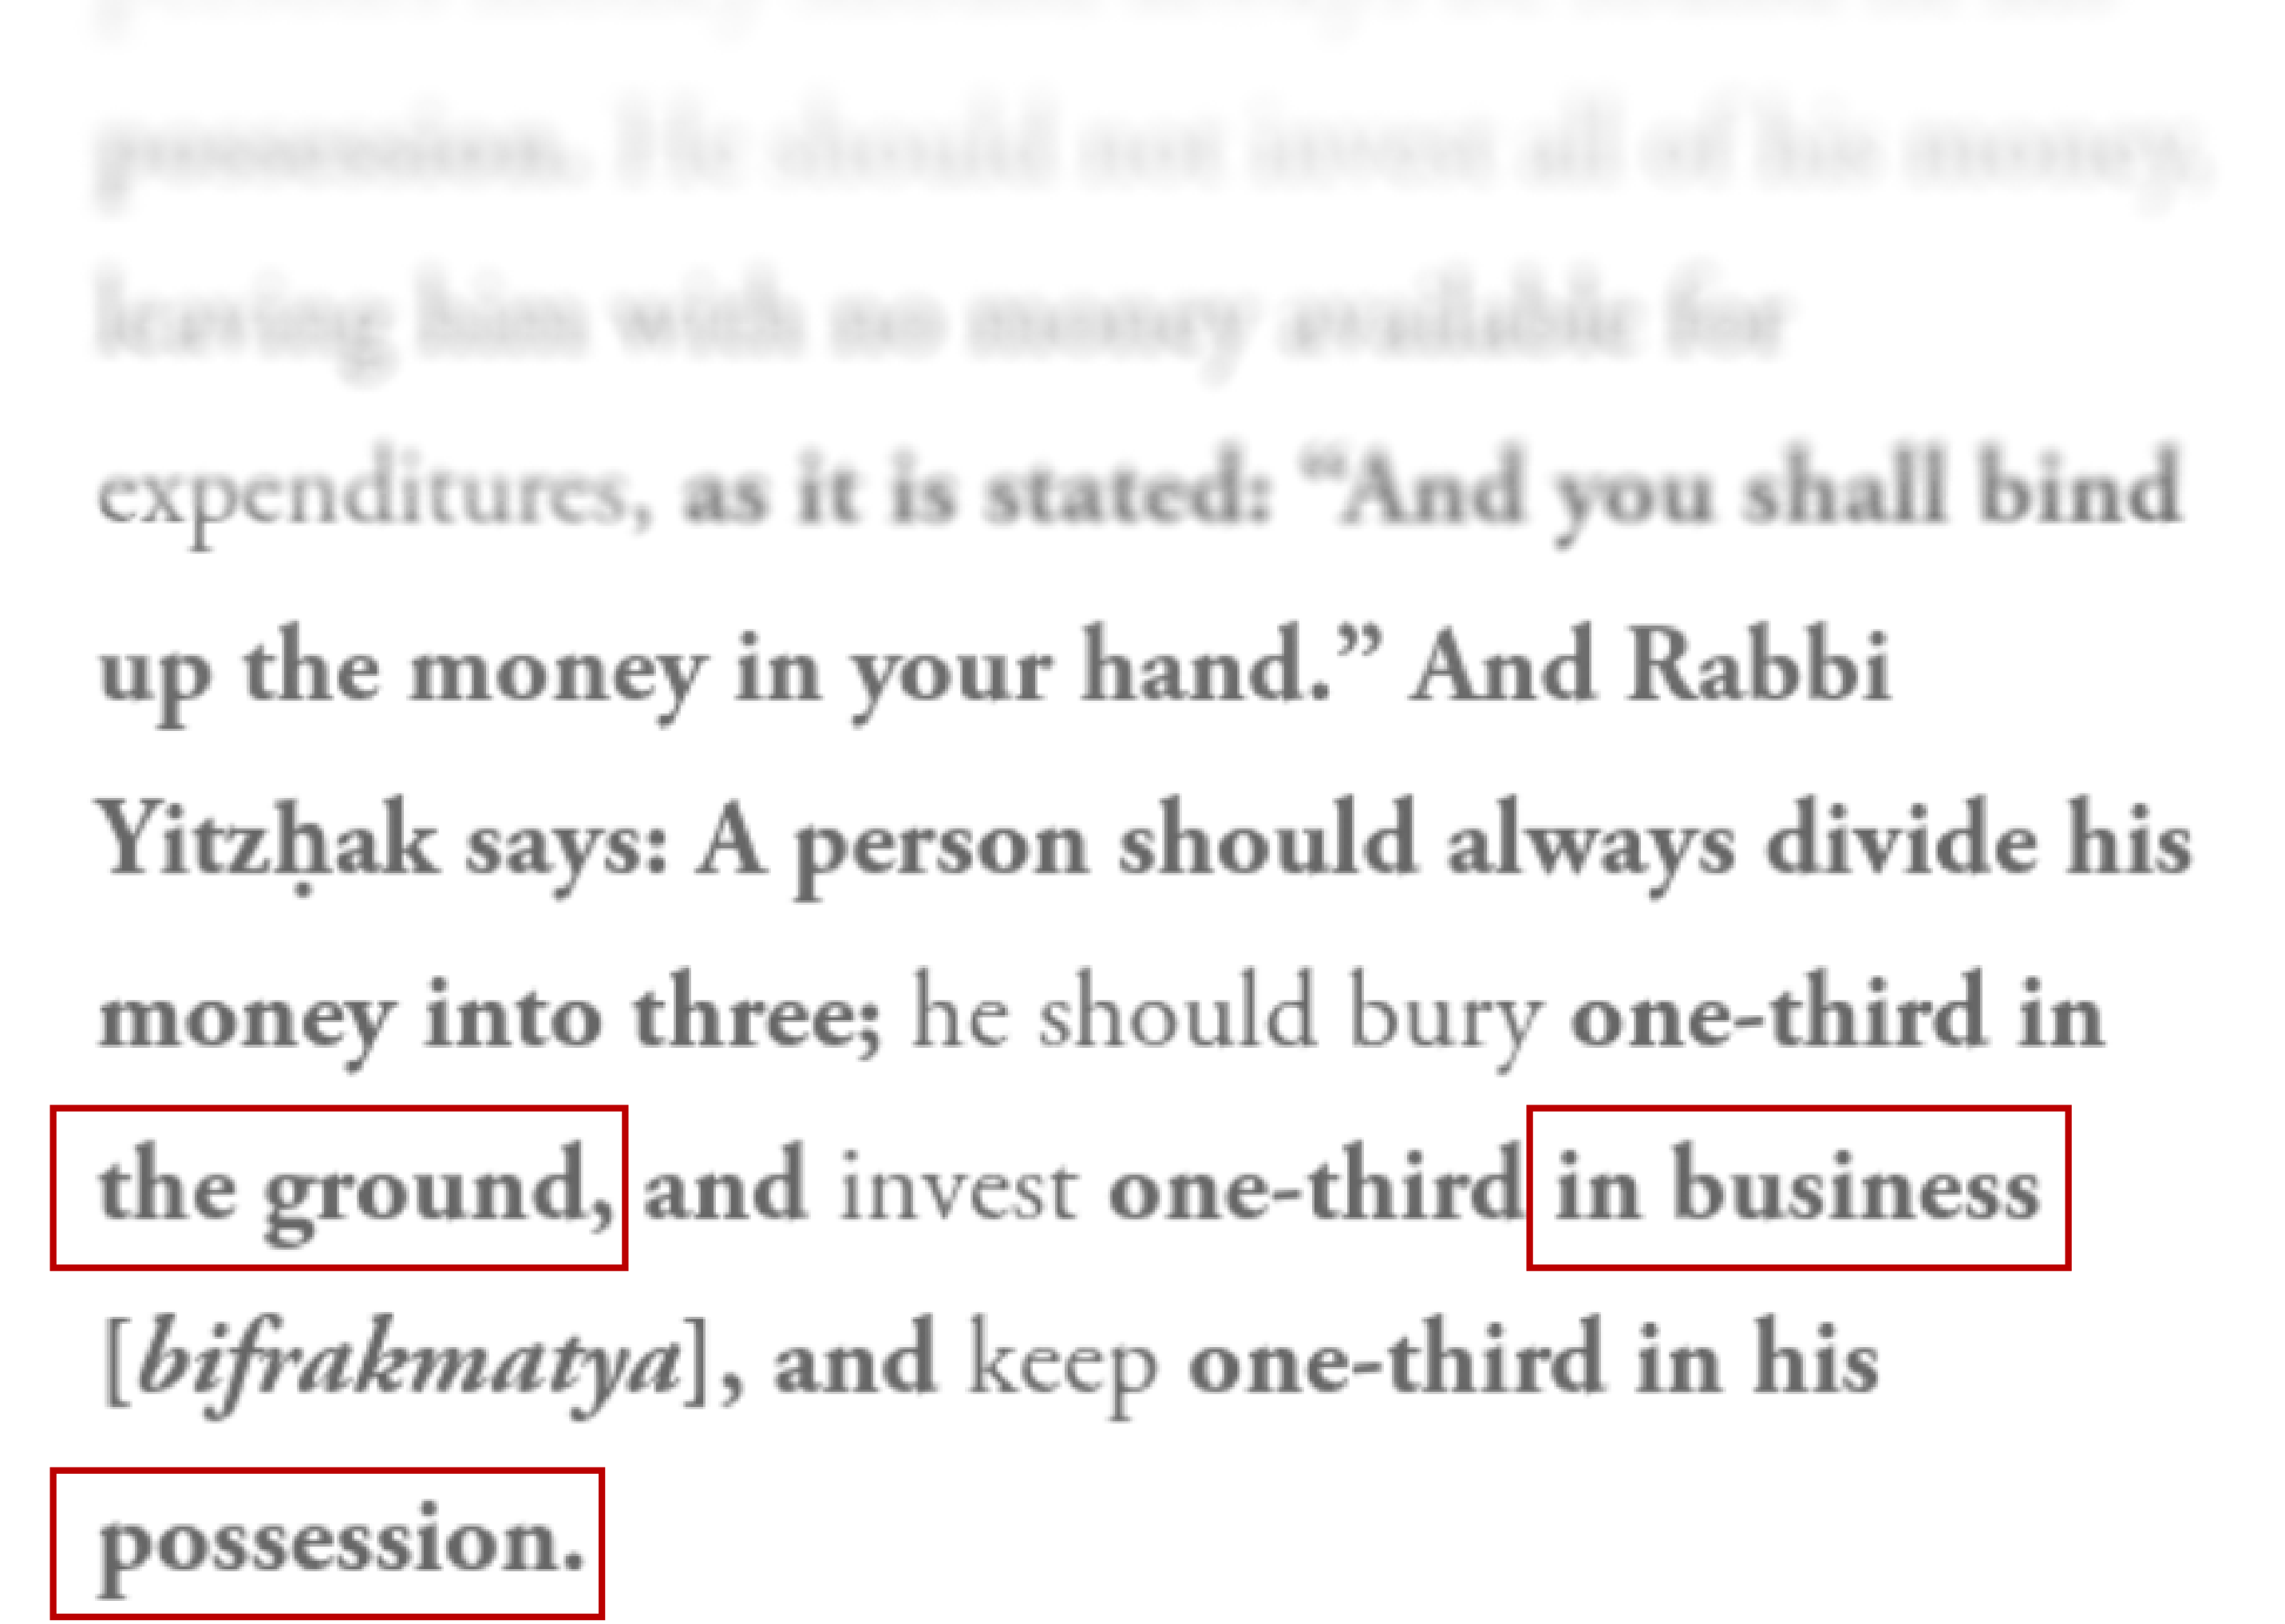
To set the stage, it is helpful to go back nearly two millennia. Around 200 AD, a rabbinic teaching was recorded in the Talmud, specifically in Bava Metzia 42a, section three. In this passage, the rabbi recommends that a person should always divide his wealth into three parts: one-third in the ground, one-third in business, and one-third kept in his possession.
This can be viewed as an early example of a static asset allocation model, a simple but structured framework for dividing wealth into three distinct categories. At first glance, the instruction raises questions.
- Does “one-third in the ground” literally mean burying money?
- Does “one-third in his possession” mean keeping it at home?
- And does “one-third in business” refer strictly to operating a personal enterprise?
To apply this framework to modern investing, it becomes necessary to interpret the original language more carefully and consider how these categories might translate into today’s financial markets. The goal is to determine whether this ancient allocation model can be adapted into a modern portfolio and tested over the past 15 to 20 years. A closer look at the original Hebrew text, assisted by translation tools, provides helpful insight. The passage, which reads from right to left, clearly emphasizes dividing wealth into three equal portions. The key question is how to understand those three categories. The three terms have been interpreted in several ways:
- “In the ground”
While this phrase can mean burying something, it can also refer to land. Many interpret this as an allocation to land ownership — in modern terms, real estate. - “In business” or “in practical pursuits”
This suggests engagement in commerce, trade, or productive enterprise. In a contemporary context, this could represent business ownership or, more broadly, equity investments in the stock market. - “In his hand” or “under his hand”
This likely refers to readily available funds — money kept accessible for immediate needs. In modern financial terms, this would correspond to cash or liquid reserves.
An additional layer of interpretation comes from a German translation of the same passage, which renders the middle category as “goods” or “inventory.” This reinforces the idea that the second third represents productive assets tied to commerce or business activity. Taken together, a reasonable modern translation of this ancient allocation model could be:
- One-third in real estate (land)
- One-third in business or equities
- One-third in cash or liquid reserves
If this interpretation is correct, the rabbinic guidance in Bava Metzia 42a presents a remarkably balanced three-asset portfolio, one rooted in tangible property, productive enterprise, and liquidity. The next step is to evaluate how such an allocation would perform in modern markets and how it compares to other diversified portfolio strategies.
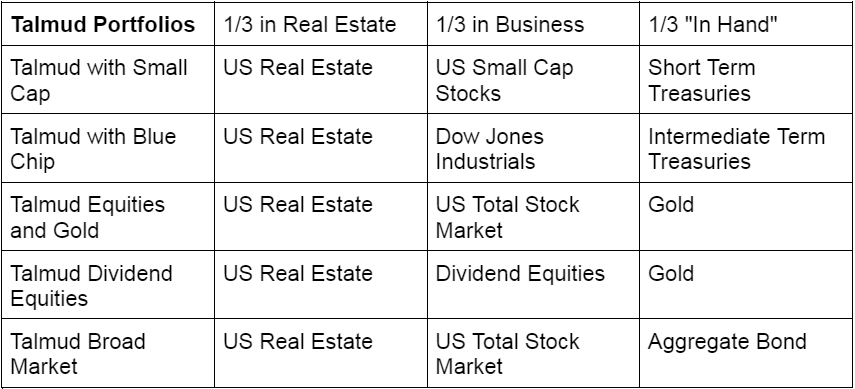
To translate this ancient framework into a modern investment strategy, each category must be clearly defined. The term “business” can be broadly understood as productive enterprise. In today’s markets, this most naturally corresponds to equities. However, equities themselves can be defined in several ways. Similarly, “in hand” suggests readily accessible funds, short-term, liquid assets available for stability or immediate needs. Based on this interpretation, five different variations of the Talmud portfolio were constructed using exchange-traded funds (ETFs).
Real Estate (One-Third in Land)
For the “land” allocation:
- A broad-based U.S. real estate ETF was selected.
- Although an international real estate fund could have been included, one U.S. real estate fund was chosen for consistency.
- This real estate component remains constant across all five portfolio variations.
Business (One-Third in Equities)
The “business” allocation was interpreted in multiple ways, resulting in different equity exposures. Each option reflects a different understanding of what constitutes productive business investment.
- Blue-chip stocks, such as those represented by the Dow Jones Industrial Average
- U.S. small-cap stocks
- The total U.S. stock market
- Dividend-focused equities
In Hand (One-Third in Reserves)
The “in hand” portion was also interpreted through several modern equivalents:
- Short-term U.S. Treasuries
- Intermediate-term U.S. Treasuries
- Gold
- A broad aggregate bond fund
While not every possible combination was tested, five representative variations were selected to evaluate how the framework performs under different assumptions. Each portfolio maintains the same core structure, one-third real estate, one-third equities, and one-third reserves. These allocations were then implemented as static, backtested asset allocation models based on a specific translation of the Talmudic text and a practical interpretation of how that guidance applies in modern financial markets.
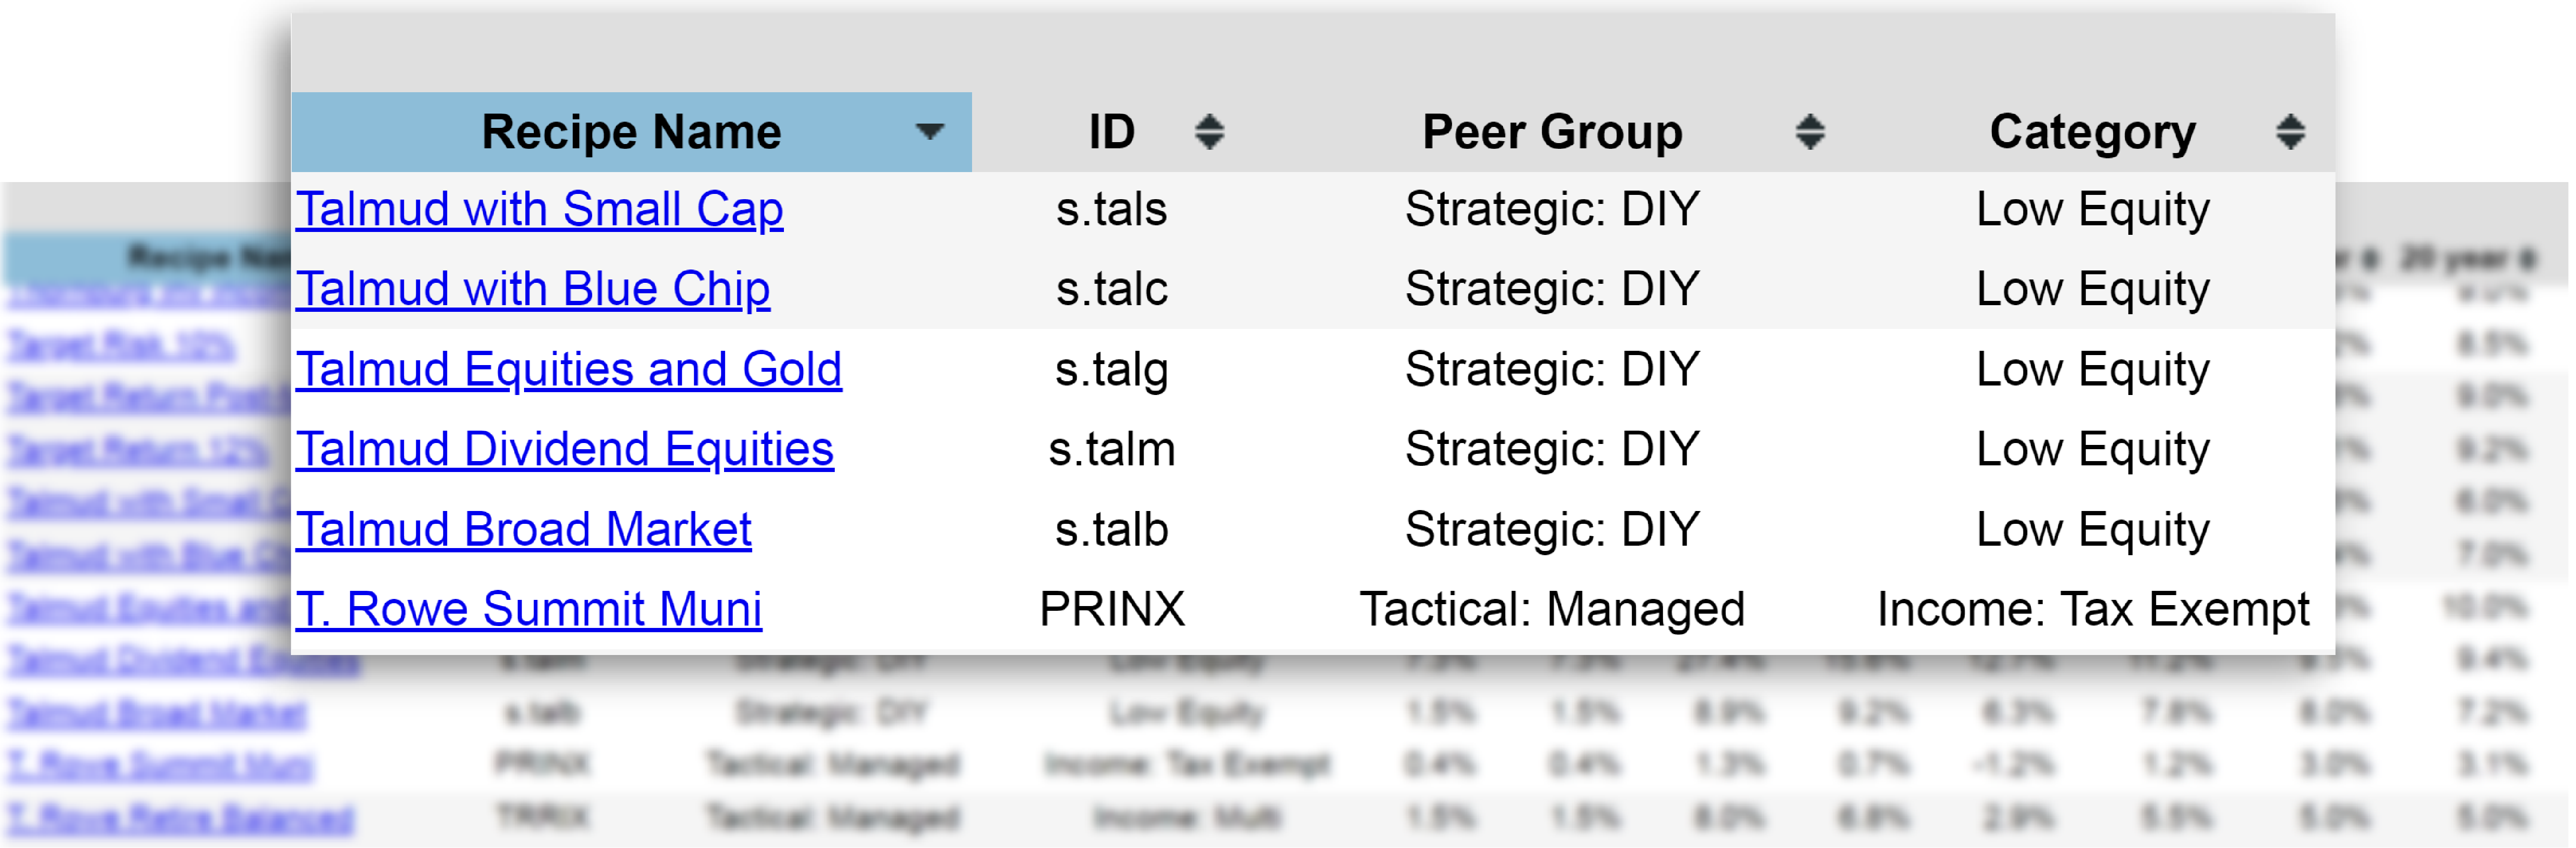
Returning to the full portfolio summary, the list has been sorted in reverse alphabetical order. Within this view, five Talmud portfolios are displayed. All five are classified as low equity portfolios because each allocates no more than one-third to equities. They are also labeled “Strategic: DIY.” These portfolios are highly implementable because they invest in just three exchange-traded funds, maintain a consistent one-third, one-third, one-third allocation, and avoid tactical shifts or changes in fund selection, making them simple, transparent, and easy for an investor to manage. This designation carries two important characteristics:
- Strategic (Static):
The allocations do not change from month to month. While the portfolios are rebalanced monthly, the target weights remain fixed. - DIY (Do It Yourself):
An investor may choose to rebalance monthly, quarterly, or at another preferred interval. The structure is simple and flexible enough to allow for personal implementation.
Performance Overview
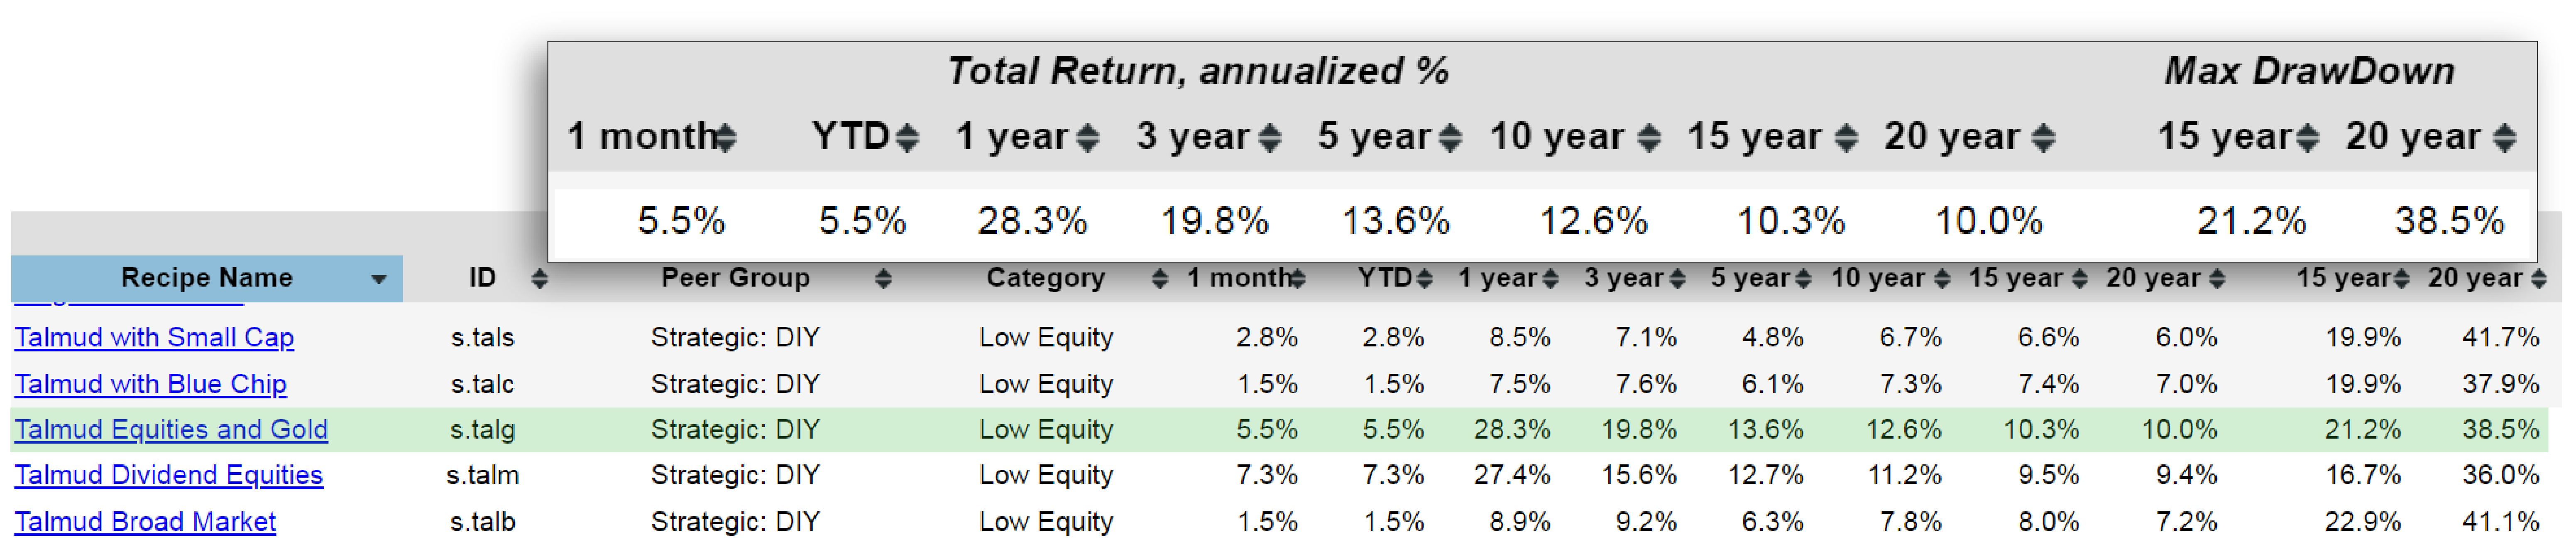
Examining the long-term results reveals some notable differences. One variation stands out with:
- A 10% annualized return over the past 20 years, which is a strong long-term result
- A maximum drawdown of 38.5% during that same period
While a 38.5% drawdown is significant, it is worth noting that the S&P 500, as represented by S&P 500 ETF Trust (SPY), experienced a drawdown of approximately 50% over that timeframe. In relative terms, the Talmud variation demonstrated somewhat lower downside exposure.
More recently, performance has been particularly strong:
- Nearly 20% annualized over the past three years
- Very solid returns over the most recent year
This outperformance is largely attributable to the “in hand” allocation being invested in gold. Gold has experienced a strong upward trend in recent years, which has materially boosted returns for the variations that include it.
Across the five portfolios, annualized returns vary meaningfully depending on the specific construction. The primary driver of this variation is how the “business” and “in hand” components were defined. Notably, portfolios that allocated the reserve portion to gold have surged ahead over the past three years, and that recent strength has also influenced the trailing 10-year return figures. These differences demonstrate that even within a simple one-third allocation framework, asset selection can significantly impact both long-term returns and shorter-term performance patterns.
Among the five variations, Talmud Equities and Gold (s.talg) stands out based on the summary table results. This portfolio warrants a closer examination, particularly in terms of risk versus return. Before turning to the risk metrics, it is helpful to review the long-term performance trend which shows cumulative growth over time. The “s.” designation indicates that this is a strategic (static) portfolio, meaning the allocation remains fixed.
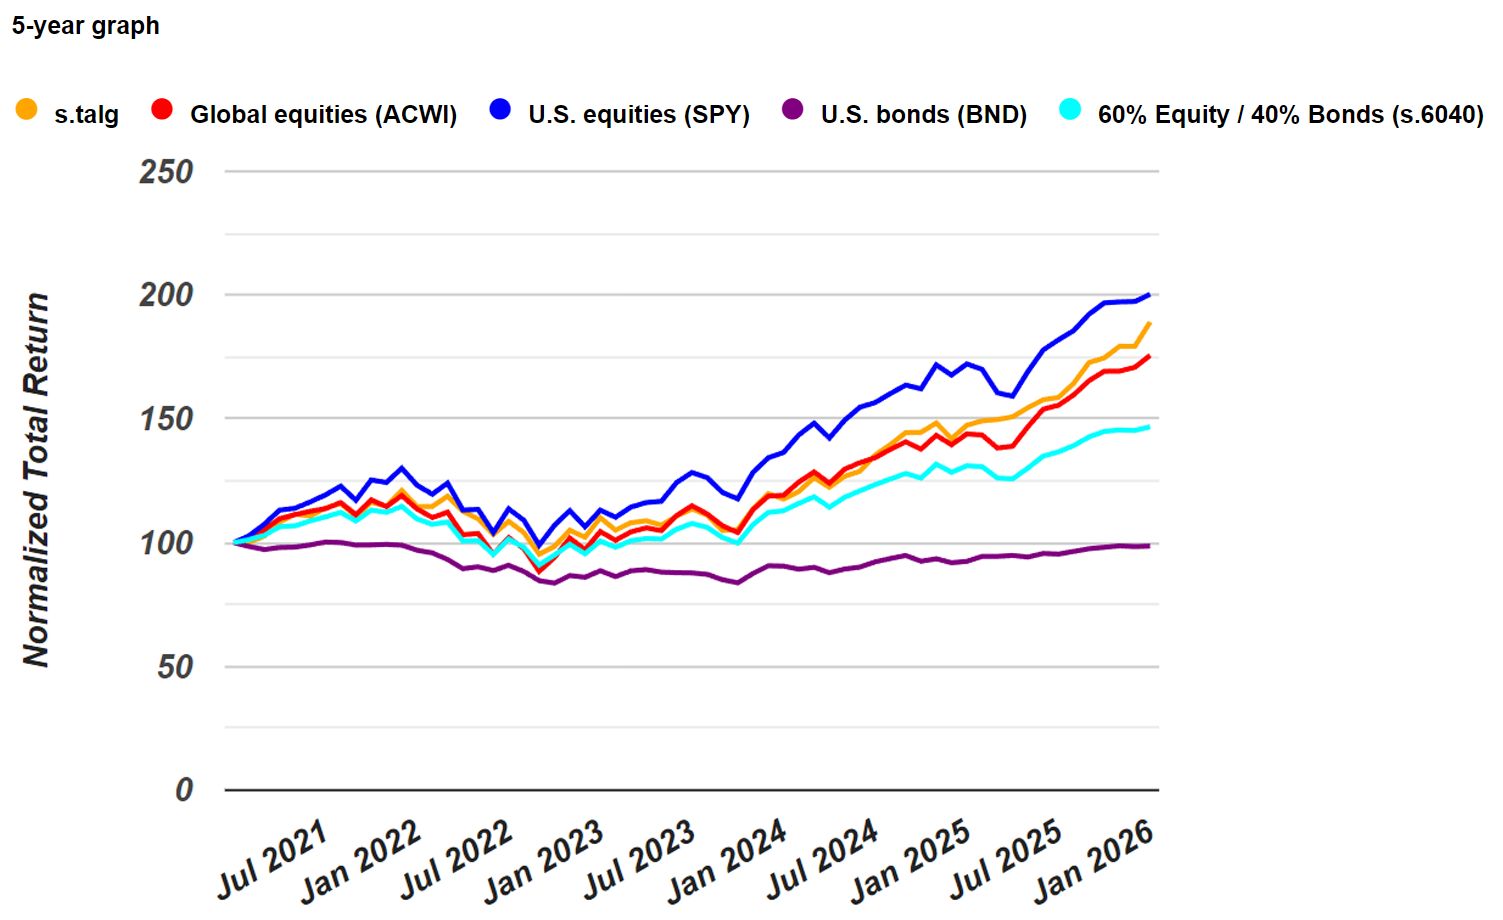
Over the past five years:
- The portfolio has nearly caught up with the S&P 500.
- It has tracked the MSCI All Country World Index (ACWI), a broad global equity benchmark, quite closely.
- More recently, it has pulled ahead of that global index.
In comparison to a broad international equity ETF tracking ACWI, the portfolio has delivered stronger performance over the past five years. While it has not outperformed the S&P 500 over that same period, performance alone does not provide a complete picture. Risk must also be considered.
Risk and Return Analysis
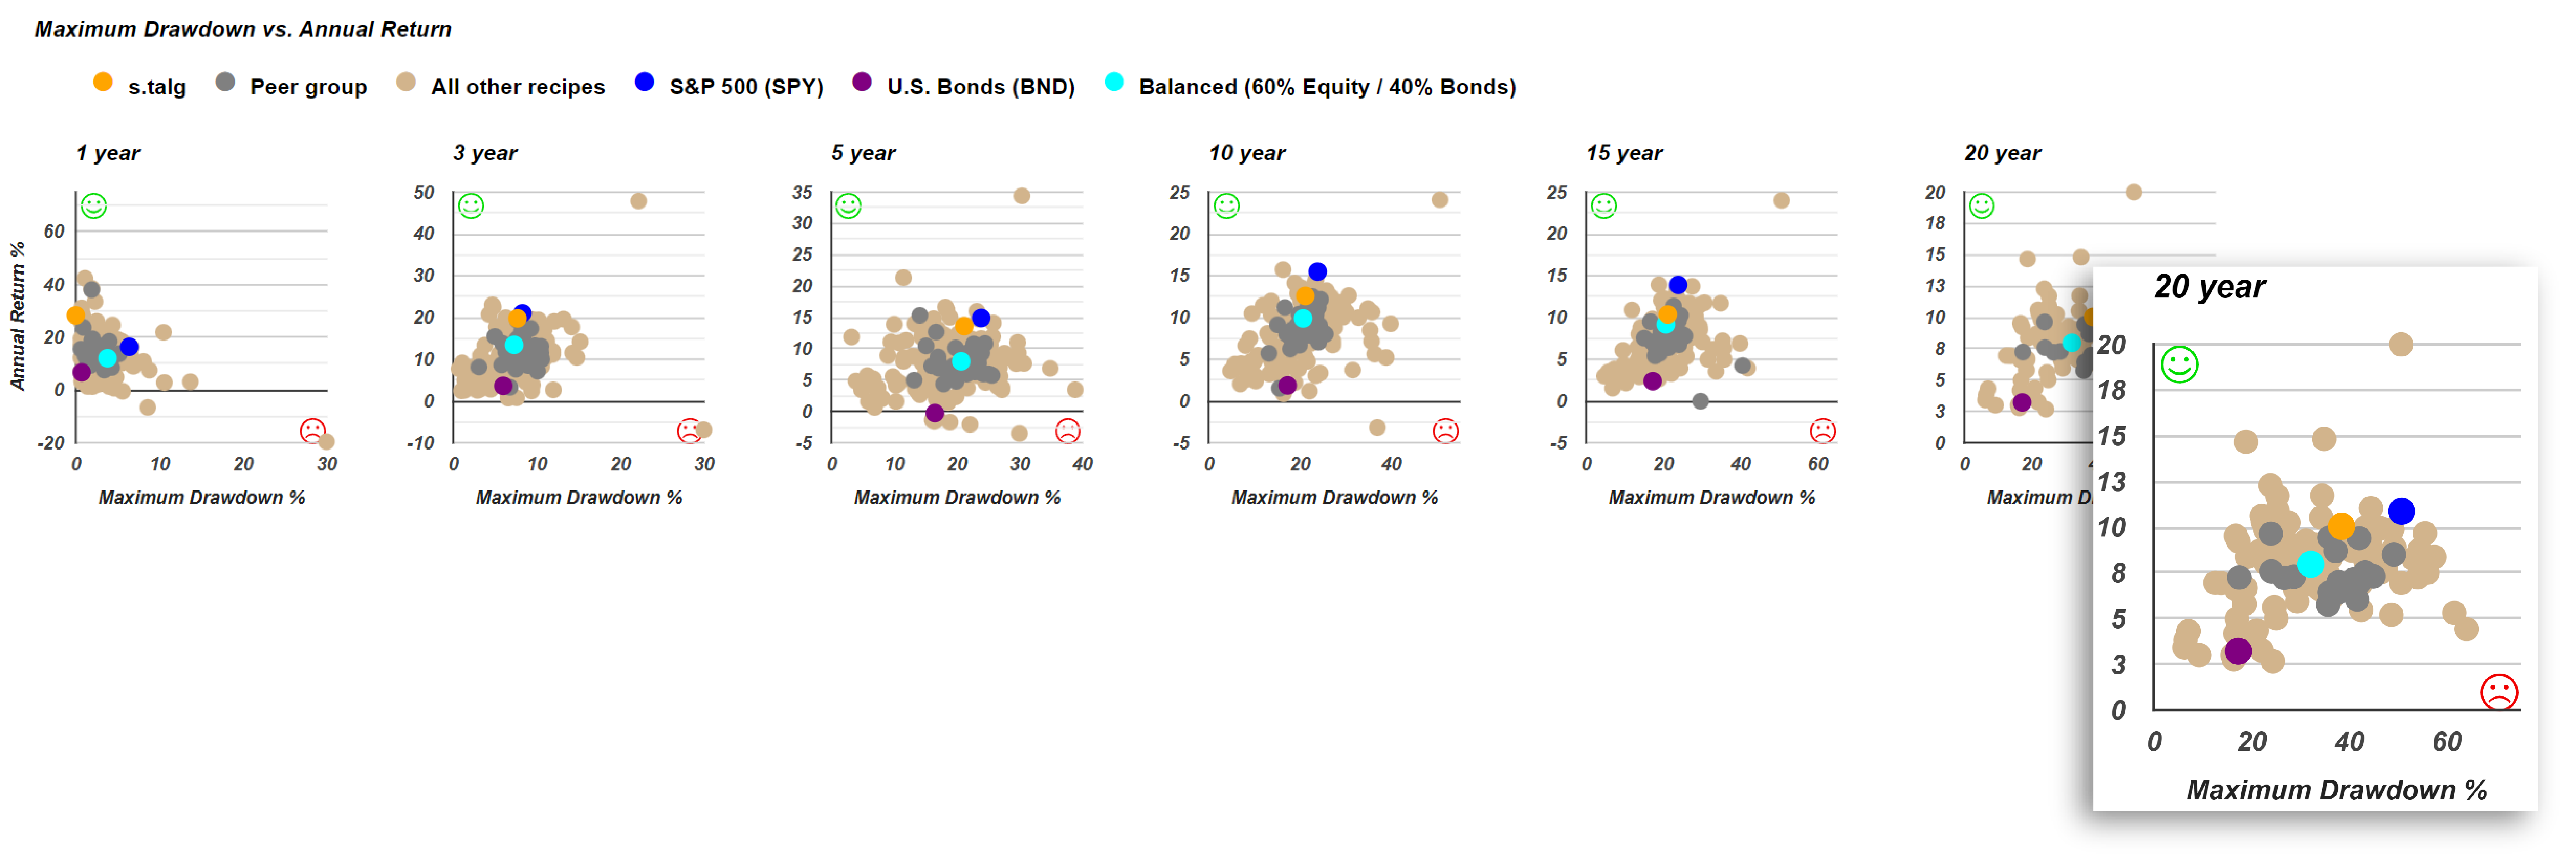
Looking at the 20-year scatter plot of risk versus return:
- The portfolio’s maximum drawdown is approximately 38.5%, represented along the horizontal axis.
- Its annualized return over that period is about 10%, represented along the vertical axis.
On the chart, this places the portfolio at roughly (38.5%, 10%)—an attractive combination of return and risk. Notably, the portfolio appears to be positioned above and to the left of a blended allocation consisting of the S&P 500 combined with the Vanguard Total Bond Market ETF (BND). On a risk–return scatter plot, being above and to the left indicates it has a higher return and a lower drawdown.
This suggests that, historically, the Talmud Equities and Gold portfolio has delivered a more favorable balance of return and downside risk than a simple S&P 500 and U.S. bond combination.
A similar pattern appears when examining downside deviation and standard deviation. While the portfolio dips slightly below the efficient frontier line in some views, the overall positioning remains competitive. Importantly, downside deviation is often preferred as a risk metric because it focuses only on harmful volatility and does not penalize positive upside returns. Taken together, the evidence suggests that Talmud Equities and Gold has historically offered a compelling balance between growth and risk control within a static one-third allocation framework.
Focusing specifically on the 20-year scatterplot provides a clearer view of how these portfolios compare over time. The chart displays each portfolio’s maximum drawdown on the horizontal axis and its annualized return on the vertical axis.
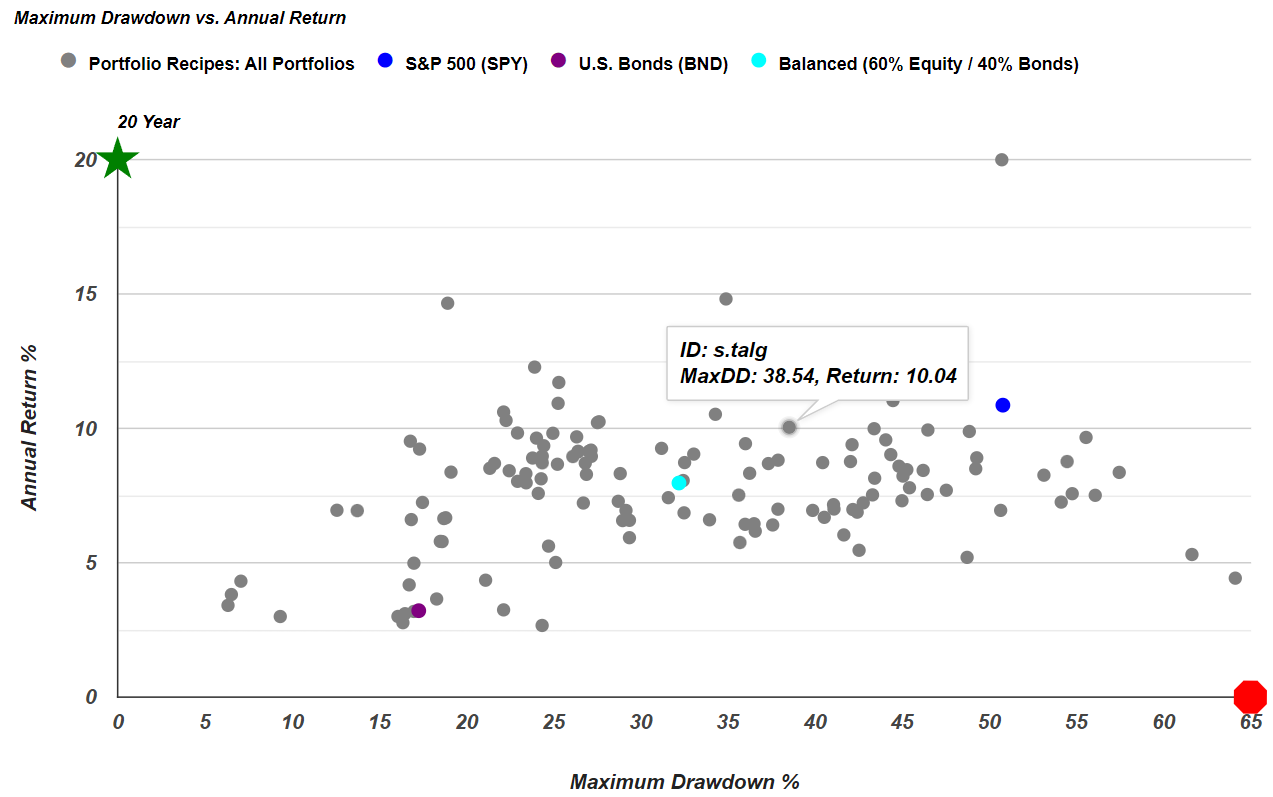
On this plot, Talmud Equities and Gold (s.talg) shows:
- A maximum drawdown of approximately 38.5%
- An annualized return of roughly 10%
For comparison, the Vanguard Total Bond Market ETF (BND) appears as a lower-risk, lower-return point on the chart. The Balanced 60/40 (s.6040) portfolio composed of 60% equity and 40% bonds lies along the frontier formed by blending stocks and bonds in varying proportions. This 60/40 allocation represents a traditional static mix of broad equities and bonds. Another relevant comparison is the Balanced 80/20 (s.8020) portfolio.
When plotted, Talmud Equities and Gold appears:
- Slightly above the 80/20 allocation (indicating higher return)
- Clearly to the left of it (indicating lower drawdown)
In other words, it has historically delivered greater returns with less downside risk than the static 80/20 portfolio. That said, it does not surpass some of the more advanced tactical strategies. For example:
- t.pure and t.aaaf exhibit comparatively low drawdowns with higher returns, placing them in a particularly strong risk–return position. These are tactical asset allocation strategies that adjust more actively over time.
- On the higher-risk, higher-return end of the spectrum is Quartile Sector Rotation (t.srqr), a concentrated tactical strategy that selects the top-performing sector fund and replaces it only when it falls out of the top quartile rankings. This approach can produce strong returns but comes with greater volatility.
Within this broader landscape, Talmud Equities and Gold occupies a compelling middle ground. It sits between the S&P 500 and the Balanced 60/40 portfolio in terms of risk and return. It also demonstrates advantages over the Balanced 80/20 static allocation.
However, it does not quite match the performance of certain tactical strategies. That distinction is important: tactical portfolios typically require monthly adjustments and can involve significantly higher turnover. In contrast, Talmud Equities and Gold remains a static (strategic) portfolio, maintaining a fixed one-third allocation with periodic rebalancing but no shifts in underlying asset selection. For an investor seeking a disciplined, rules-based structure with competitive long-term risk–return characteristics without the complexity and turnover of tactical management this portfolio represents a strong intermediate option.
Conclusion
Several important lessons emerge from this analysis.First, it is essential to go to the source. Even when investment guidance can be summarized in just a few sentences, an investor should examine the underlying rationale. This does not necessarily require studying ancient texts in their original language, but it does mean investigating the foundation of a recommendation. Assumptions such as how a passage is translated or interpreted can significantly influence how a strategy is constructed. Investment advice often arrives secondhand, and careful evaluation of the original reasoning is critical.
Second, variations and alternatives matter. Exploring multiple interpretations of the Talmud allocation framework led to meaningful differences in outcomes. For example, gold and short-term Treasuries can both be viewed as liquid stores of value, yet gold delivered substantially stronger returns during the tested period. Even when working from a sound principle, different implementations can produce very different results. An investor should be willing to examine multiple variations rather than assume a single interpretation is optimal.
Third, risk must be evaluated alongside return. A strong return is only attractive if the associated risk is reasonable. Metrics such as maximum drawdown, standard deviation, and downside deviation help determine whether the return profile justifies the volatility experienced. A strategy that generates impressive gains but exposes an investor to excessive losses may not be appropriate.
Finally, performance should always be viewed relative to credible benchmarks. Scatterplots are particularly useful because they reveal how a portfolio compares to established alternatives, such as a traditional balanced stock-and-bond allocation. A portfolio that sits above a benchmark (higher return) and to the left of it (lower risk) demonstrates a structural advantage. However, even then, it must be evaluated in the broader context of available options.