
2026 Sector Rotation Portfolio Recipes Risk Performance Review
Sector Rotation Portfolio Recipes: A Risk and Performance Review
June 2026
Topics this month
- Sector rotation strategies: How portfolios rotate into stronger market sectors and avoid weaker ones
- NAVFX: Fees, holdings, strategy, and weak risk-adjusted performance
- First Trust Focus Five ETF (FV): ETF structure, sector holdings, fees, and benchmark comparison
- Top 3 vs. Top 5 Sector Rotation: Fidelity sector fund selection, momentum scoring, diversification, and drawdown differences
- Relative Strength Sector Rotation (t.srrs): ETF-based rotation using a 10-month moving average and cash allocation
- Quartile Sector Rotation (t.srqr): Strong long-term returns with a higher-risk, single-holding approach
Welcome to the Recipe Investing Commentary for June 2026. This commentary reviews the investor subscription available through Recipe Investing, which provides access to portfolio allocations, portfolio recipe allocations, and a full set of analytics. For this month’s review, the focus is on the portfolio recipes and results for the period ending May 31, 2026. The goal is to examine the latest portfolio data and identify any notable trends, anomalies, or interesting developments from May 2026.
One point that stands out is the one-month total return across all portfolio recipes, which are also referred to as asset allocation portfolios. These portfolios can come in a few different varieties. Tactical portfolios use the t. prefix, and their allocations can change monthly, which they often do. Strategic or static portfolios use the s. prefix, and the assets within these portfolios do not change allocation each month. Comparable funds include exchange-traded funds and mutual funds that serve as comparisons, since they are also professionally managed tactical portfolio recipes.
In total, there are three different varieties of portfolio recipes available on the site. When the portfolio recipes are sorted by one-month return in descending order, investors can see which recipes performed best and which performed worst during the month. What is especially notable is that several of the stronger performers fall within the sector rotation category. The sector rotation category appears multiple times near the top of the rankings, with additional examples appearing further down the list. This suggests that several portfolio recipes in this category performed particularly well during the one-month period.
Sector Rotation Strategies in Focus
We would like to spend some time reviewing the portfolio recipes that we track in the sector rotation category. When the list is sorted in reverse order, the sector rotation portfolio recipes appear together. In total, there are six sector rotation portfolio recipes, and they come in different varieties: one mutual fund, one exchange-traded fund, and four tactical do-it-yourself portfolio recipes. For the tactical do-it-yourself portfolio recipes, Recipe Investing provides the percentage allocations each month. At the beginning of every month, subscribers receive a notification, and the updated allocations are posted at go.recipeinvesting.com. An investor can log in, review the percentage allocations, make the appropriate adjustments through a brokerage account, and potentially achieve results similar to those shown.
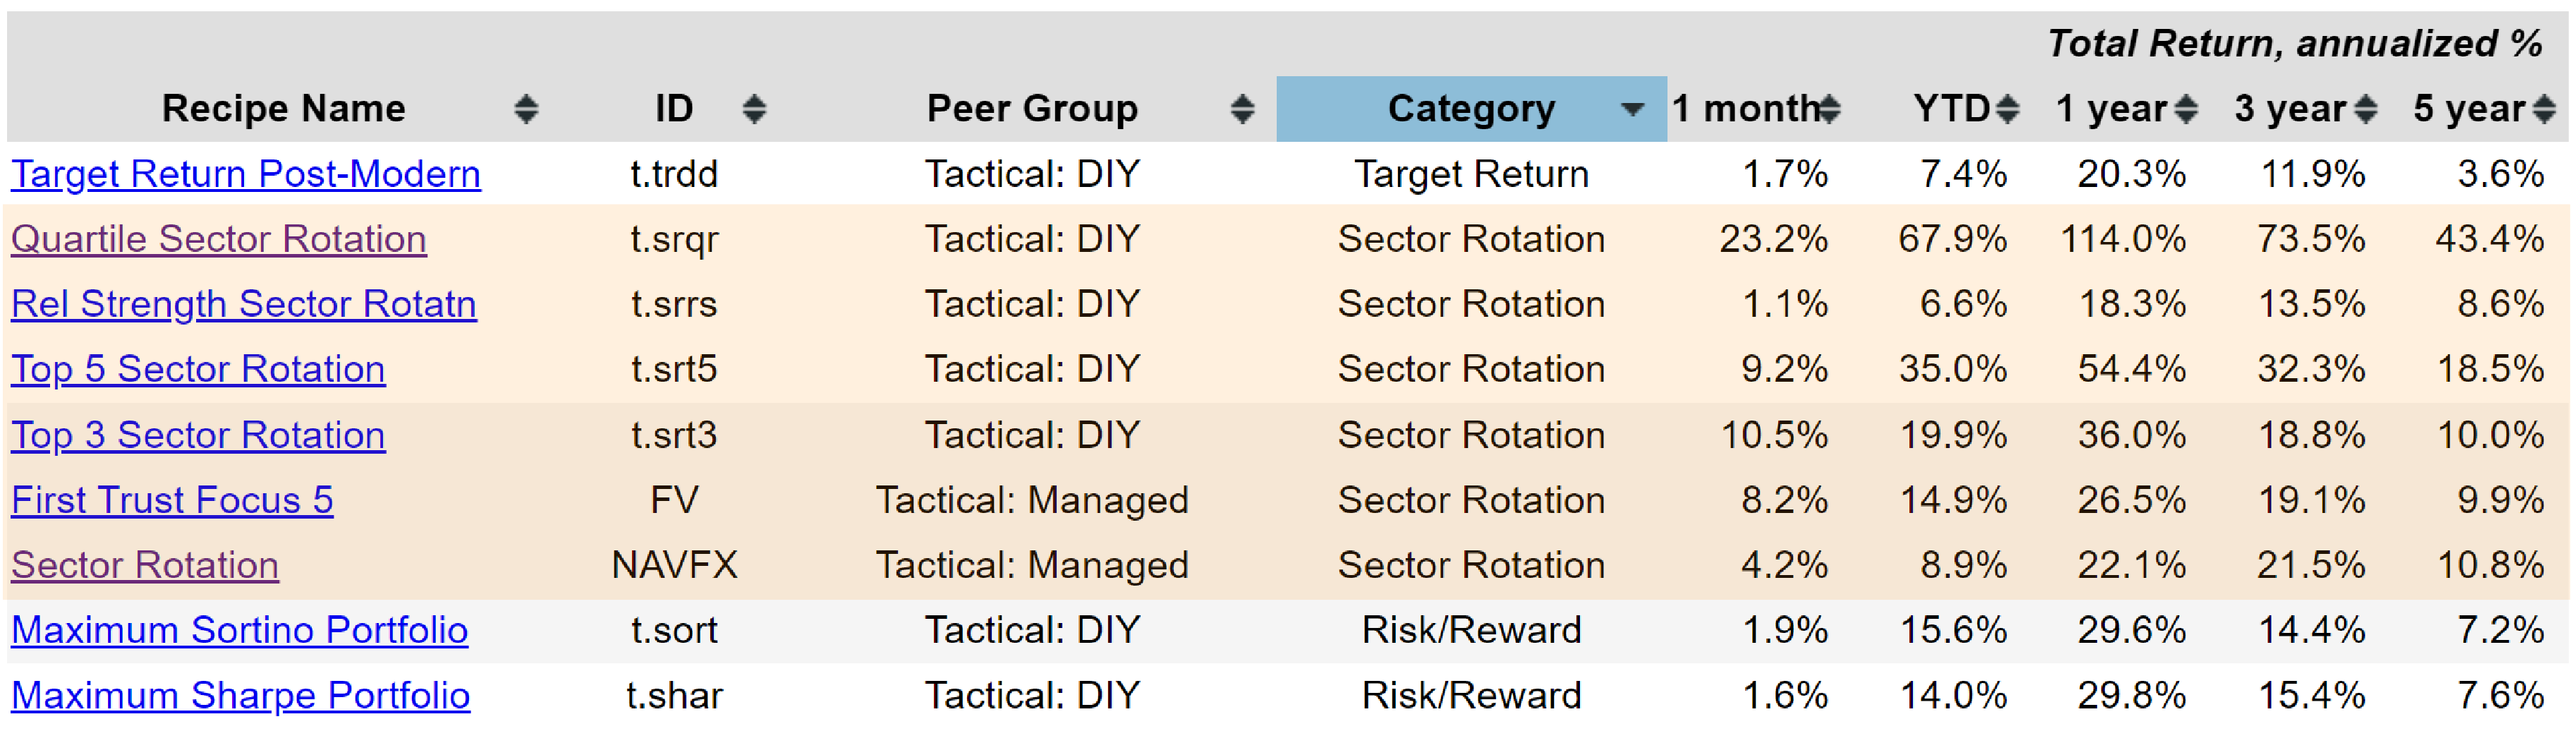
Since there are three different varieties, it is useful to review each one and see what can be learned. These portfolio recipes all share the same sector rotation theme. The idea behind sector rotation is to hold the parts of the market that are working and avoid the parts that are not. For example, semiconductors have been very strong, and technology has also performed well recently. The goal is to move into stronger sectors and avoid sectors that are weak or only moderately strong. If technology begins to decline while consumer staples and energy start moving higher, a sector rotation strategy may reduce exposure to technology and increase exposure to those improving sectors. In other words, the portfolio rotates from one area of the market to another in an effort to be positioned in the right sectors at the right time.
At Recipe Investing, this process is done at the end of the month based on the latest monthly results. Some sector rotation funds available in the market may rebalance twice a month or on an as-needed basis. As a result, the frequency of trades can vary. Other factors can also differ across sector rotation strategies, including the number of sectors or funds held at one time, the method used to decide which sectors to include or avoid, and the way the portfolio is delivered. In this group, the delivery methods include a mutual fund, an exchange-traded fund, and do-it-yourself portfolio recipes.
NAVFX: A Managed Sector Rotation Fund
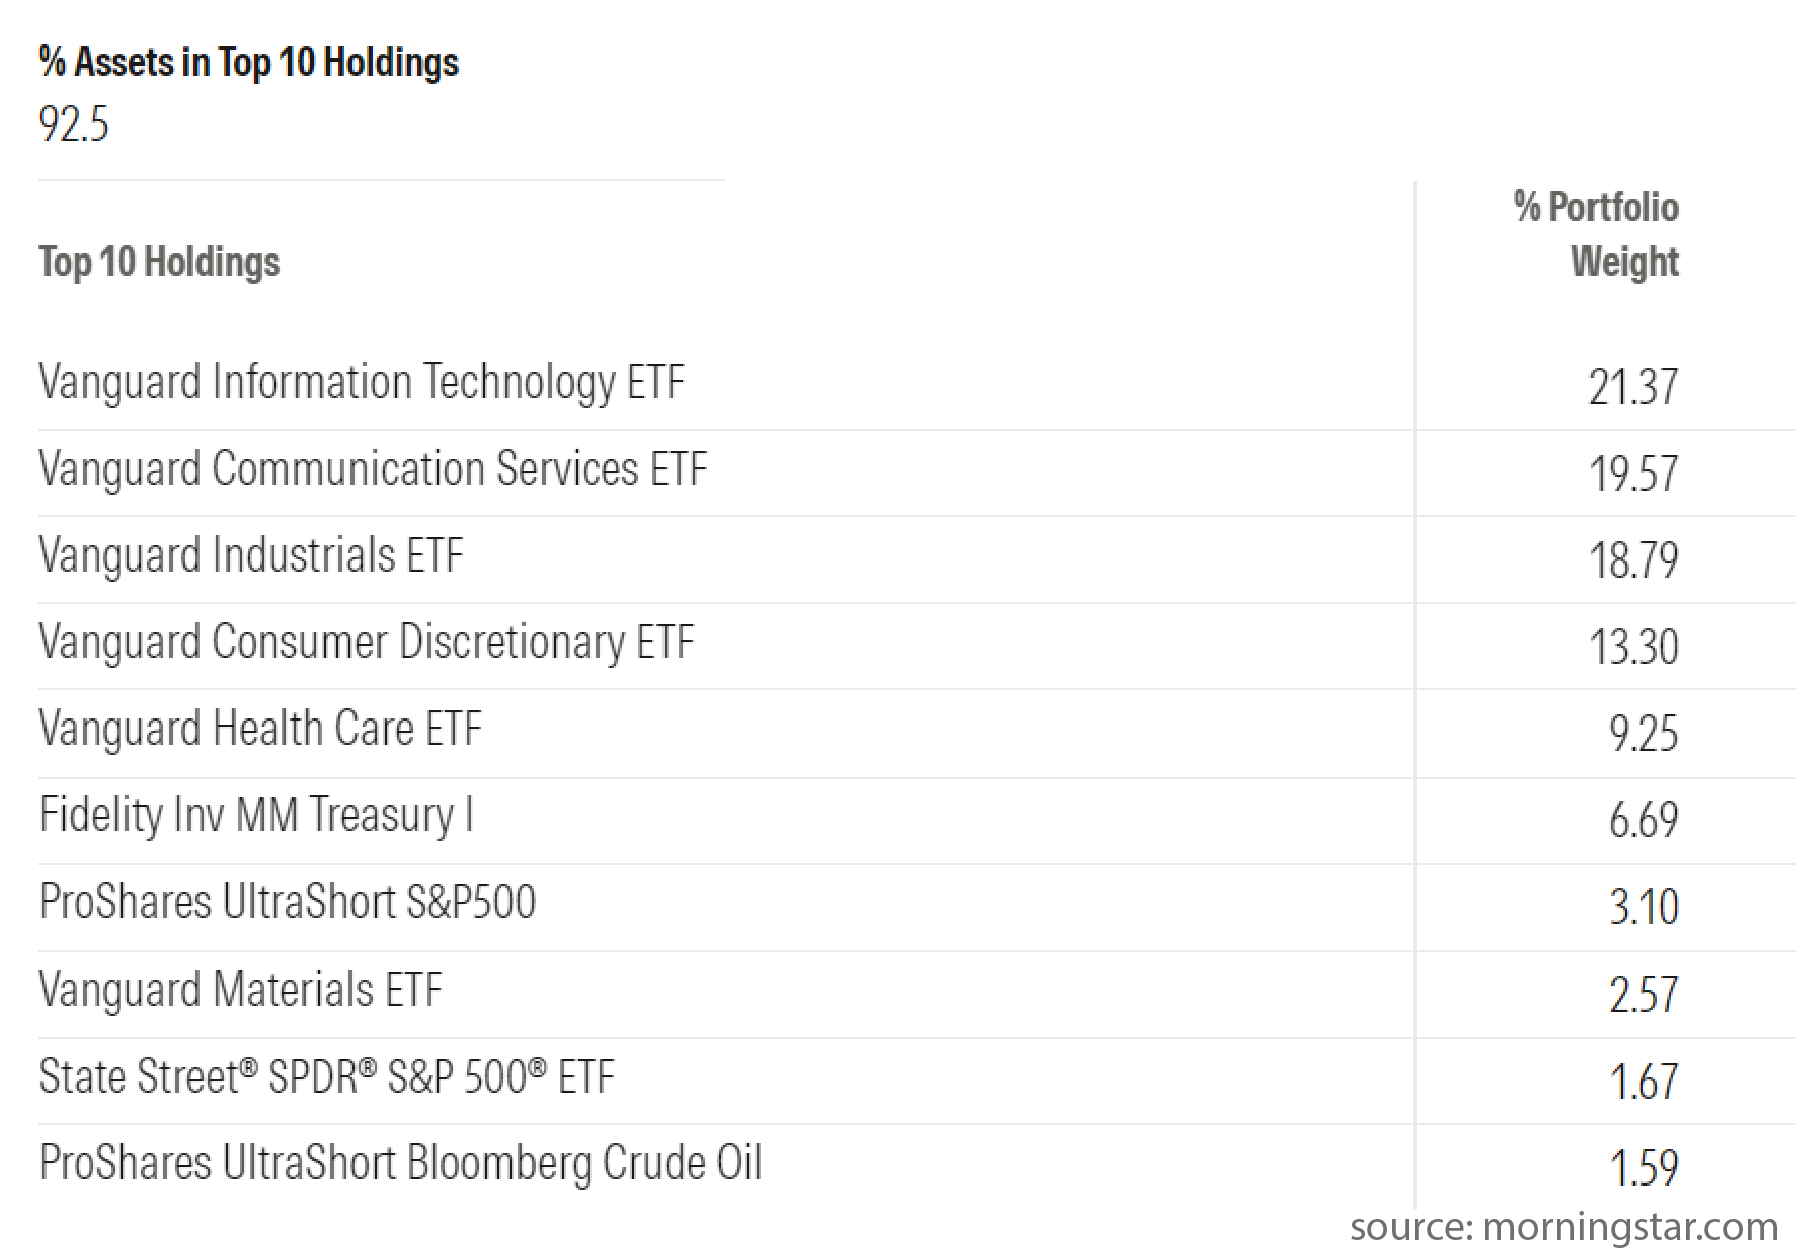
Let's look at each of these in turn, starting with NAVFX. This is an aptly named Sector Rotation Fund managed by Grimaldi Portfolio Solutions. NAVFX is a relatively small mutual fund with $44 million in assets under management. While $44 million is certainly a significant sum, it is on the smaller side by mutual fund standards. Its expense ratio is 2.04%, meaning an investor pays roughly 2% of invested assets each year just to hold a position in the fund. It is, at least, a no-load fund. Overall, NAVFX is a rather expensive and not particularly large mutual fund. In terms of what it holds, NAVFX is a fund of funds. It invests in exchange-traded funds, and the costs of those underlying ETFs are factored into the fund's overall fee. The fund currently holds 12 ETFs, which together account for 92.5% of its total assets.
As for its strategy, the fund's prospectus describes an approach that evaluates relative strength and momentum, essentially a measure of how well a given sector has performed recently. Notably, the prospectus does not specify the momentum interval used, whether that is one month, three months, six months, 12 months, or some blend of those periods. What is clear is that the fund evaluates different sectors of the economy to identify short-term opportunities, with the goal of being in the right sector at the right time and out of underperforming sectors when appropriate.
The prospectus also explains, in fairly general terms, how a typical sector rotation fund works. The fund invests in ETF shares representing various domestic and foreign markets, regions, and countries, though it is not particularly specific about its allocation method. One detail it does clarify is that the fund can invest across 11 major market sectors, which aligns closely with the 12 ETFs it currently holds. This provides a broad overview of NAVFX in terms of its fees and a general sense of its fund selection method, offering at least some insight into how the fund operates.
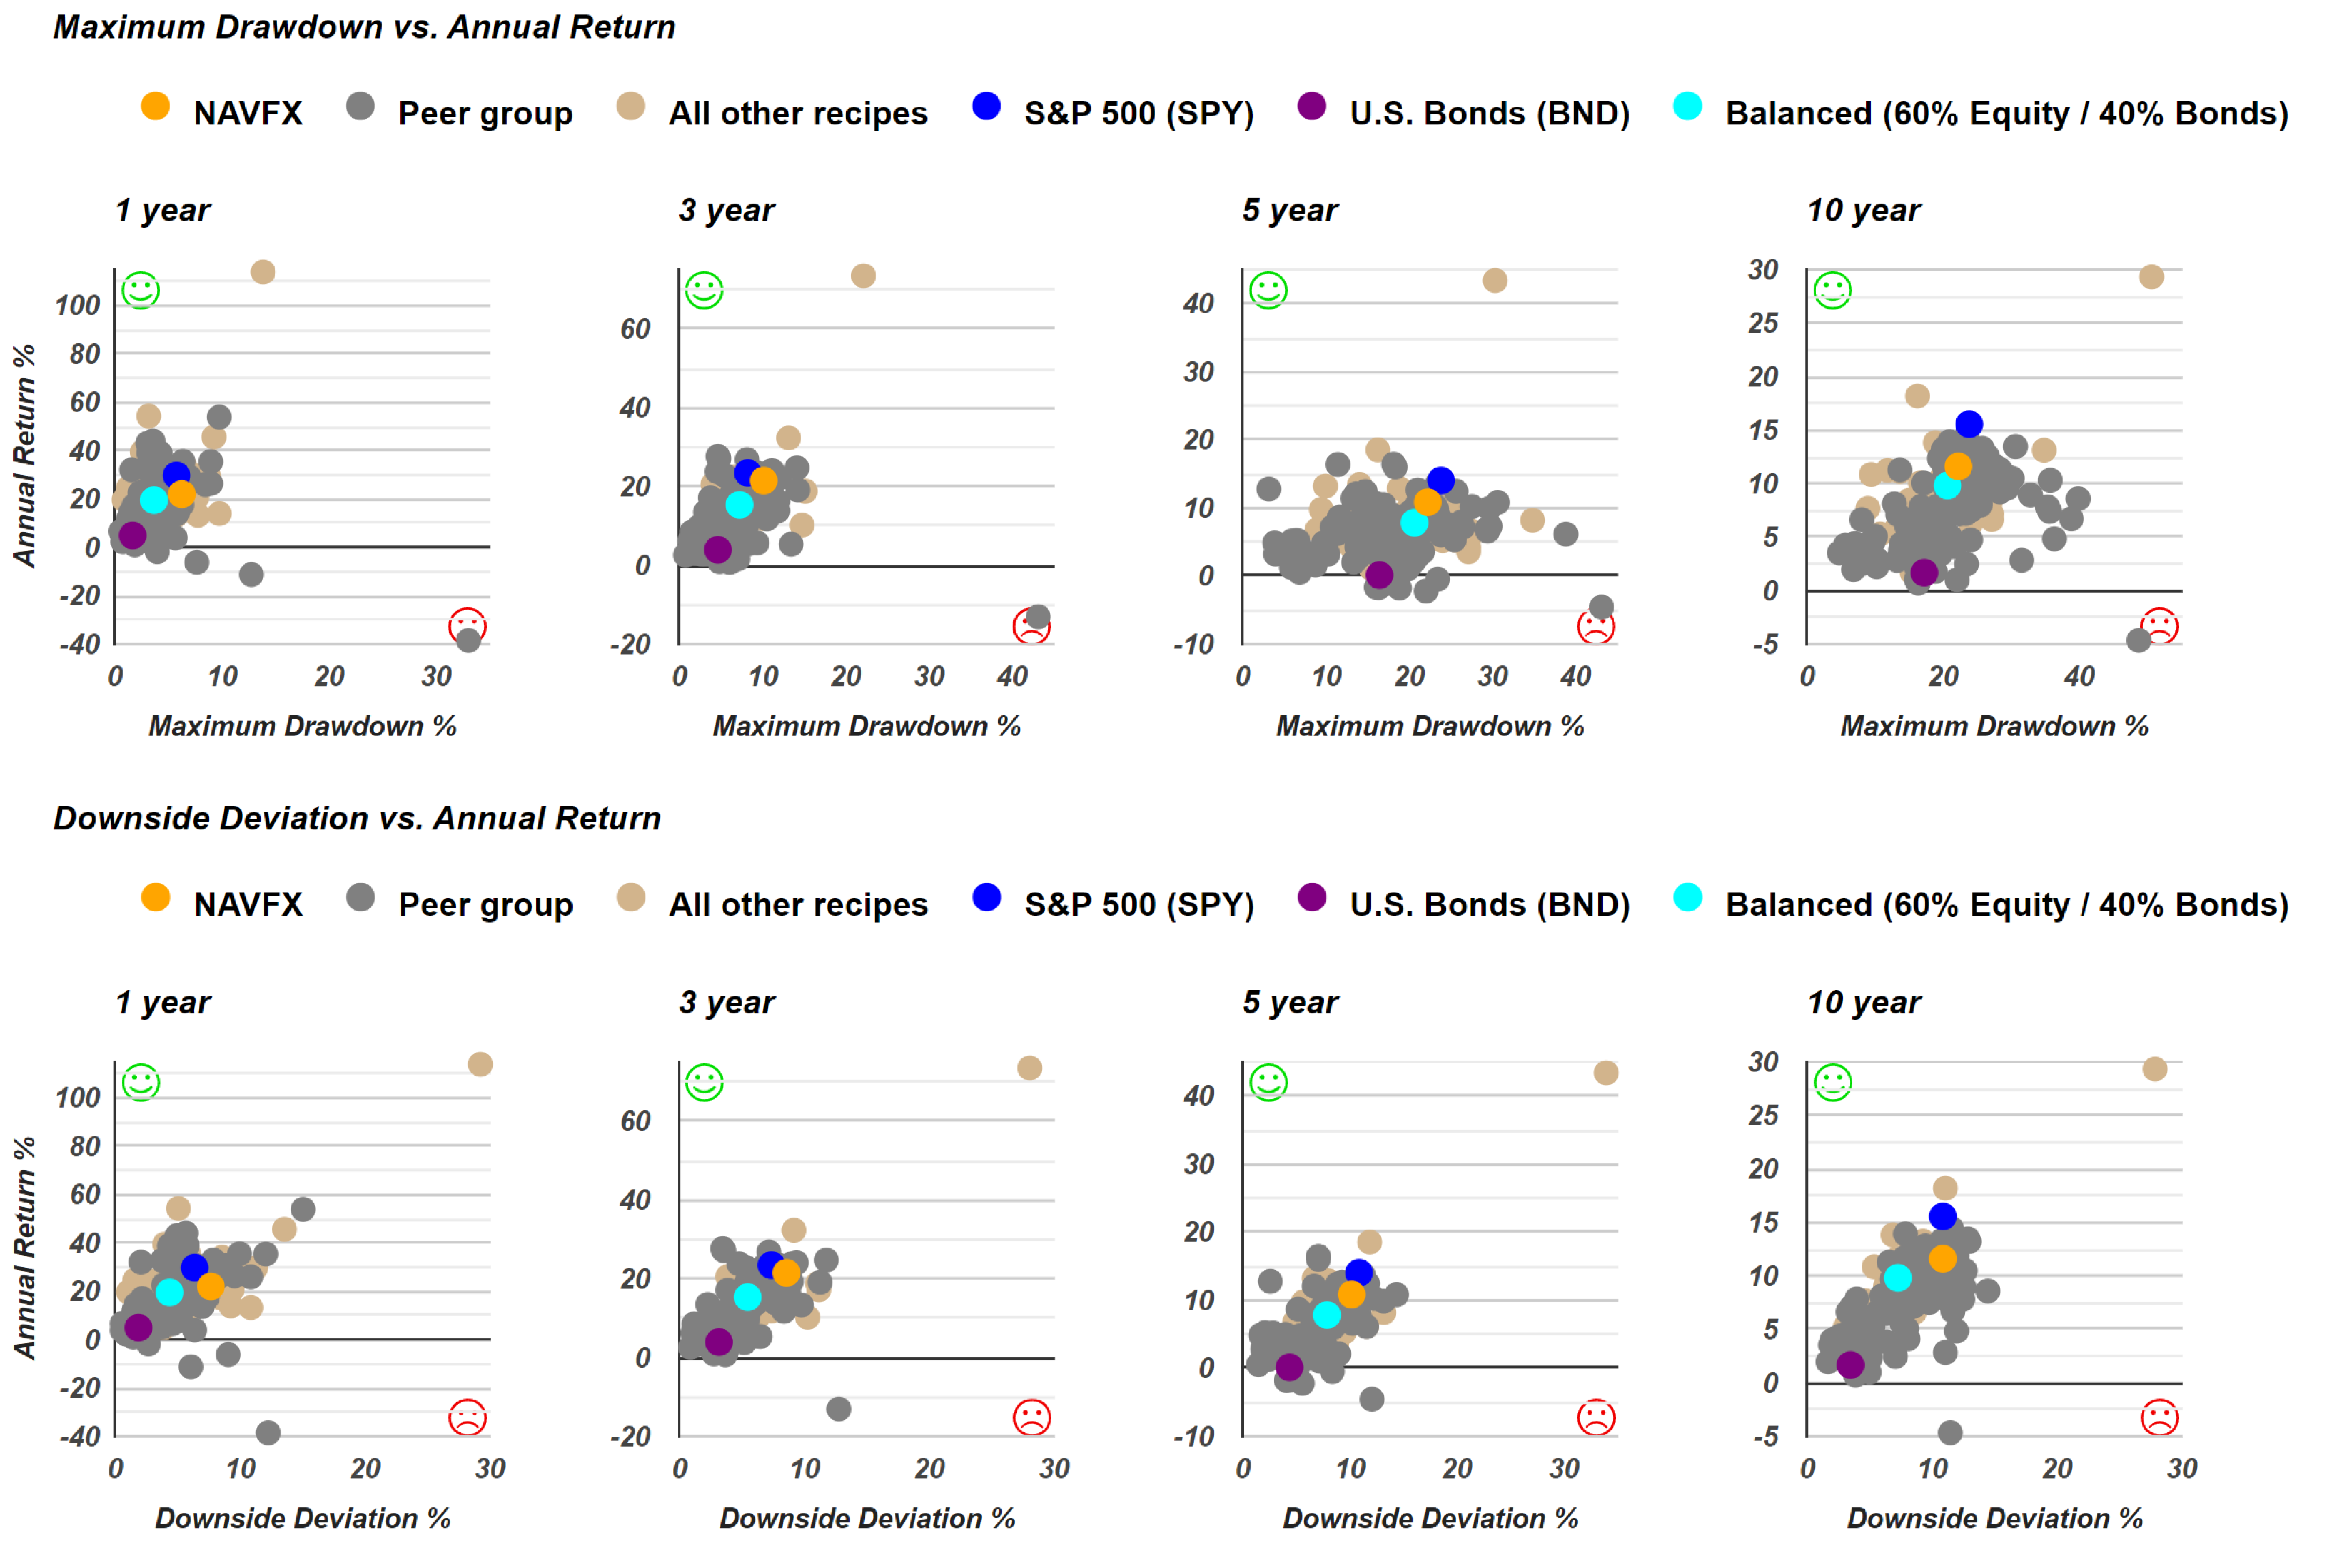
When reviewing NAVFX performance, U.S. equities have clearly outperformed this fund, especially given their recent strength. The risk versus return scatterplots provide a more useful view because they show annualized total return on the vertical axis and a risk measure on the horizontal axis. Since NAVFX does not have 15 or 20 years of performance history, the review is limited to the 10-year period and more recent data. Over the 10-year period, using maximum drawdown as the risk measure, NAVFX falls between the S&P 500, represented by SPY, and a blended portfolio. However, when using downside deviation, NAVFX looks less favorable. Over the longest available period for this measure, the fund has a higher downside deviation and a lower return than the S&P 500.
In other words, compared with the S&P 500, NAVFX has delivered weaker returns with greater risk. Against a balanced portfolio, it has produced more return, but also with more risk. That tradeoff may not be especially attractive, particularly when better alternatives may be available. One example is the Tactical Top 5 Sector Rotation portfolio recipe, or t.srt5, which holds five mutual funds and appears to perform considerably better. NAVFX does not appear to have a strong scorecard based on this review. Its performance and risk profile are not especially compelling compared with the S&P 500 or other sector rotation options.
First Trust Focus Five ETF (FV)
Next, the review moves from NAVFX to FV, the First Trust Focus Five ETF. Since FV is an exchange-traded fund, its fees would generally be expected to be lower than those of a mutual fund. FV invests in five different exchange-traded funds based on its own sector rotation analysis. In terms of performance, FV has not beaten the S&P 500 over the past five years.
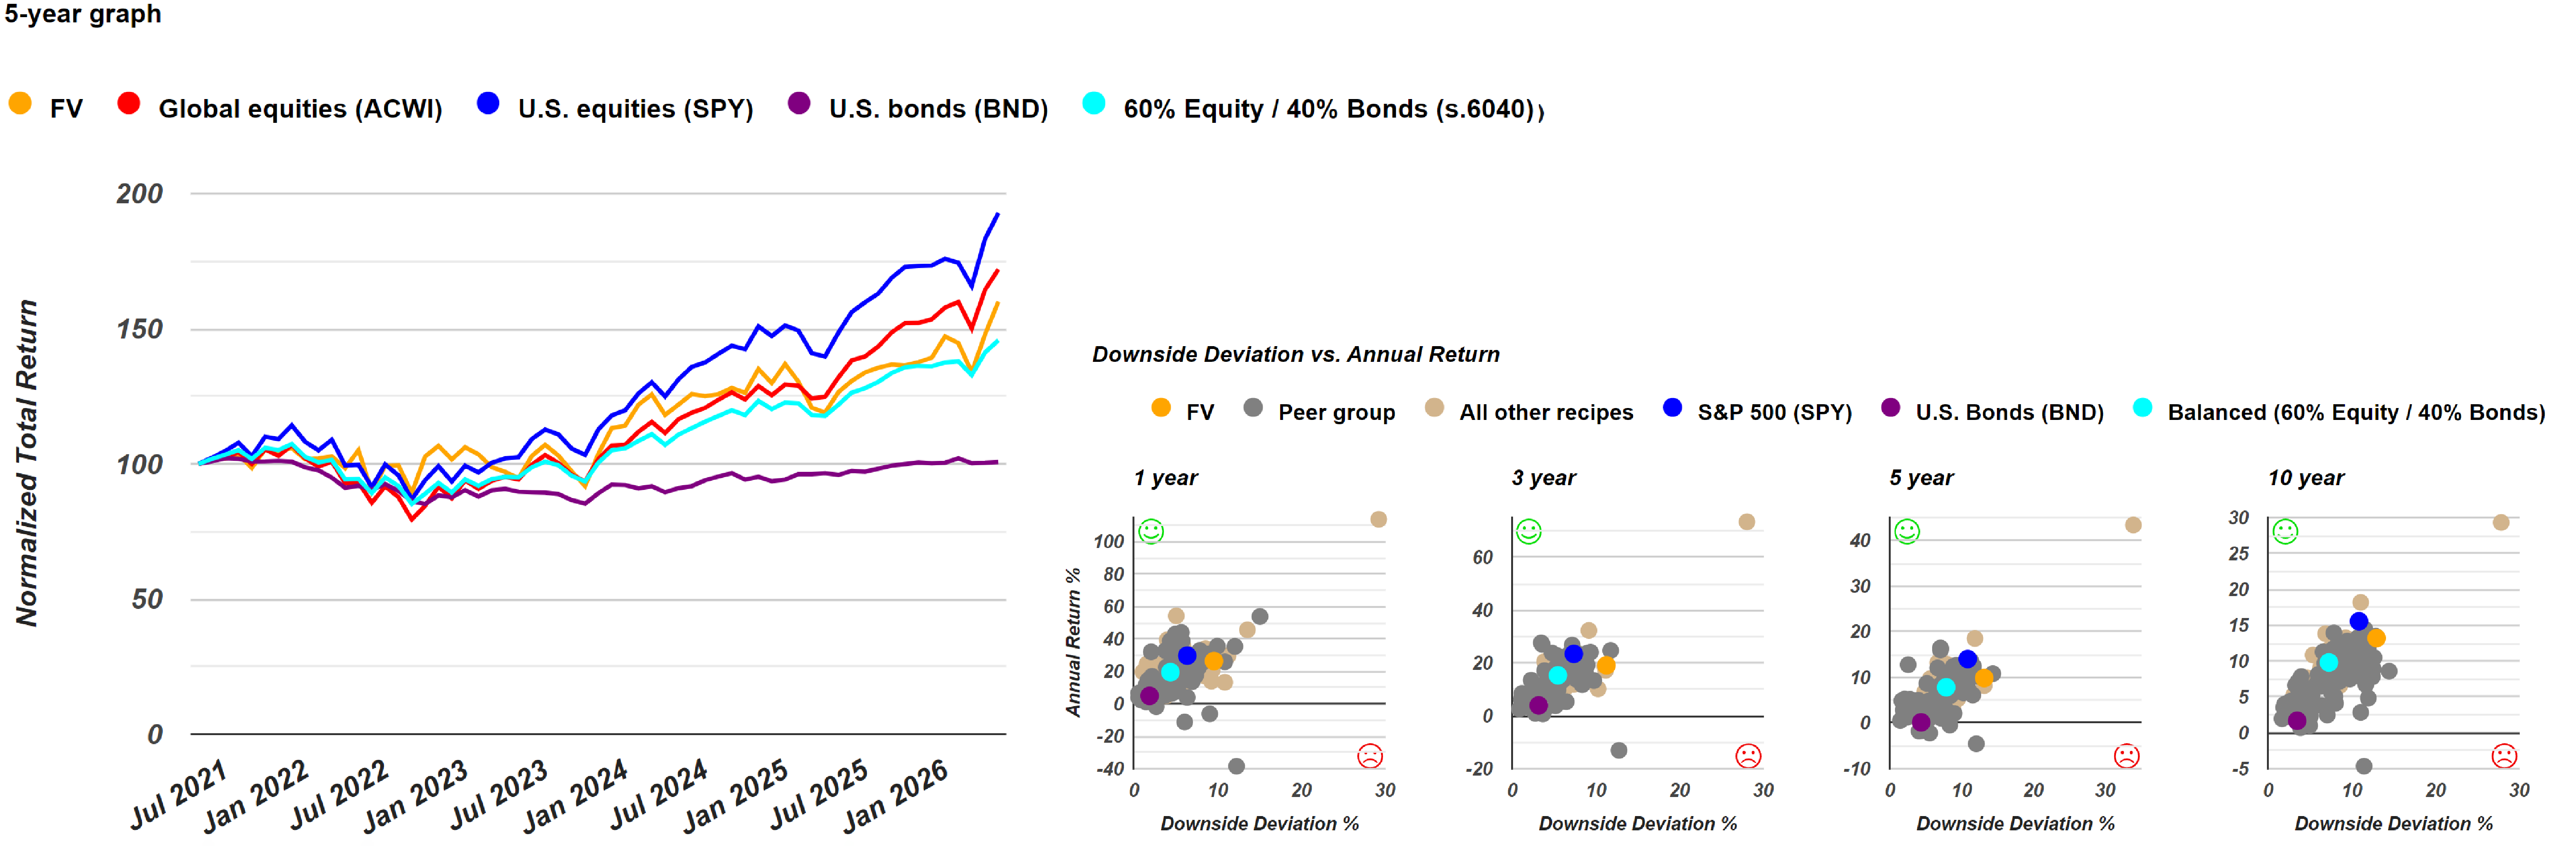
The line chart shows that it has lagged slightly. The scatterplot analysis provides a clearer picture, especially when looking at downside deviation as the risk measure. Since FV does not have enough history for a 15-year or 20-year review, the analysis is limited to shorter time periods. Compared with the S&P 500, FV has shown higher risk and lower return, which makes it less favorable on that basis. Compared with a balanced 60/40 portfolio, FV sits above and to the right, meaning it has delivered more return but with more risk. That may fit some investor preferences, but FV does not appear to be a clear winner against either the S&P 500 or the balanced portfolio. It does not offer a distinct advantage of both higher return and lower risk.
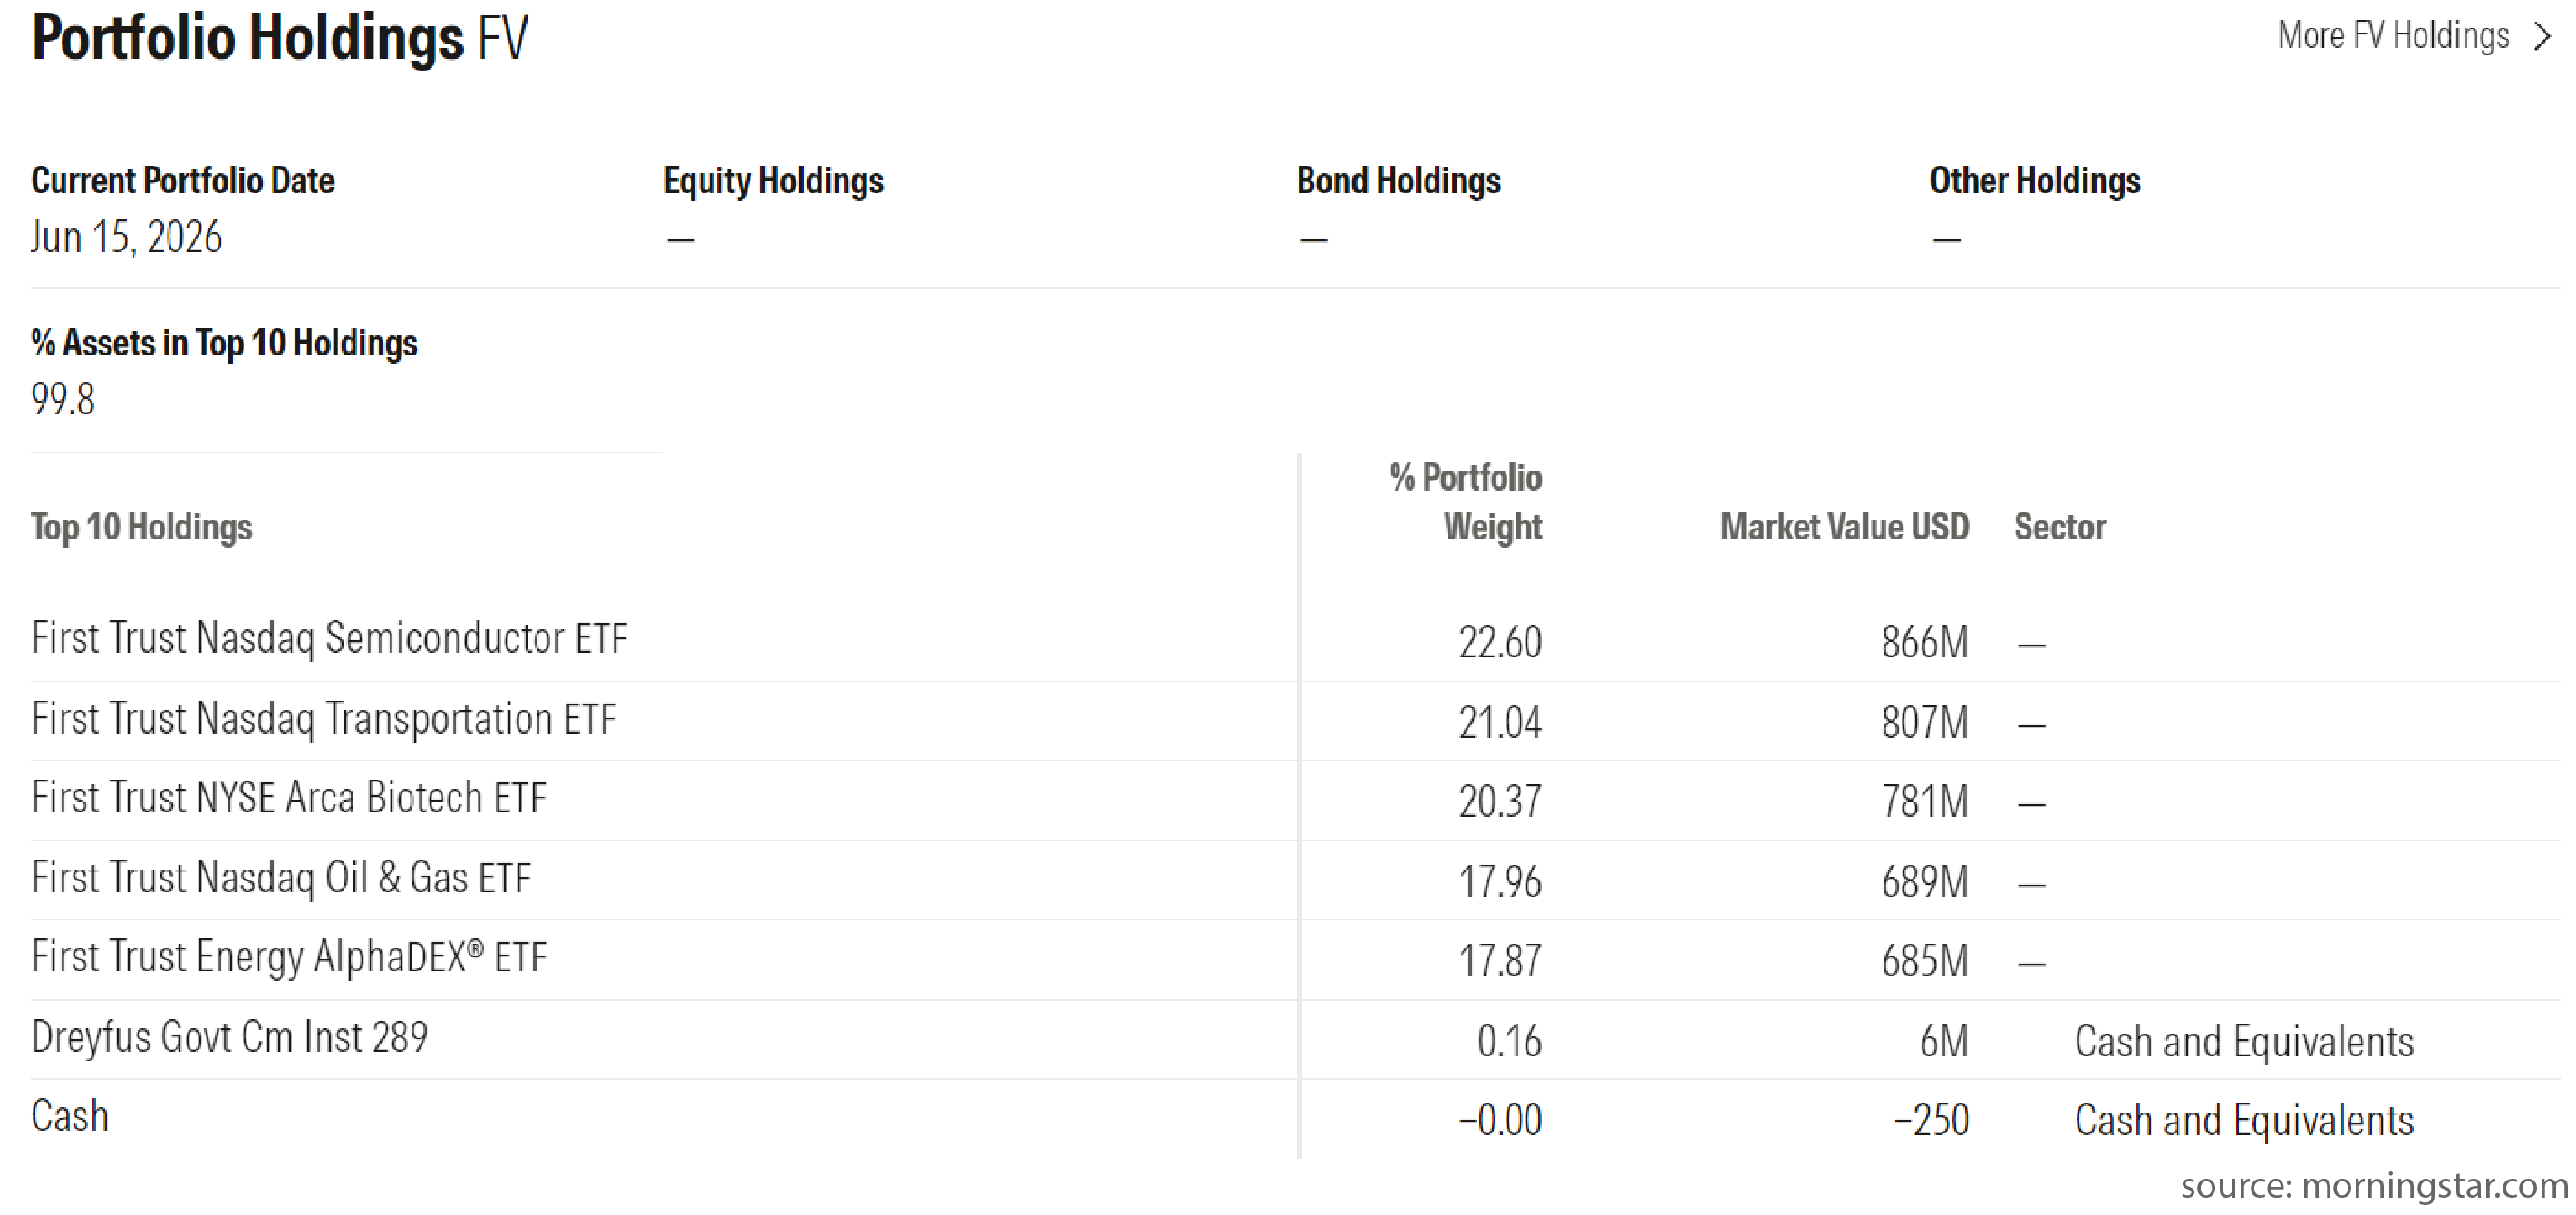
Morningstar data shows that FV has a 0.89% expense ratio. This is lower than NAVFX, although still somewhat high for an exchange-traded fund. FV also has approximately $3.83 billion in assets, making it much larger than the NAVFX mutual fund reviewed earlier. The fund holds five exchange-traded funds, along with a small amount of cash, which together account for about 99.8% of assets. The holdings are not exactly equal weighted, but the allocations are fairly close, ranging from about 18% to 22% each. The current sector exposures include semiconductors, transportation, biotechnology, oil and gas, and another energy-focused ETF. All five ETFs come from First Trust’s own fund lineup, allowing the strategy to use its in-house funds. FV is rotating into the sectors it believes may offer the best potential for the coming period, but based on this review, it has not shown a clear performance or risk advantage over the S&P 500 or a balanced 60/40 portfolio.
A quick review of FV’s prospectus and website shows that the fund can look strong when viewed on its own. Many performance charts can appear attractive when they move up and to the right. However, the more important question is how the fund has performed compared with other investment options.
An investor should consider the alternatives, the competitors, and the opportunity cost of choosing this particular fund. In other words, the fund’s performance needs to be evaluated against what else could have been owned during the same period.
The three-year statistics are worth reviewing, although this is a common reporting period for funds. If the most recent three years were strong but the three years before that were poor, the shorter time frame may not fully show the broader picture. Some of that longer-term performance may appear in the five-year or 10-year annual return figures.
For the last three years, FV’s risk measures are not especially compelling:
- Its alpha has been negative (-8.02), which means it underperformed its benchmark.
- Its beta is 1.29, meaning it has been more volatile than the broader market.
- Its Sharpe ratio is below 1.0, suggesting a weaker return per unit of risk, with risk measured by standard deviation.
- Its correlation to the S&P 500 is slightly lower, but not enough to make the overall risk profile stand out.
These are not particularly strong risk measures, even over the shorter three-year period. This is why it is useful to review risk and return across longer time frames, such as five, 10, 15, and 20 years, when the data is available. A broader time frame gives investors a better view of how a fund has performed over the long term, including during major market events such as the 2008 downturn and other periods of stress.
Top 3 vs. Top 5 Sector Rotation Recipes
There are two closely related sector rotation portfolio recipes to review: Top 3 Sector Rotation (t.srt3) and Top 5 Sector Rotation (t.srt5). One selects the top three sector funds, while the other selects the top five. The Top 3 Sector Rotation portfolio recipe uses Fidelity Select Sector funds. Fidelity offers a family of sector funds, and this approach ranks them using a blended momentum score based on the past three, six, and 12 months. The most recent months receive the heaviest weighting, but the method still includes a one-year lookback period. After ranking the funds, the strategy selects the top three and invests one-third of the portfolio in each.

The Top 5 Sector Rotation portfolio recipe works in a similar way, but it selects the top five Fidelity Select Sector funds instead of the top three. In theory, this provides more diversification, and the long-term results appear to support that idea. Over the past 20 years, the Top 5 strategy had a maximum drawdown of 34.5%, compared with 46.5% for the Top 3 strategy. That is a meaningful difference and suggests that the Top 5 approach has been less risky based on this measure. The Top 5 strategy has also performed better over several time periods, including year to date, one year, three years, five years, 10 years, and 20 years. The only exception was the most recent month, and even then, the difference was not especially large.
Relative Strength Sector Rotation (t.srrs)
Two more sector rotation portfolio recipes remain to be reviewed. The next is Relative Strength Sector Rotation (t.srrs), which can invest in up to nine exchange-traded funds. ETFs can be more convenient to buy and sell during the trading day than mutual funds, which settle at the end of the day. The methodology for t.srrs uses a 10-month total return and a 10-month simple moving average. The strategy looks for funds that are trading above that moving average. If a fund is not above the 10-month moving average, the portfolio does not hold it. If fewer than four funds meet the requirement, part of the portfolio can move into cash.

This cash mechanism is an interesting feature because it may help reduce risk and smooth out volatility. The strategy can hold as many as nine ETFs, but it could also hold very few, or potentially none, if all of the funds are lagging their 10-month simple moving average. Recent performance has not been especially strong, with t.srrs gaining only 1.1% over the past month. However, over the past 20 years, it has delivered a 9.7% annualized return with a 16.8% maximum drawdown, measured on a month-end basis. That drawdown is notable because it represents the largest peak-to-trough decline over the period.
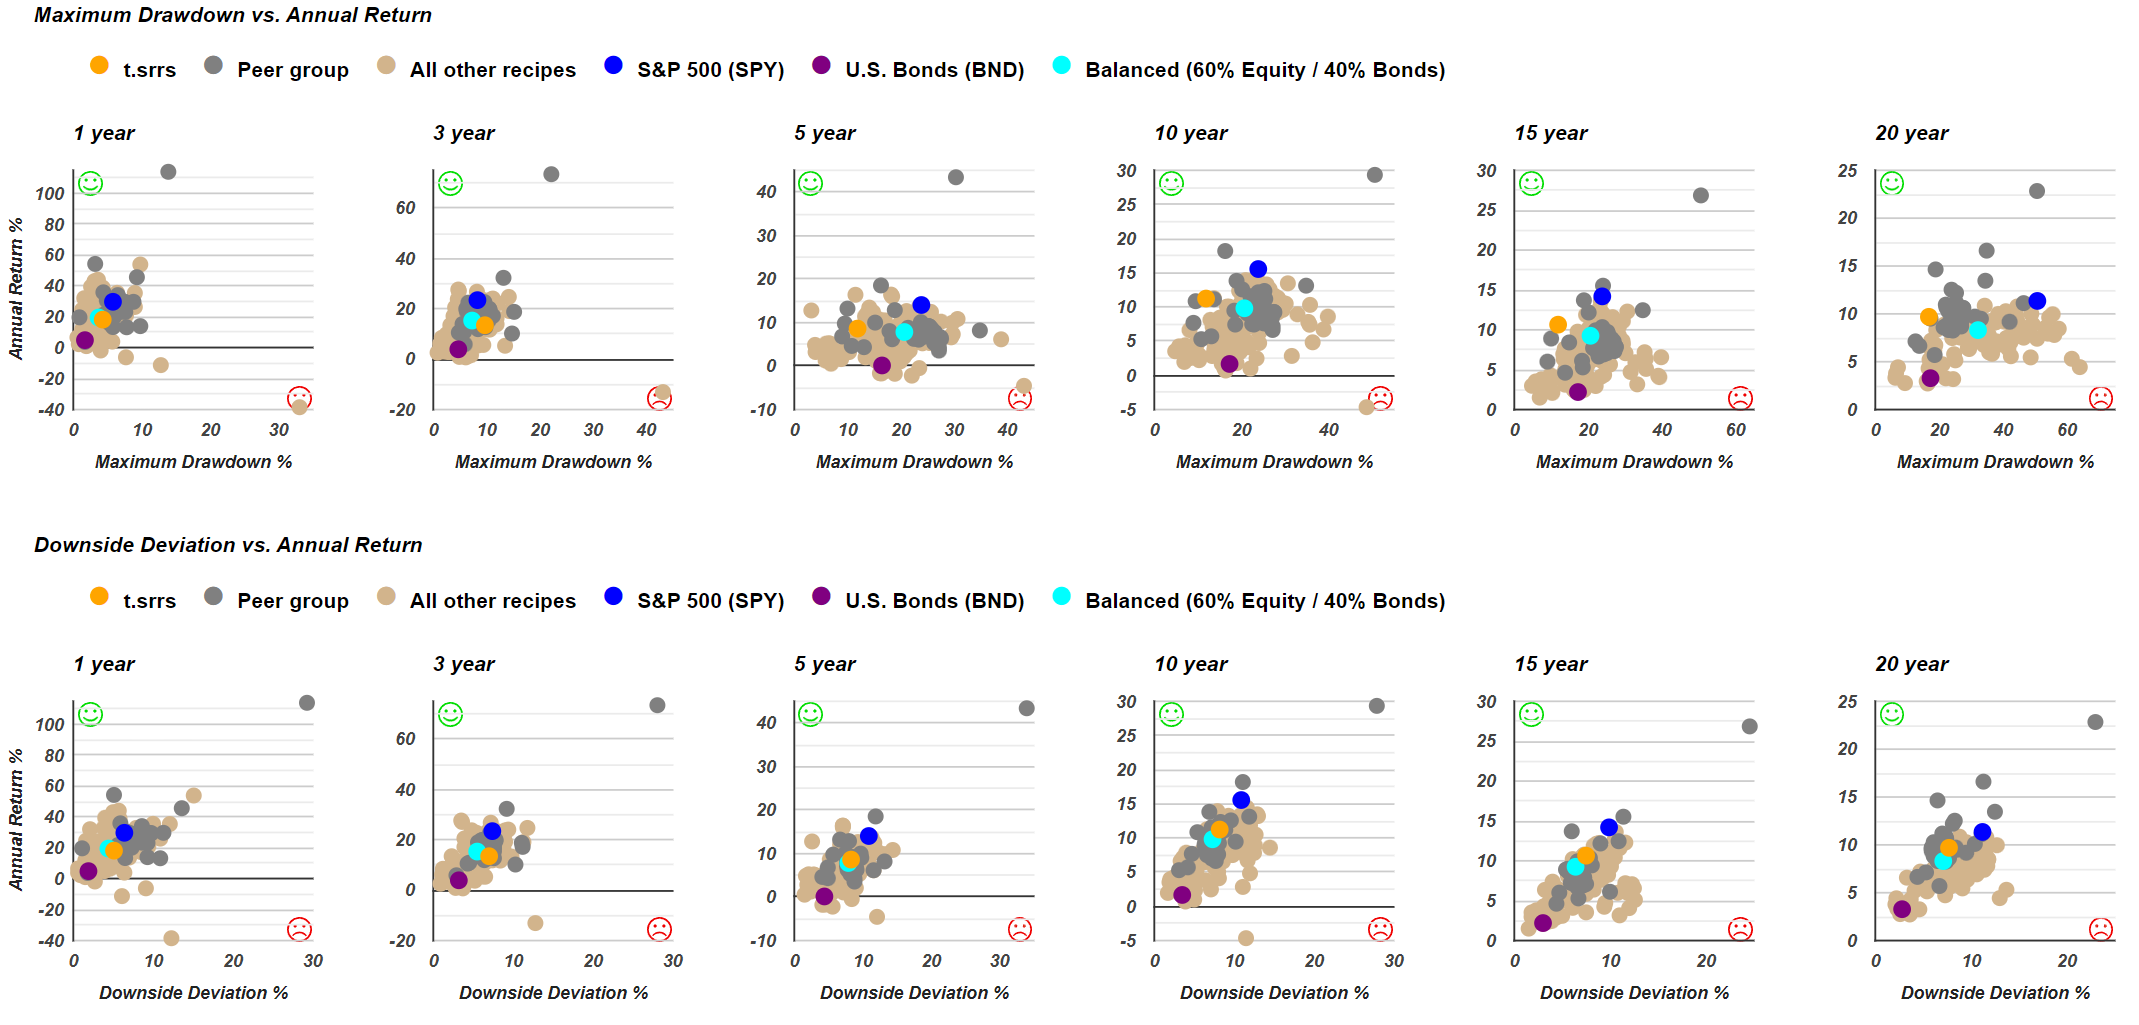
Over the past five years, t.srrs has lagged the S&P 500, although many portfolio recipes have done the same. The risk versus return scatterplots provide a more complete view. Using maximum drawdown as the risk measure, t.srrs appears above and to the left of the balanced portfolio, meaning it has offered more return with less risk over the past 20 years. The downside deviation view is less impressive, but still informative. Over the past 20 years, t.srrs appears above and to the right of the balanced portfolio, meaning it has delivered more return with more risk. A similar pattern appears over the past 15 years, where the results look fairly comparable to the balanced portfolio. It is worth noting that, despite the effort involved in selecting sectors and rotating in and out of them, some strategies still struggle to clearly beat a simple two-fund balanced portfolio. In the case of t.srrs, the strategy has offered more return and more risk compared with the balanced portfolio over the past 20 years.
Quartile Sector Rotation Recipe (t.srqr)

The final portfolio recipe in this review is the Quartile Sector Rotation Recipe (t.srqr), which has performed exceptionally well. Over the past month, it gained about 23%, and over the past year, it returned approximately 114%, more than doubling in value. Even over the past 20 years, the strategy has produced roughly 22% to 23% annualized returns, which is an extraordinary long-term result. This recipe selects from more than 100 sector funds and goes all in on a single holding. In other words, the entire allocation is placed into one selected fund at a time. Recently, that concentration has worked extremely well because the strategy has been fully invested in a sector that has delivered very strong performance.
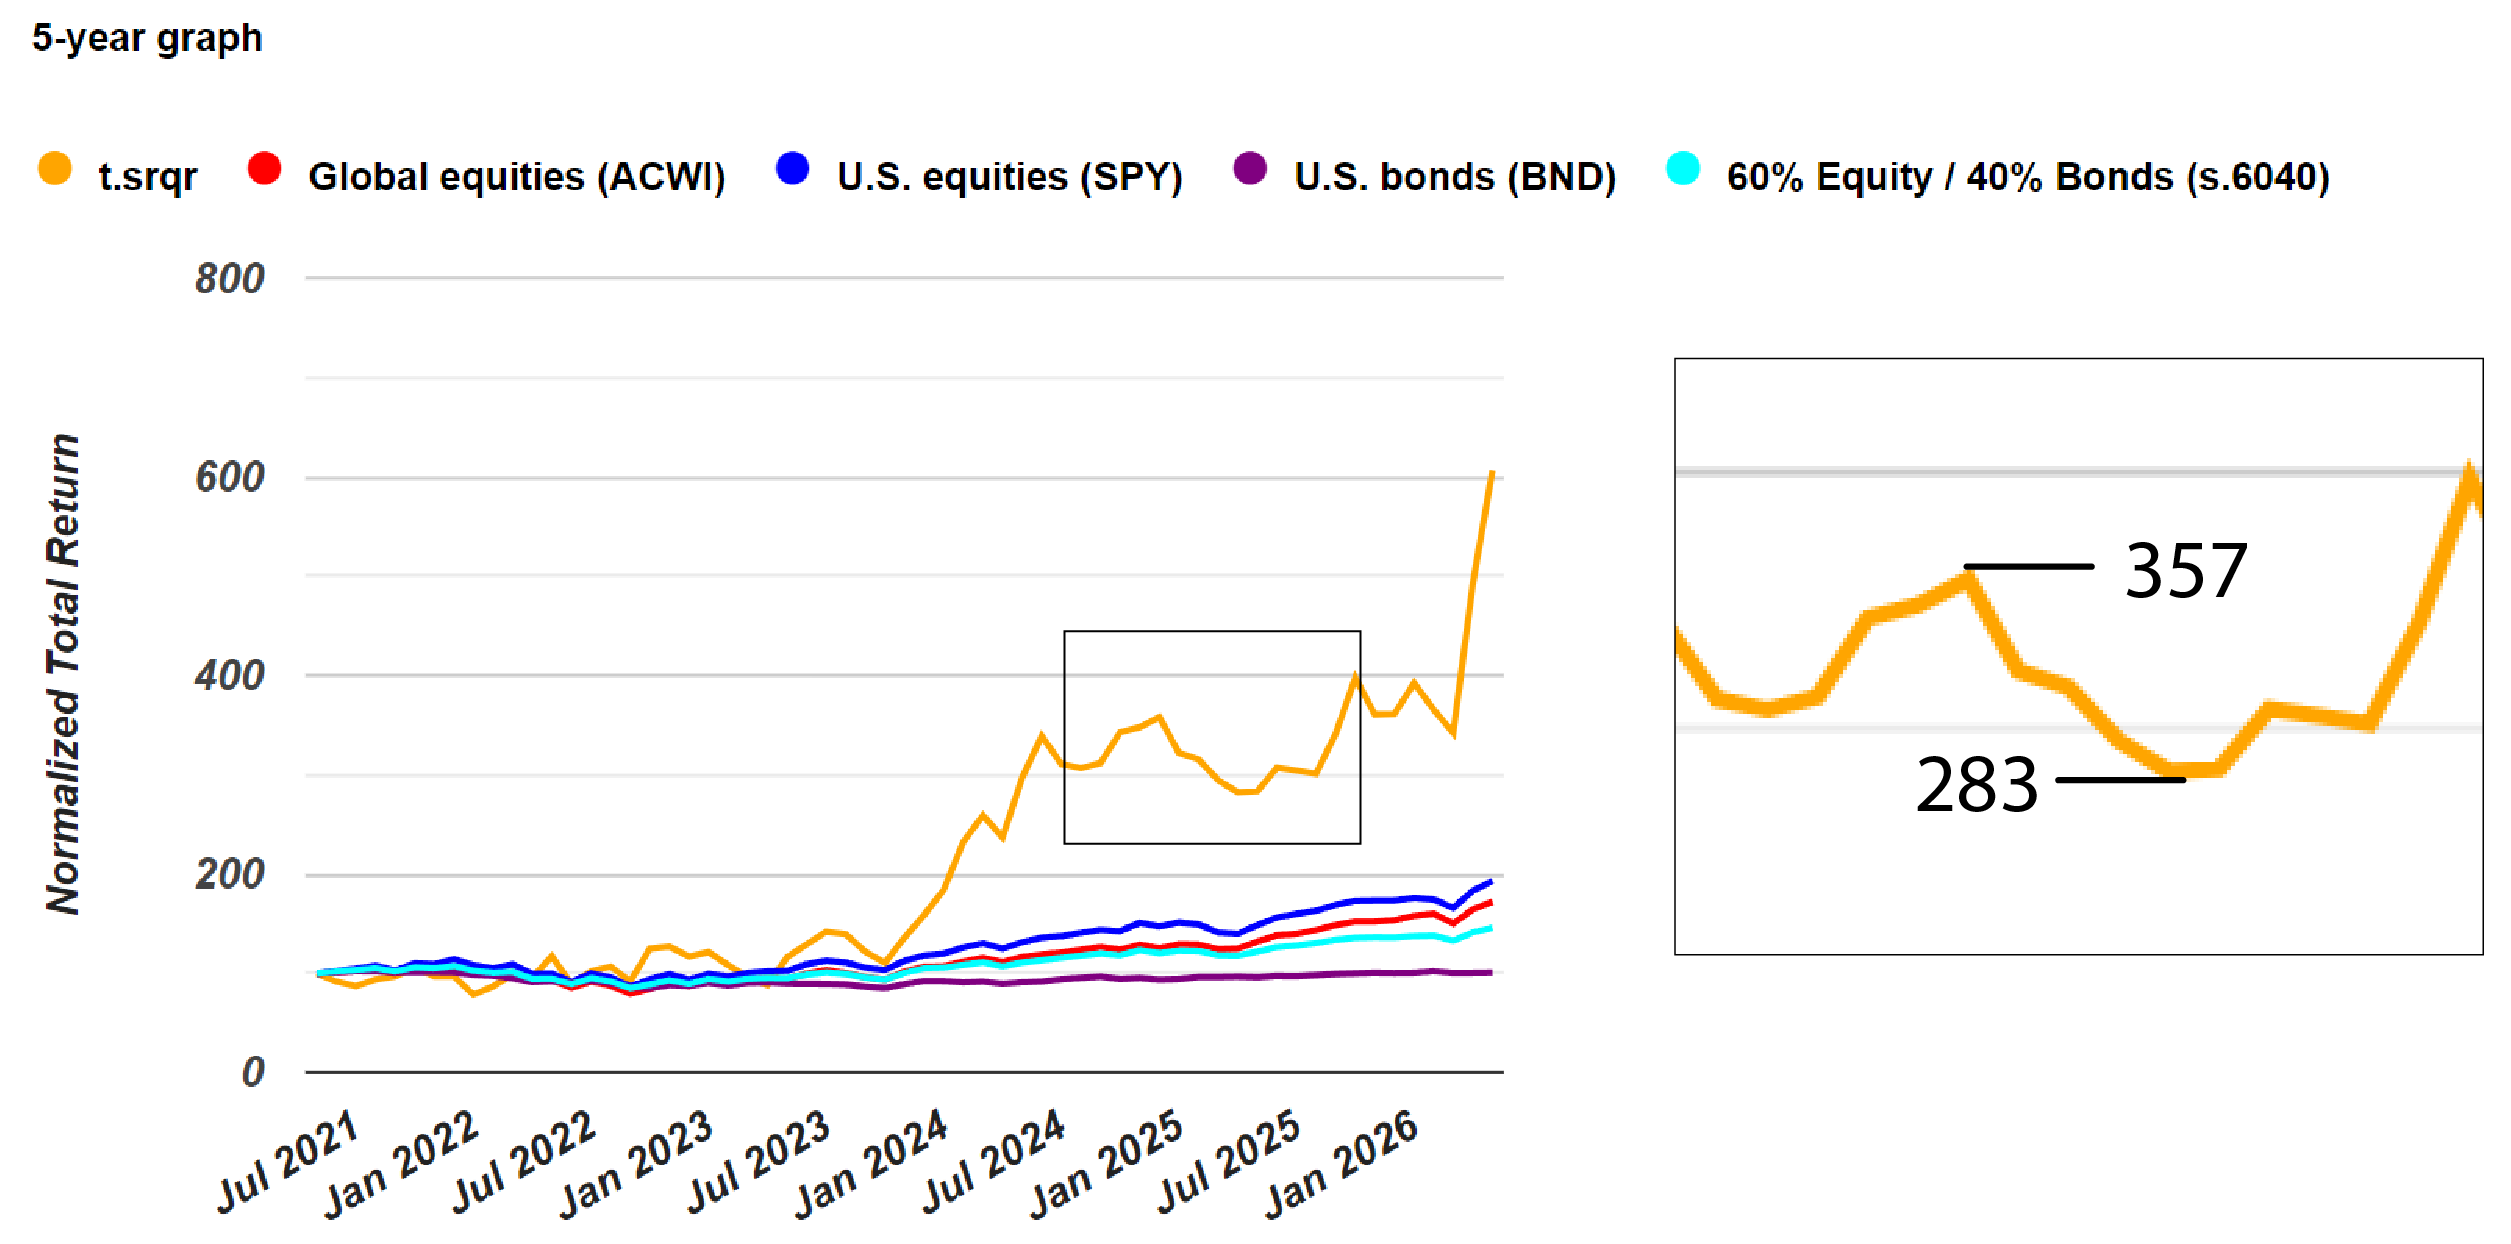
However, this is clearly a higher-risk, higher-return portfolio recipe. The strategy has experienced meaningful drawdowns over time. For example, the normalized price chart shows a decline from about 357 to 283, which is not insignificant. Over the past 20 years, the maximum drawdown has been about 50.7%. Despite that drawdown, the return profile is unusually strong. On a 20-year basis, the strategy has produced about 22.8% annualized return with a 23% downside deviation. That places it in the high-risk, high-return category. An investor who can tolerate the volatility may have the potential to capture some of those returns, but the risk level is substantial.
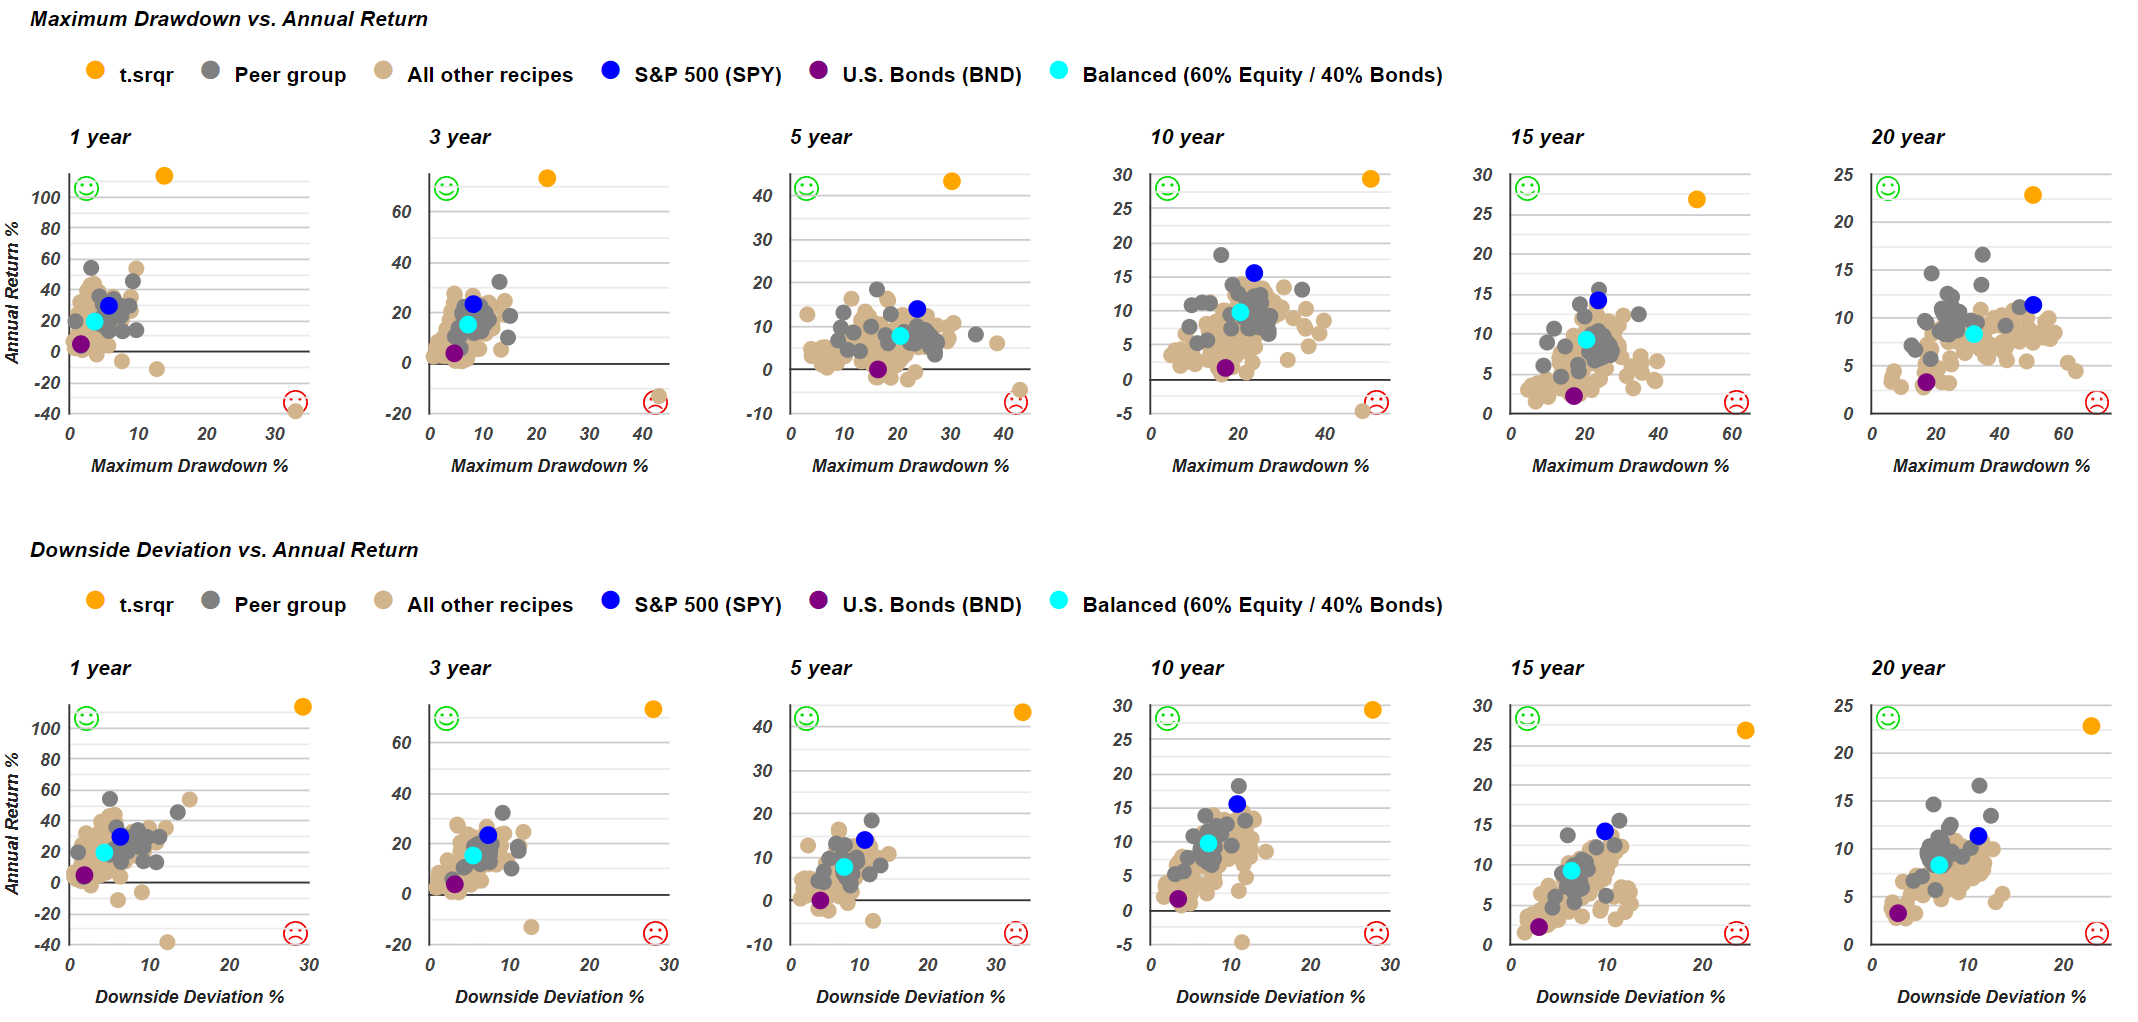
The scatterplot analysis also shows why this is not a simple, risk-free win. While the returns are very high, the strategy is not clearly positioned above and to the left of a balanced portfolio or the S&P 500. That upper-left area is the ideal position because it represents higher return with lower risk than a benchmark. There are other portfolio recipes that may offer a more balanced risk and return profile. Examples include t.aaaf and t.pure, along with several adaptive asset allocation portfolios. These strategies tend to be better positioned for investors who want the possibility of strong returns with lower risk than the S&P 500 over time.
Key Takeaways on Sector Rotation
This review has shown that sector rotation funds can produce a wide range of results, even when they are built around a similar idea. What makes this especially interesting is that these strategies all use some form of sector rotation. Most likely, they rely on momentum or recent performance to decide which sectors to hold. However, there are still major differences across the group, including:
- How often the portfolio rebalances
- How many funds it holds at one time
- Which lookback period it uses
- What selection criteria it follows
- How transparent the strategy is about its process
Some funds, such as mutual funds, can be more opaque. They may not explain exactly how selections are made, although they do report current holdings and historical performance. From there, investors have to evaluate whether the results justify the approach.
NAVFX has not produced especially strong numbers overall, although it has performed better than t.srrs across several time periods. The First Trust Focus Five ETF (FV) appears stronger than NAVFX over most periods, especially over the past 10 years. FV may be the better all-in-one, professionally managed option for investors who prefer a more hands-off sector rotation solution.
For investors who are comfortable with do-it-yourself rebalancing, the Recipe Investing portfolio recipes may offer the potential for higher returns based on the same sector rotation concept. These recipes can be implemented through brokerages such as M1 Finance or Interactive Brokers, which are recommended because they allow percentage-based rebalancing.
This review provides a useful look at the sector rotation recipes and portfolio strategies tracked at RecipeInvesting.com. Sector rotation can be powerful, but the results vary widely depending on the method, holdings, rebalancing rules, and risk profile.