
2026 Lazy Portfolios Performance, Drawdowns, and Risk-Adjusted Returns
Lazy Portfolios Performance Analysis: Returns, Drawdowns, and Risk-Adjusted Results
January 2026
Topics this month
- Understanding the Origins and Design of Lazy Portfolios
- A closer look at the Lazy: Second Grader portfolio (s.seco)
- How lazy portfolios stack up against benchmarks like the S&P 500 and a Balanced 60/40 portfolio
- Risk-adjusted analysis through the Alpha, Risk vs. Return Compass, and Sortino Ratio
Welcome to the January 2026 edition of the RecipeInvesting.com commentary. In this month’s commentary, the focus turns to a closer examination of a specific category of portfolio recipes: asset allocation models. Rather than providing a broad overview, this edition takes a more detailed approach, exploring how these models are constructed and why they play an important role in portfolio design.
Understanding the Origins and Design of Lazy Portfolios
Navigating the recipe summary page, an investor can view a complete list of the portfolio recipes, or asset allocation models, currently tracked. These recipes can be organized alphabetically, making it easier to scan through the full lineup. As the list is reviewed, a group of portfolios with a shared “lazy” in their name becomes apparent. Several strategies fall under this category, each carrying the same prefix. These are the portfolios that we want a closer look.

Many of these so-called lazy portfolios trace their origins to Paul Farrell’s well-known book, The Lazy Person’s Guide to Investing. The book introduced straightforward, long-term strategies such as the Couch Potato Portfolio, the No-Brainer approach, and the Coffee House Portfolio. Each emphasizes simplicity, diversification, and discipline rather than frequent trading or tactical shifts. Over time, most of these strategies have been incorporated into the system and are tracked using the exact asset allocations outlined in the original work. This allows for consistent, month-by-month performance measurement based on their intended design. By observing how these lazy portfolios have performed over the years, investors gain valuable insight into the long-term effectiveness of simple, rules-based allocation strategies.
A closer look at the Lazy: Second Grader portfolio (s.seco)
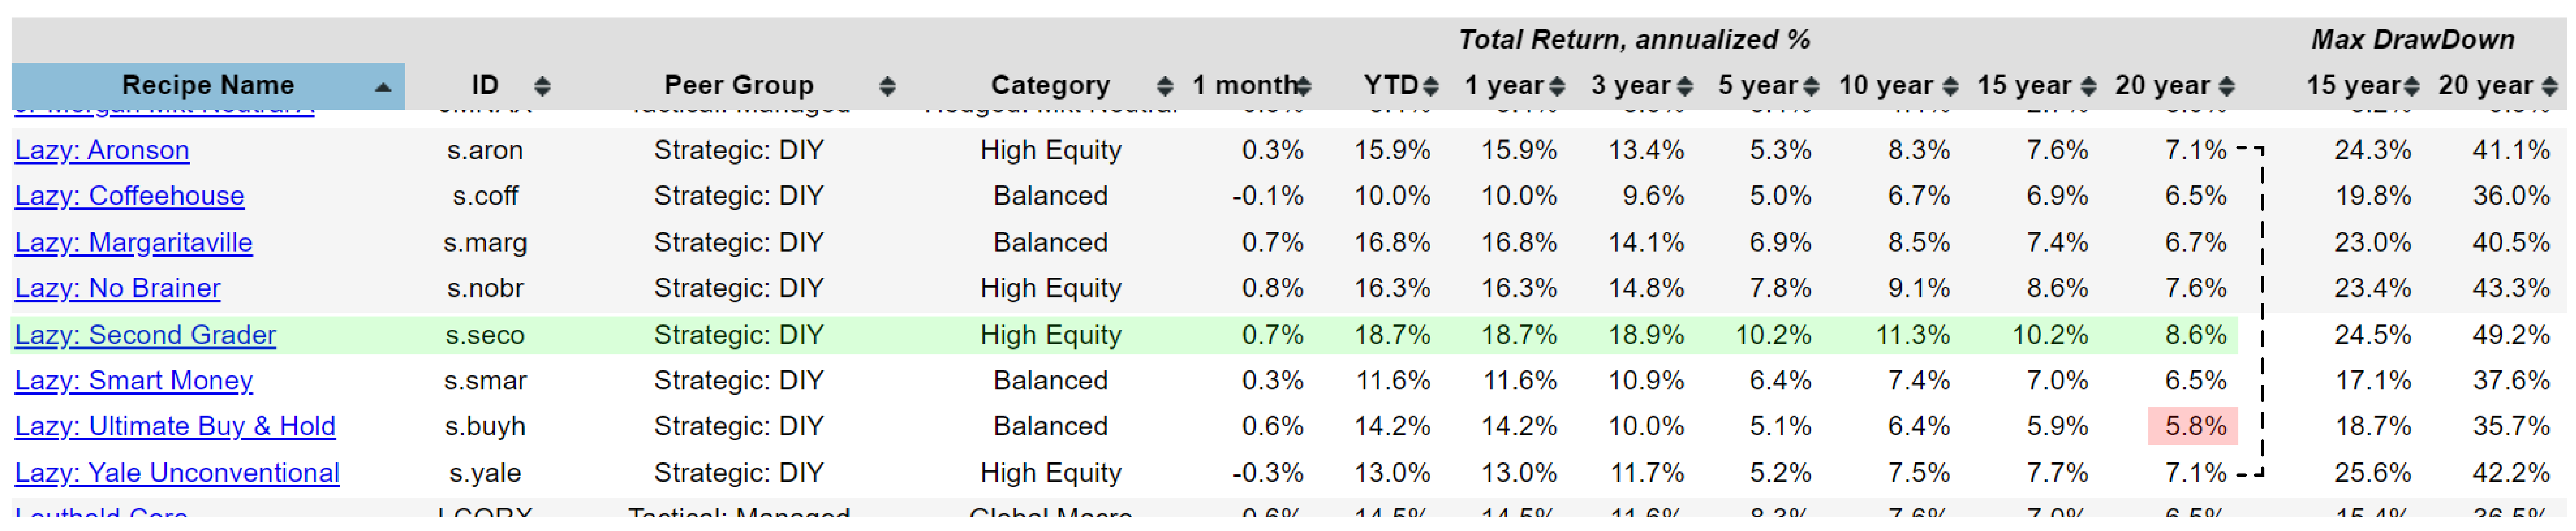
With that overview in place, the next step is to evaluate these portfolios using several key metrics. The starting point for this analysis is the recipe summary page, which provides a snapshot of total returns across the various strategies. One commonly used measure of risk is maximum drawdown over the past 15 to 20 years. Maximum drawdown represents the largest peak-to-trough decline a portfolio has experienced, measured at month-end. Because the analysis relies on month-end data, short-term intramonth volatility is not captured and may result in temporary drawdowns that are not reflected in these figures.
Turning specifically to the lazy portfolio group, there are eight portfolios in this category. When reviewing their long-term performance, several observations stand out:
- Over a 20-year period, annualized returns range from approximately 5.8% at the low end to 8.6% at the high end.
- While this appears to be a relatively narrow band, the roughly 3% spread compounds into a meaningful difference over two decades.
A closer look highlights the trade-off between return and risk:
- Lazy: Ultimate Buy & Hold (s.buyh) delivers a 5.8% annualized return over 20 years with a maximum drawdown of 35%.
- Lazy: Second Grader (s.seco), the highest-returning portfolio in the group, achieves an 8.6% annualized return but experiences a significantly deeper drawdown of 49.2%.

Recent performance adds further context. The Second Grader portfolio has produced roughly 10% annualized returns over the past 15 years, and approximately 18.7% over the most recent year. From a return perspective alone, these results appear compelling. However, risk remains a critical consideration. A drawdown approaching 50% is broadly comparable to what the S&P 500, as represented by the SPDR S&P 500 ETF (SPY), experienced over the same 20-year period. On this metric, the strongest-performing lazy portfolio does not appear to offer meaningfully lower risk or volatility than the equity benchmark. This represents an important early takeaway for investors: while certain lazy portfolios can deliver attractive long-term returns, they may not necessarily provide a smoother or less volatile experience than a traditional stock-market benchmark.
Risk-adjusted analysis through Alpha
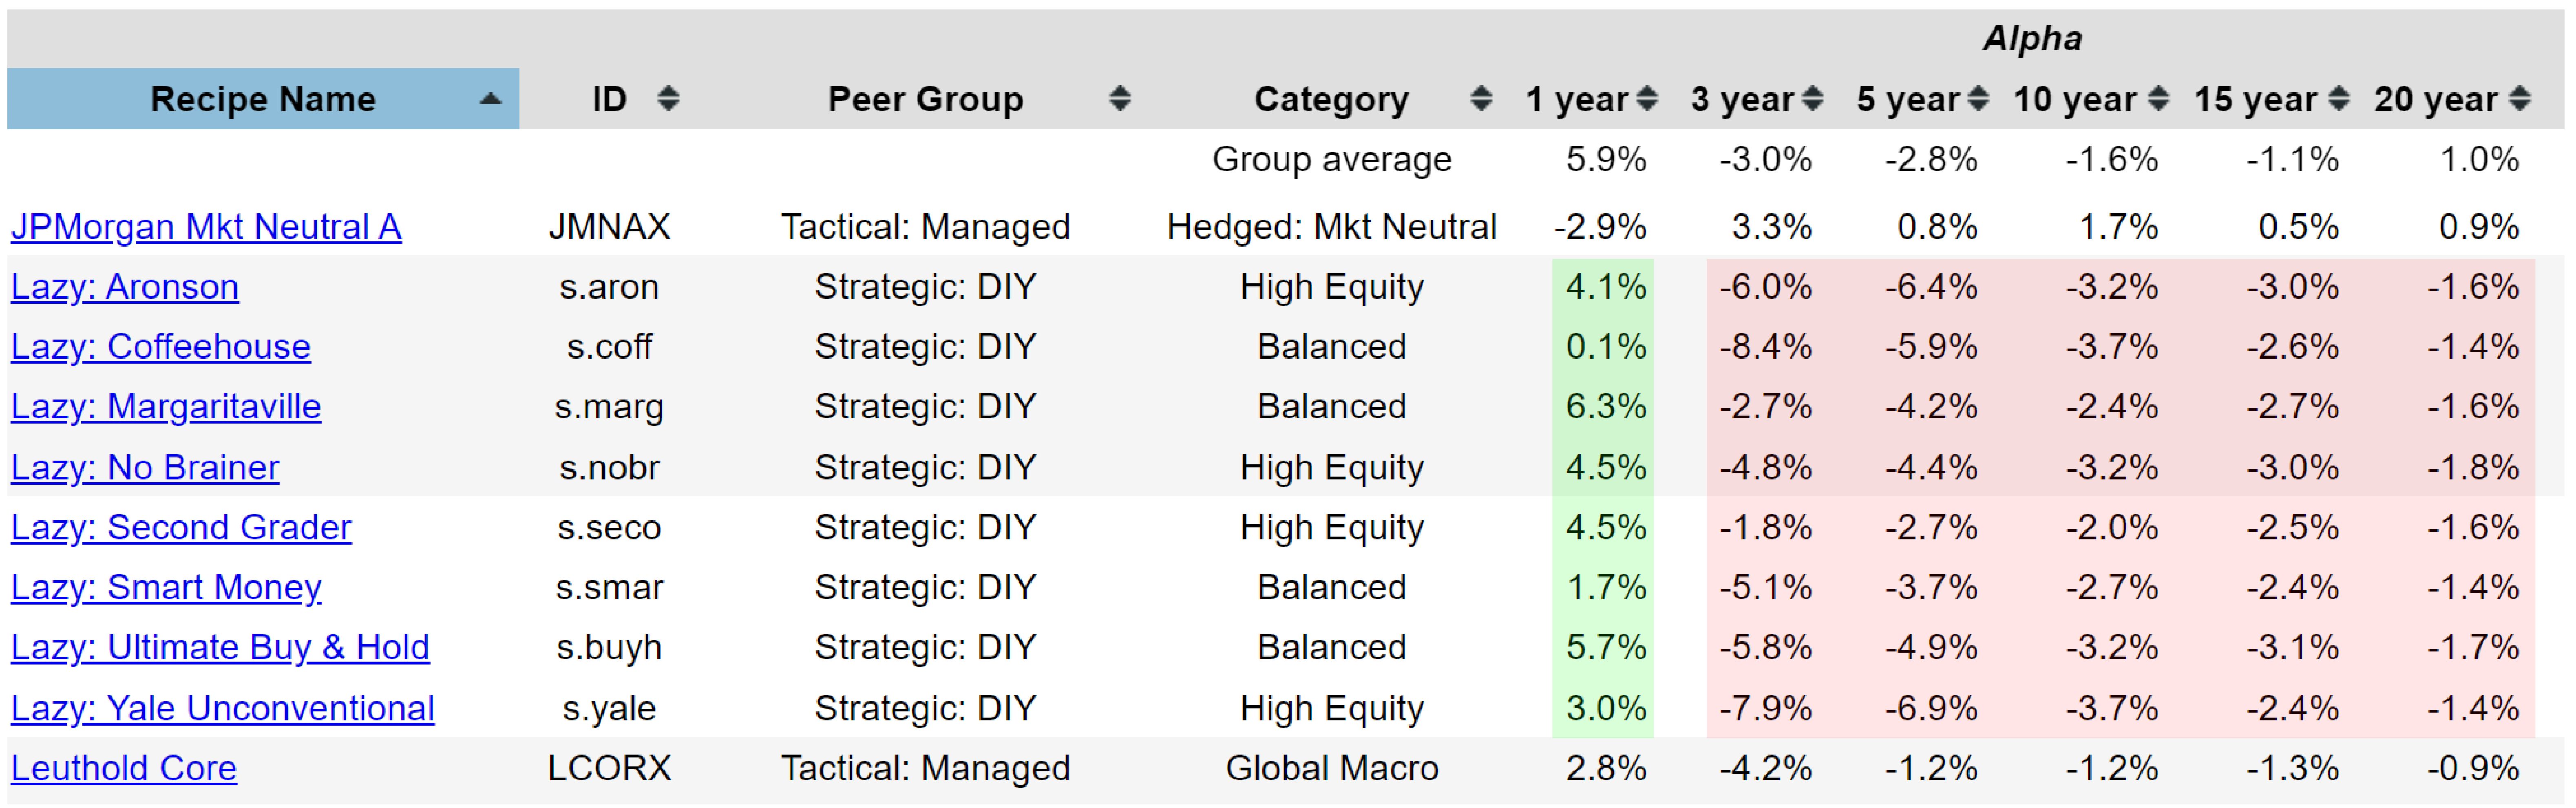
With an initial pass complete, the next step is to examine additional metrics that can help compare these lazy portfolios. One particularly useful measure is alpha, which represents the excess return generated beyond what would be expected from market exposure alone, excluding the risk-free rate. In simple terms, alpha measures how much additional return a portfolio delivers relative to a straightforward benchmark for the level of risk taken. Positive alpha suggests value added through portfolio construction, while negative alpha indicates underperformance given the risk assumed.
When reviewing the lazy portfolios through this lens, several observations stand out:
- Alpha is negative for nearly all of the portfolios across most time horizons.
- This suggests that, relative to the risk these portfolios take on, investors are not being adequately compensated with higher returns.
- While performance over the most recent year shows some instances of positive alpha, this appears to be short-term and not persistent.
Looking across longer periods, from 3 years through 20 years, none of the lazy portfolios exhibit positive alpha. This lack of consistency is notable and difficult to ignore. Over extended time frames, these strategies have not demonstrated an ability to outperform a simple benchmark on a risk-adjusted basis. Taken together, this represents a significant critique of the lazy portfolio approach. Based on this measure, their long-term performance has failed to generate meaningful alpha, calling into question their effectiveness for investors seeking returns above what broad market exposure alone can provide.
Risk-adjusted analysis through Risk vs. Return Compass
In addition to traditional risk and return statistics, there are other tools that help place portfolio performance into clearer context. One such tool is the Risk vs. Return Compass, which evaluates each portfolio recipe over a given time period by positioning it within a four-quadrant framework. At the center of this framework is the Balanced 60/40 (s.6040) portfolio, which serves as the benchmark. The horizontal axis reflects portfolio risk, measured using downside deviation, while the vertical axis represents return. Together, these dimensions allow each portfolio to be evaluated relative to the benchmark rather than in isolation.
The four quadrants provide an intuitive interpretation:
- Green (Top Left): Higher return and lower risk than the 60/40 benchmark.
- Yellow: Higher return but also higher risk than the benchmark, suggesting a potential trade-off that warrants closer inspection.
- Red: Lower return and higher risk than the benchmark, representing the least favorable outcome.
To illustrate, the 7Twelve Israelson (s.712) portfolio, when measured over the past year, falls into the green quadrant. It delivered higher returns while maintaining lower volatility than the Balanced 60/40 portfolio, earning it a favorable risk–return profile. Applying this framework to the group of lazy portfolios reveals a stark contrast.
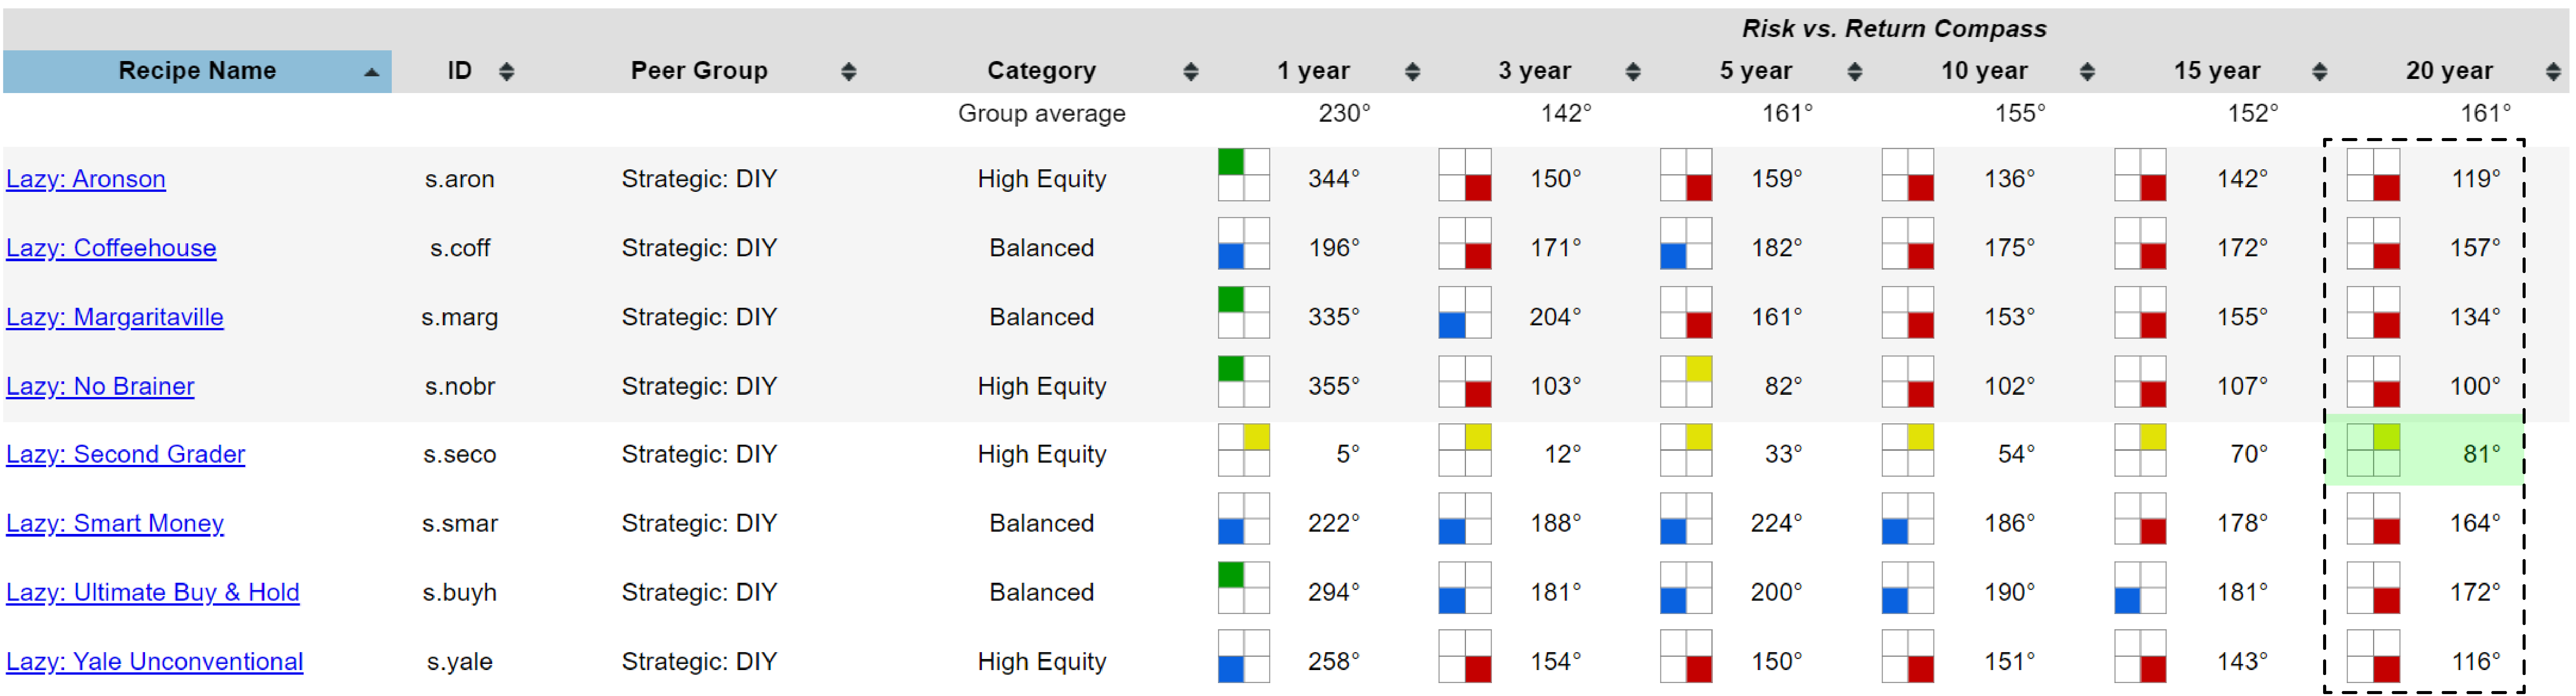
When viewed over a 20-year period, only one lazy portfolio achieved higher returns than the benchmark, albeit with higher risk, placing it in the yellow quadrant and all remaining lazy portfolios experienced both lower returns and higher risk relative to the Balanced 60/40 portfolio, resulting in placement within the red quadrant. From this long-term perspective, the majority of lazy portfolios have not demonstrated an advantage in either risk reduction or return enhancement when compared with a simple 60/40 allocation. As visualized by the Risk vs. Return Compass, these strategies have struggled to compete with the benchmark on a risk-adjusted basis over extended periods.
Risk-adjusted analysis through Sortino Ratio
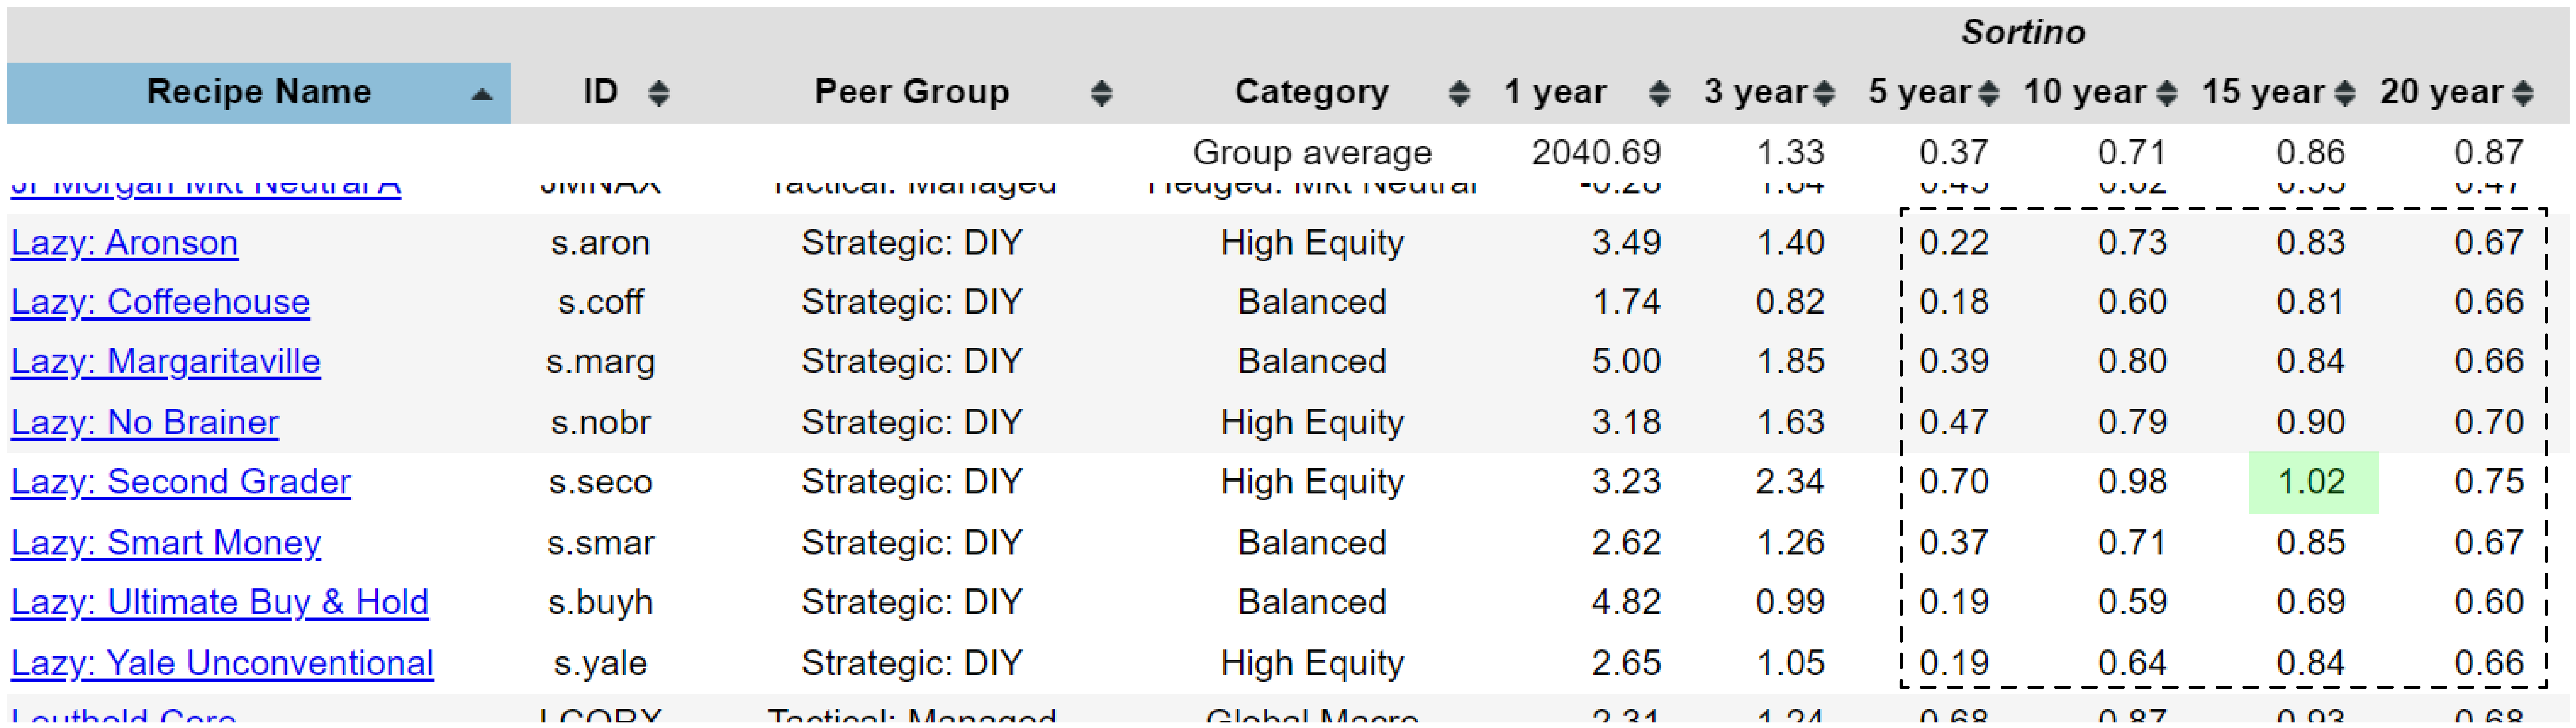
Another useful metric for evaluating risk-adjusted performance is the Sortino Ratio. This measure compares a portfolio’s return to its downside risk relative to a benchmark, in this case the S&P 500. The central question it addresses is whether an investor is being adequately compensated for the risk taken, or whether similar or better results could have been achieved by simply holding a broad market portfolio. Applied to the group of lazy portfolios, several patterns emerge. A sortino ratio above 1.0 indicates that a portfolio has delivered more return per unit of downside risk than the benchmark, while a value below 1.0 suggests underperformance on a risk-adjusted basis.
The results can be summarized as follows:
- Over the most recent 3-year period, several lazy portfolios show stronger sortino ratios, reflecting a generally favorable market environment.
- Over longer horizons, from 5 to 20 years, nearly all of the lazy portfolios post sortino ratios below 1.0, indicating weaker risk-adjusted performance relative to the S&P 500.
- The Lazy: Second Grader portfolio stands out modestly over the 15-year period, where it shows some relative advantage.
- However, over the full 20-year timeframe, even this portfolio’s sortino ratio declines to approximately 0.75, falling well below the benchmark threshold.
Taken together, these results suggest a consistent pattern of weakness among the lazy portfolios when evaluated through the lens of downside-risk efficiency. While short-term performance has at times been favorable, longer-term data indicates that these strategies have struggled to deliver sufficient return for the level of risk assumed.
To conclude the analysis, it is useful to take a closer look at the Lazy: Second Grader portfolio, examining its performance in greater detail. This portfolio has been highlighted throughout the discussion as the strongest performer within the lazy portfolio group, making it a logical candidate for deeper review alongside commonly used benchmarks. Focusing on the 20-year period, the risk-versus-return relationship can be evaluated across several metrics, including downside deviation. Across the broader set of portfolios, annualized returns over this horizon range from near zero to as high as 20%. A handful of strategies, such as t.aaaf and t.pure, have achieved returns closer to 15%, placing them at the higher end of the spectrum.
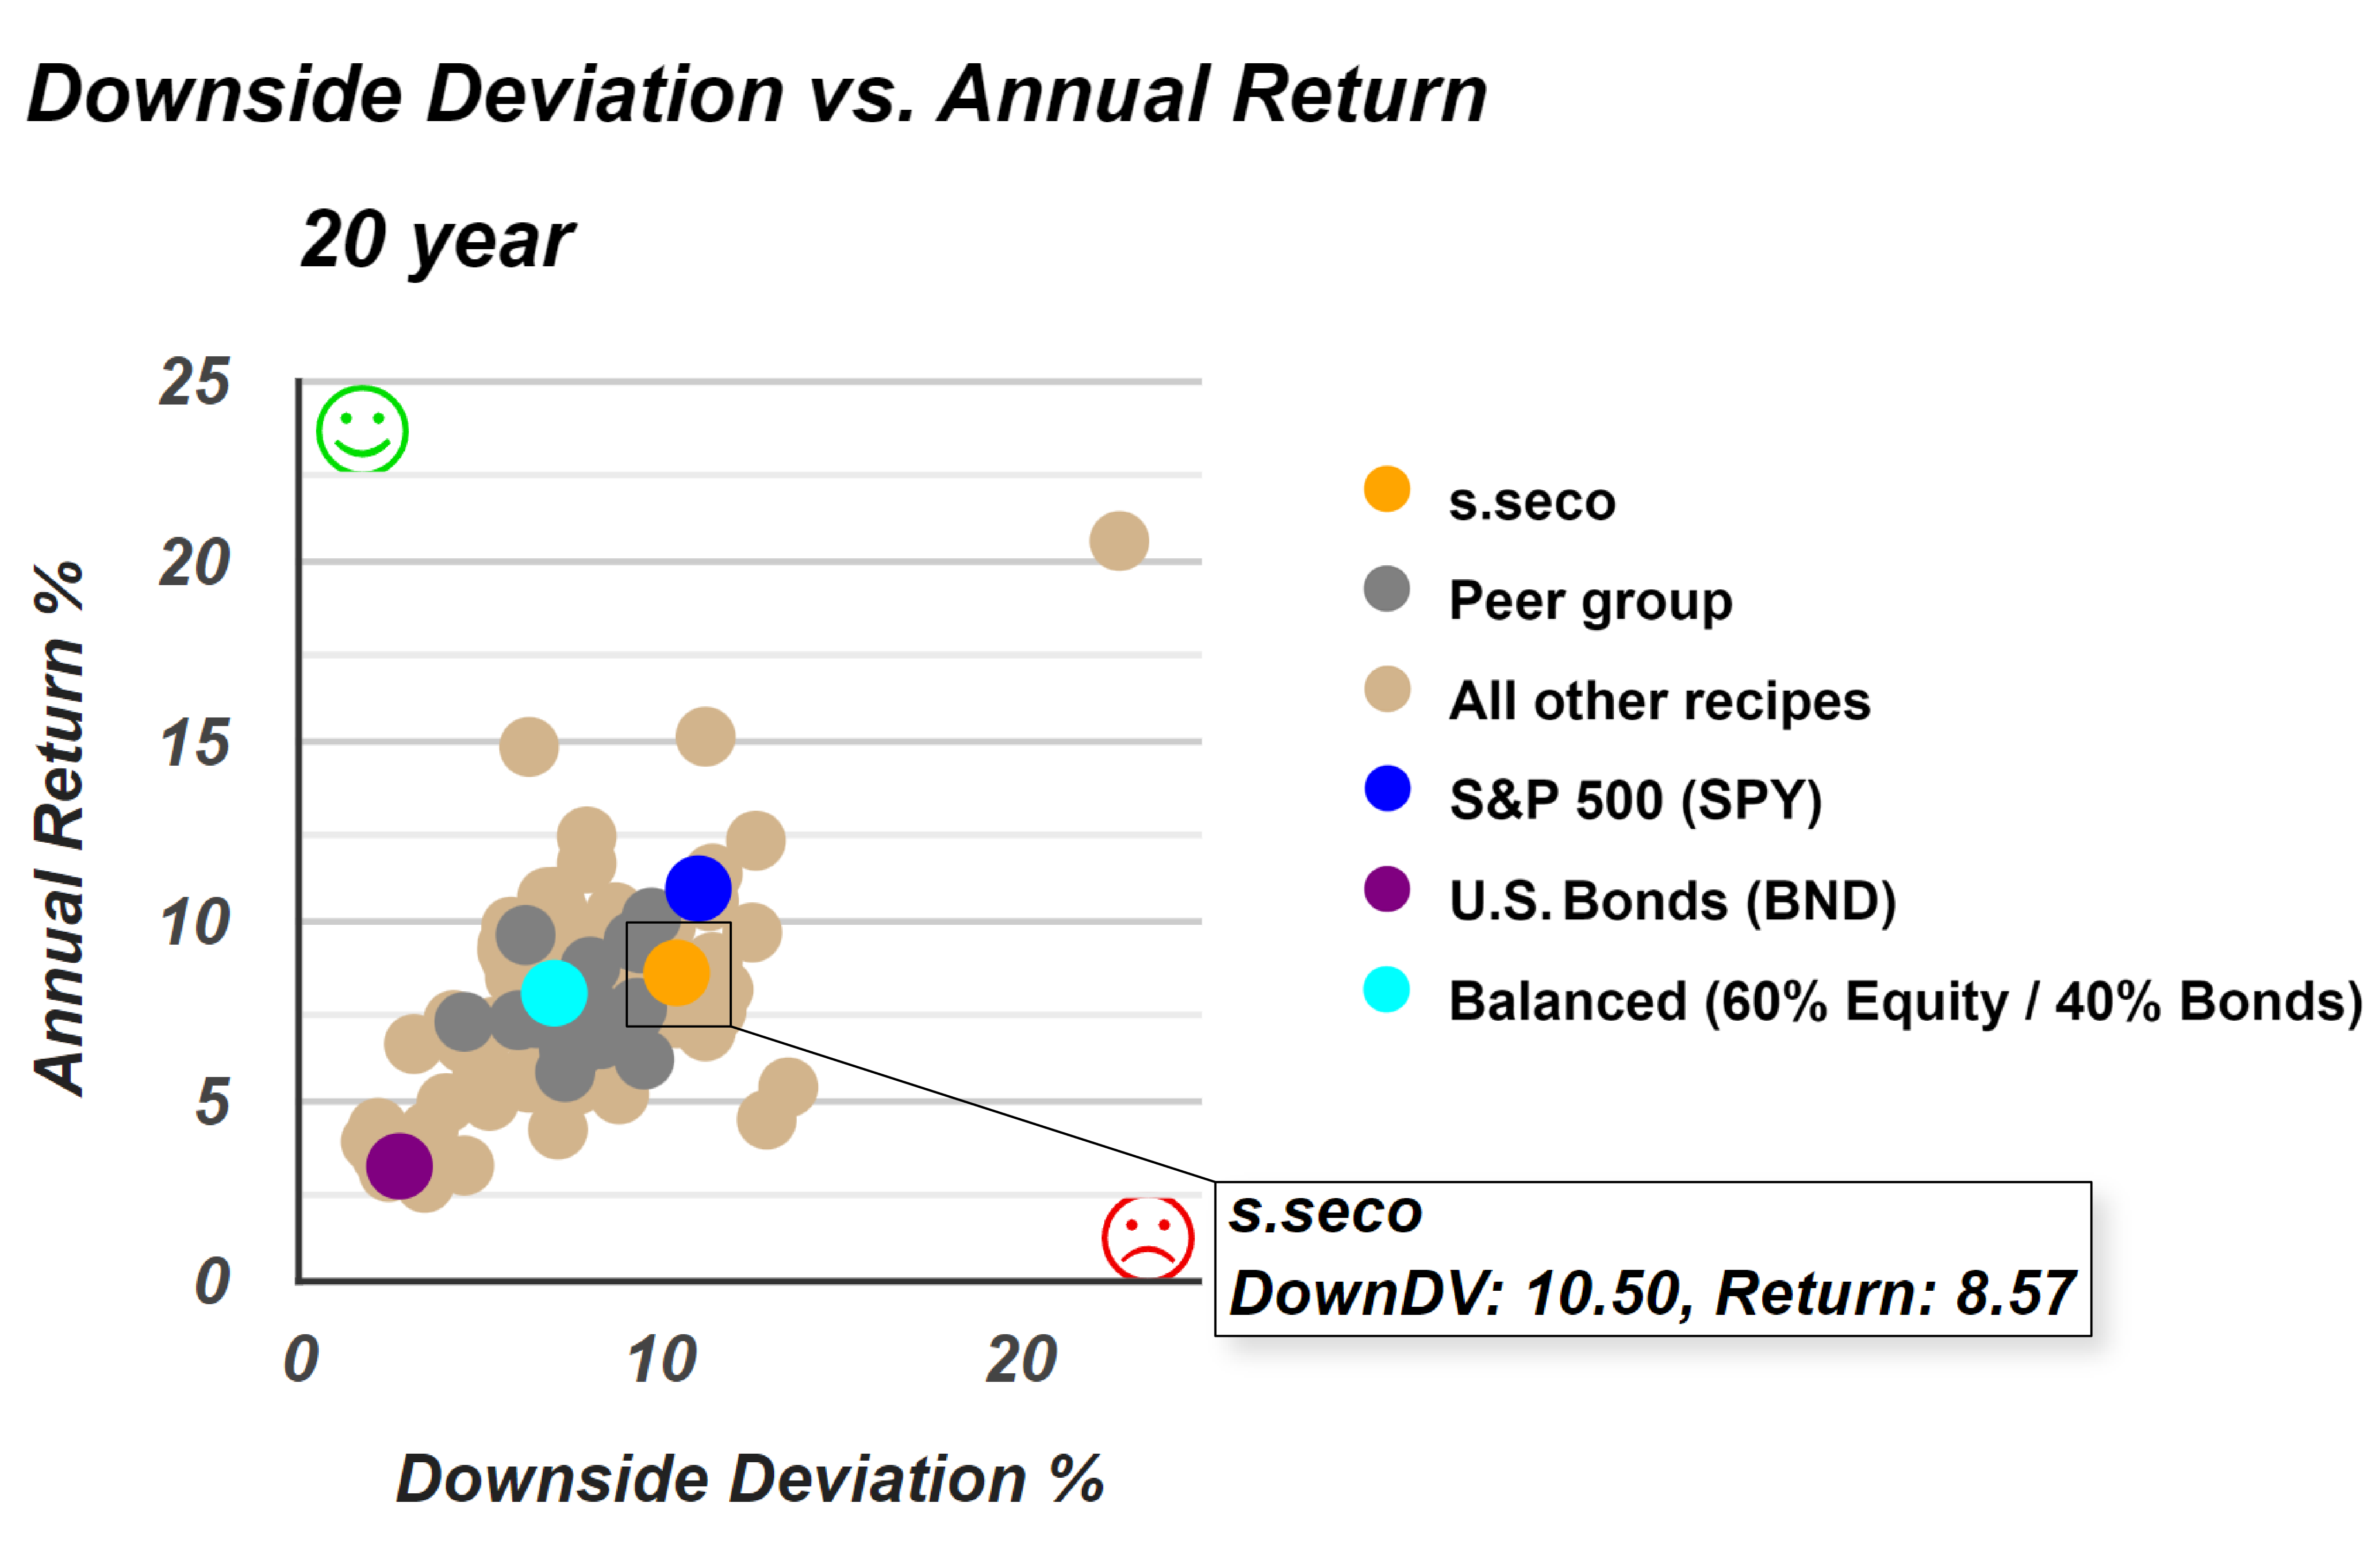
The Lazy: Second Grader portfolio posts an annualized return of approximately 8.57% over the past 20 years. While this result is respectable in absolute terms, its relative positioning is more revealing. When compared with several benchmark portfolios:
- The S&P 500 portfolio delivers higher returns with only a modest increase in risk.
- The Balanced 60/40 portfolio achieves meaningfully lower risk with only a slight reduction in return.
- A pure U.S. Bonds portfolio also offers a more favorable risk profile, albeit with lower returns.
Taken together, this closer examination suggests that even the strongest lazy portfolio does not occupy a particularly efficient position along the risk–return frontier. Investors can find alternatives that either deliver higher returns for comparable risk or meaningfully reduce risk without sacrificing much return.
One important point to keep in mind when evaluating the performance of lazy portfolios is that, while they may at times deliver higher returns than a benchmark, they often do so by assuming higher levels of risk. These portfolios do not consistently outperform in both dimensions over long periods. By design, lazy portfolios rely on static asset allocations. They are intended to be “set it and forget it” strategies, typically requiring only periodic rebalancing, such as on a quarterly or annual basis. For example, the Lazy: Second Grader portfolio maintains a fixed allocation across three funds, with predetermined weights assigned to each. This structure simplifies portfolio management and reduces the need for frequent adjustments.
However, simplicity should not be mistaken for stability. Despite their passive nature, lazy portfolios are not inherently less volatile. The fact that rebalancing is infrequent does not guarantee capital preservation or reduced drawdowns. Over time, these static allocations can still experience significant fluctuations in value.