
iShares ETFs vs. a Simple 80/20 Portfolio: The 15-Year Results
iShares ETFs vs. a Simple 80/20 Portfolio: The 15-Year Results
July 2026
Topics this month
- A Closer Look at iShares Allocation ETFs: AOA, AOR, AOM & AOK
- AOA vs. RecipeInvesting’s 80/20 Portfolio: Which Performed Better?
- AOA vs. the S&P 500: Balancing Risk and Return
Welcome to the recipeinvesting.com commentary for July 2026. Logging in at go.recipeinvesting.com opens the investor's subscription, home to the portfolio recipes and results. This section includes all portfolio recipes, listed together in summary format and portfolio ingredients.
This month's commentary turns to a particular set of portfolio recipes. We place these under the category, or peer group, known as "Tactical: Managed". Narrowing the view to this category surfaces a distinct subset of our portfolio recipes:
- Mutual funds and exchange-traded funds (ETFs) managed by professionals
- Single tickers that investors can purchase through their preferred brokerage
These are not the strategic or tactical asset allocation portfolios we call portfolio recipes. We include them for comparison, since investors have a choice when they fly, as the saying goes. Our aim is to ensure investors can evaluate these professionally managed portfolios alongside the portfolio recipes we provide.
iShares Allocation ETFs: AOA, AOR, AOM & AOK
The ID column can be used to organize the list and focus on a specific group of exchange-traded funds. In this case, the emphasis is on four iShares ETFs with tickers that begin with “AO”: AOA, AOK, AOM, and AOR.
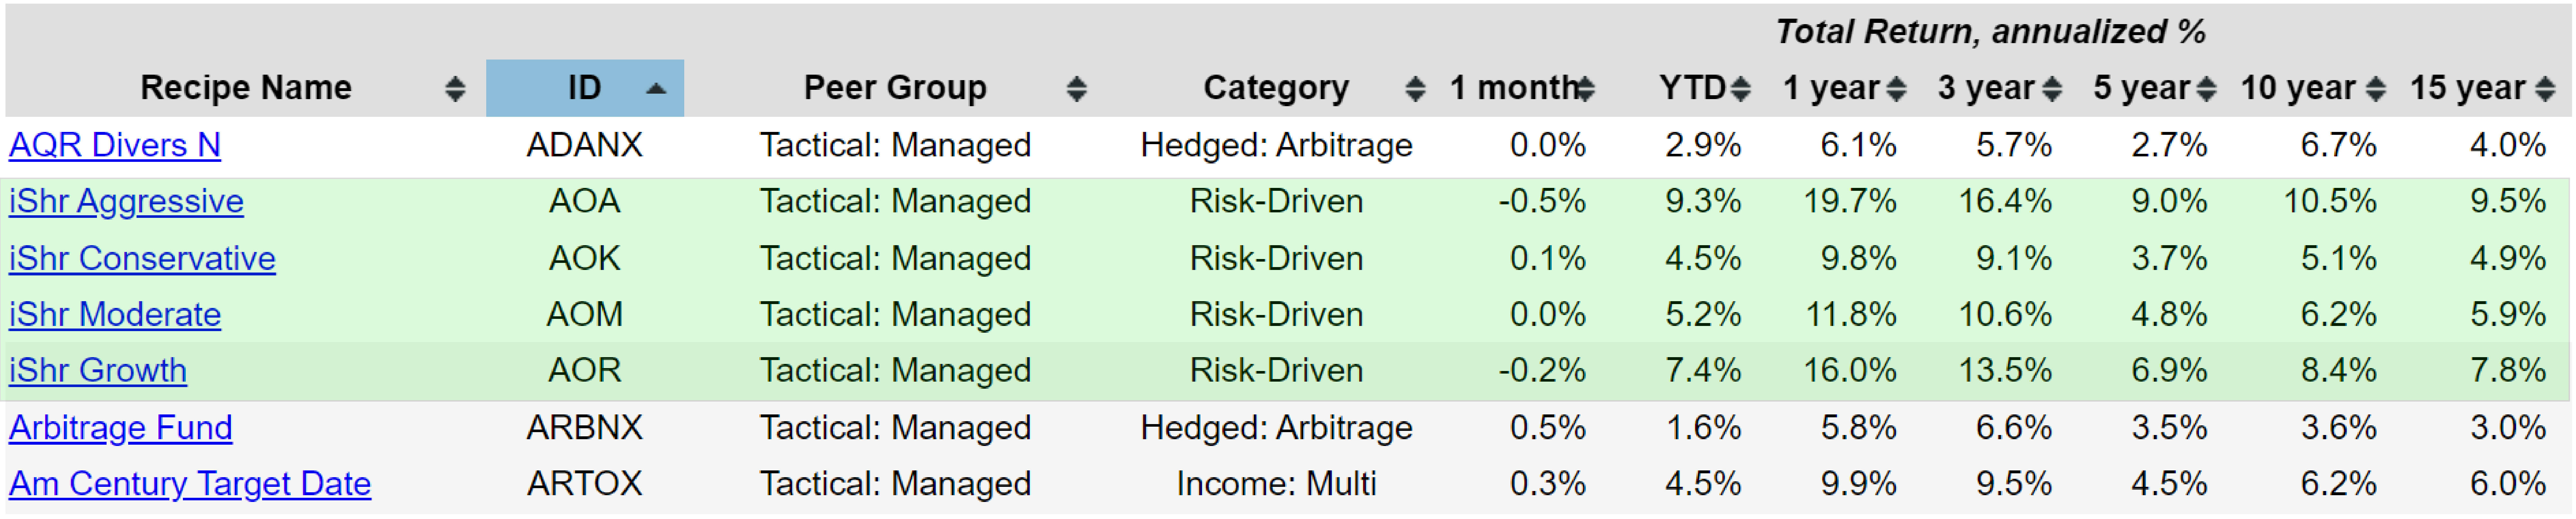
These funds are closely related and are designed to provide pre-built allocations between stocks and bonds. For example, AOA is an 80/20 aggressive allocation ETF. The appeal is its simplicity. By purchasing a single ticker, an investor gains exposure to one ETF that is allocated across several underlying holdings. In this case, it is spread across seven holdings.
How the Stock-and-Bond Allocations Differ
Because AOA is a fund of funds, it provides broad diversification across asset classes. The underlying mix includes:
- A bond fund
- The iShares S&P 500 ETF
- Mid-cap and small-cap exposure
- Emerging markets exposure
AOA maintains an 80% equity and 20% bond allocation, which aligns with its aggressive profile. With a larger emphasis on equities, an investor is typically taking on more day-to-day price movement in exchange for the potential for stronger long-term growth. The bond portion is intended to add some stability and income potential, but it plays a smaller supporting role in this mix.
In addition to AOA, iShares offers three other versions with different stock and bond allocations:
- AOR: 60% equity and 40% bonds, a classic balanced allocation
- AOM: 40% equity and 60% bonds, a more conservative mix
- AOK: 30% equity and 70% bonds, their conservative allocation
Across these four ETFs, an investor would generally expect a progression from higher risk and potentially higher returns in the more equity-heavy funds to lower risk and lower expected returns in the more bond-heavy funds. In practice, the equity-heavy options may experience larger swings during stock market declines, while the bond-heavy options may feel steadier but may also participate less in strong equity market rallies.
Risk and Return Across the Four ETFs
To see how these funds perform within the portfolio list, the tactical managed group can be revisited and sorted by ID or ticker. This conveniently brings the four “AO” ETFs to the top.
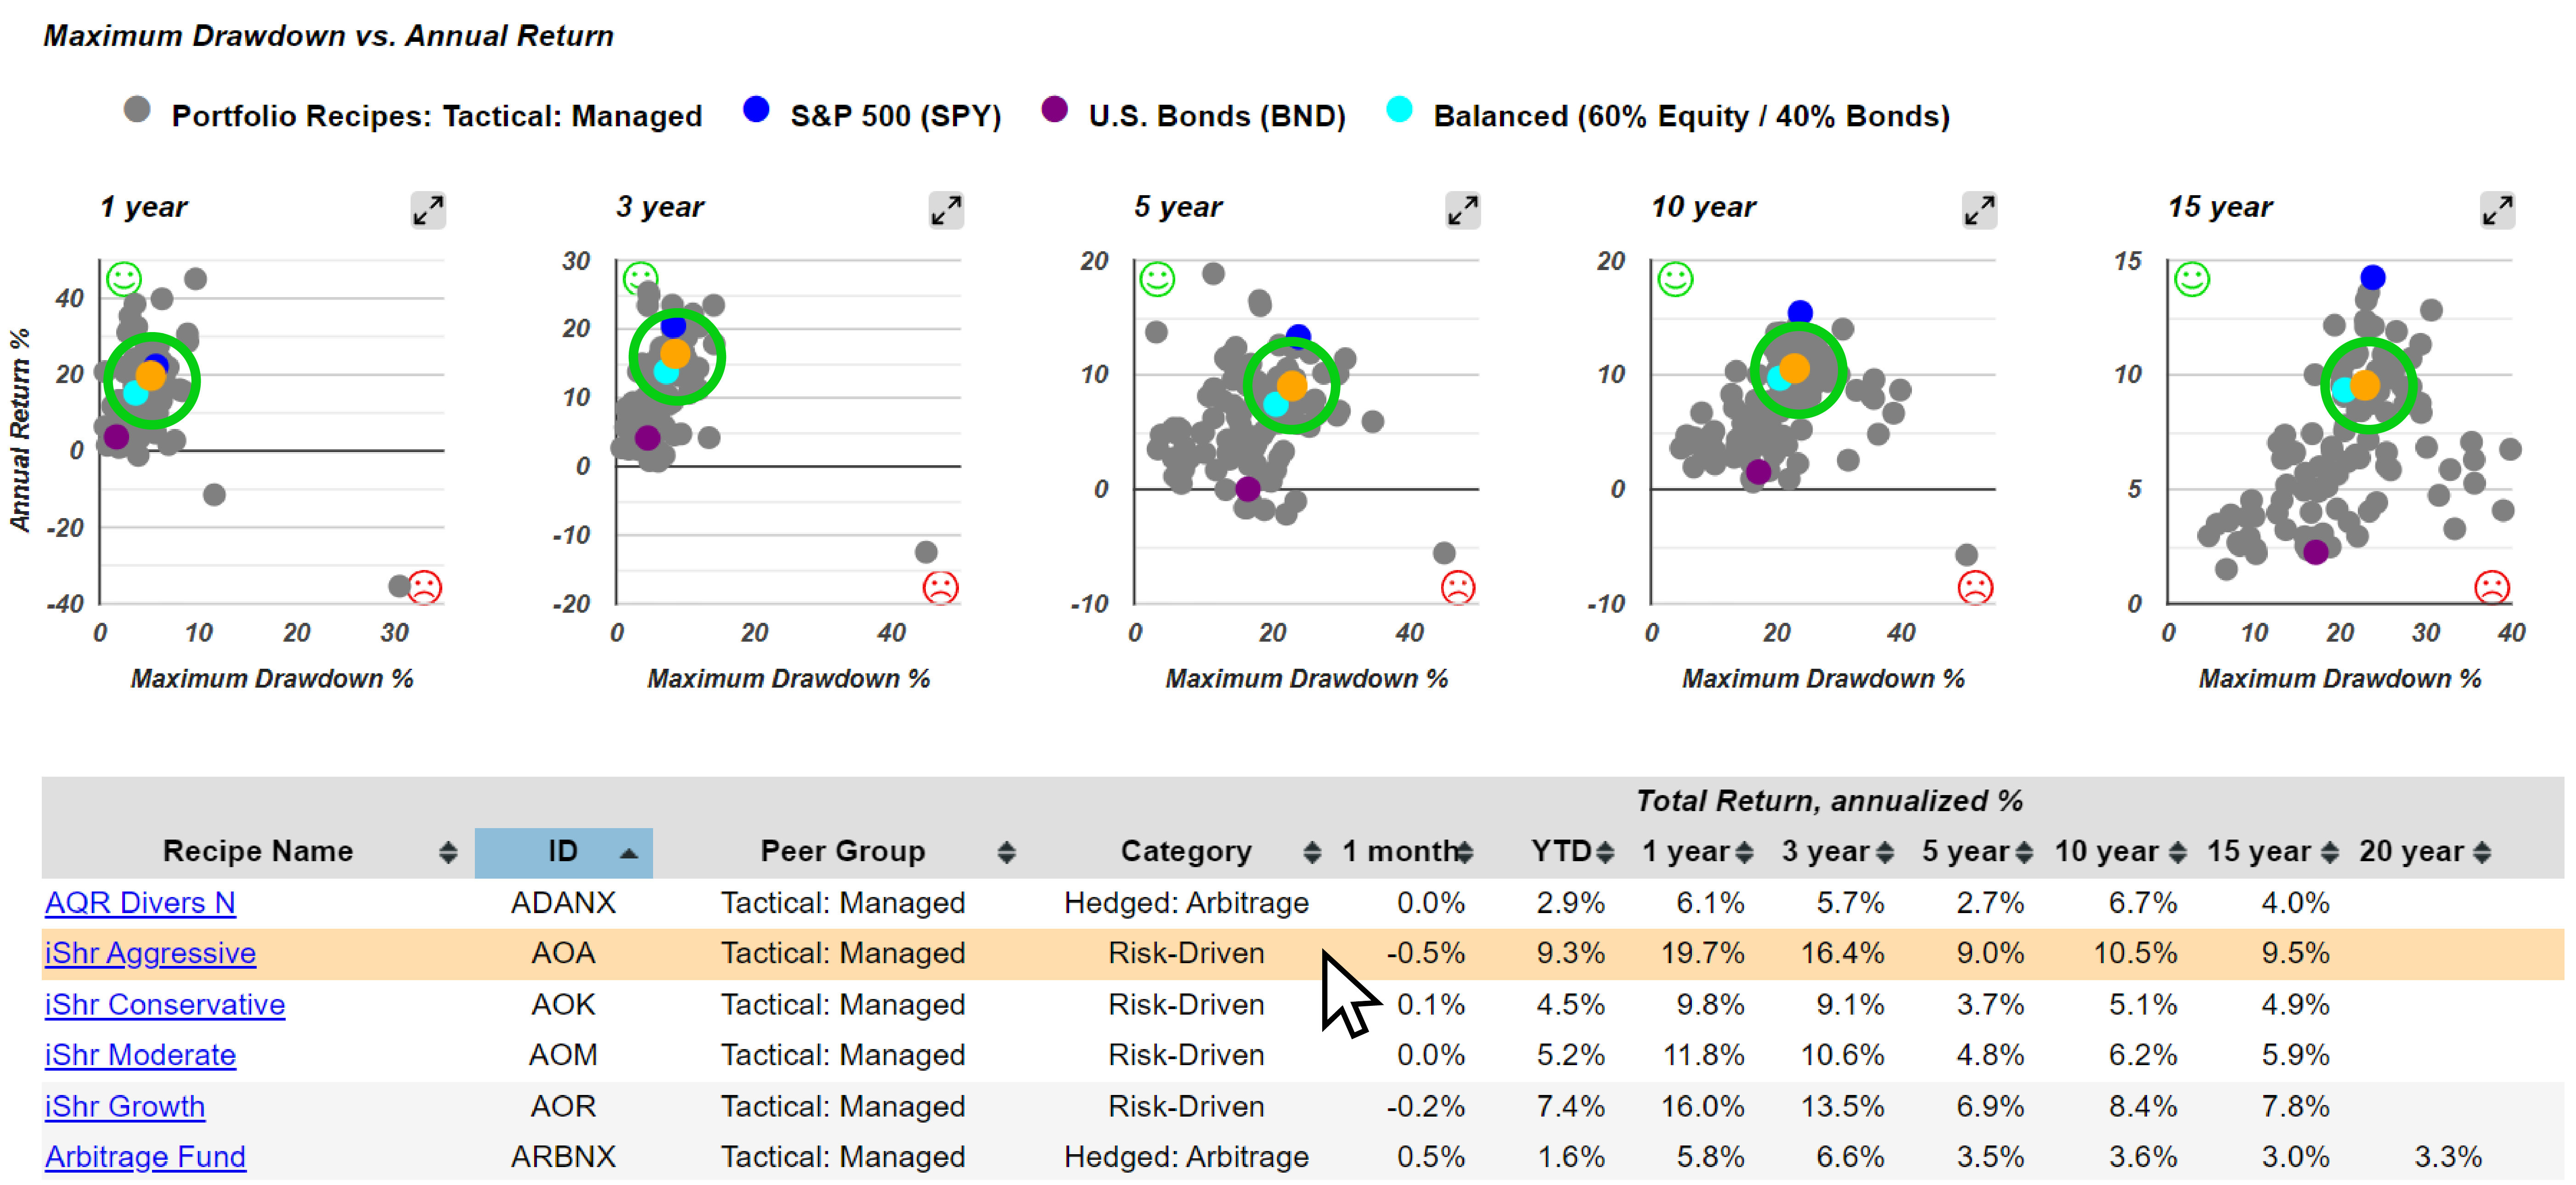
The table also includes a useful visual feature. When an investor hovers over a row, an orange dot appears on the scatter plots above. That orange dot corresponds to the highlighted fund in the summary table below, making it easy to see how each ETF compares on the risk versus return chart simply by moving between rows.
Looking at performance:
- AOA: On both the 1-year and 15-year views, AOA plots slightly above and to the right of the teal dot, which represents the 60/40 benchmark. This positioning suggests that AOA has delivered somewhat higher returns than the 60/40 reference point, while also taking on somewhat higher risk. In practical terms, an investor may see more upside potential relative to a balanced 60/40 mix, but with greater sensitivity to equity market swings.
- AOR (the 60/40 allocation): AOR tracks the teal dot fairly closely, which indicates it behaves much like a traditional balanced portfolio. However, on the 15-year view, it appears to show a slightly lower return than the teal benchmark. That gap suggests that, over the longer run, AOR’s realized performance has come in below the balanced portfolio constructed from two ETFs, despite having a similar overall stock and bond mix.
One notable takeaway is that the 60/40 AOR allocation has performed worse over the past 15 years than the Balanced 60/40 (s.6040) portfolio RecipeInvesting created by combining two ETFs. In other words, the professionally managed 60/40 option has lagged the two-ETF balanced approach in longer-term results.
15-Year Performance Results

The review can continue with these four exchange-traded funds and their performance. Based on total annualized return, the 15-year results follow a clear pattern:
- AOA has the highest 15-year annualized return at 9.5%.
- AOR comes next at 7.8%.
- AOM follows after that.
- AOK, the most conservative option, ranks last.
This matches the expected progression from highest return to lowest return as the allocations become more conservative.
Next, it is useful to look more closely at iShares AOA, the aggressive allocation ETF. As noted in its data sheet, AOA follows an 80/20 allocation between equities and bonds. The platform also provides detailed performance metrics for AOA across multiple time periods.
AOA vs. RecipeInvesting’s 80/20 Portfolio
A comparison becomes particularly interesting when AOA is lined up against a similar 80/20 allocation built as a portfolio recipe. RecipeInvesting’s Strategic 80/20 Portfolio (s.8020) is its own two-ETF 80/20 asset allocation model. Comparing the two side by side highlights where each has performed better.
Across several time periods:
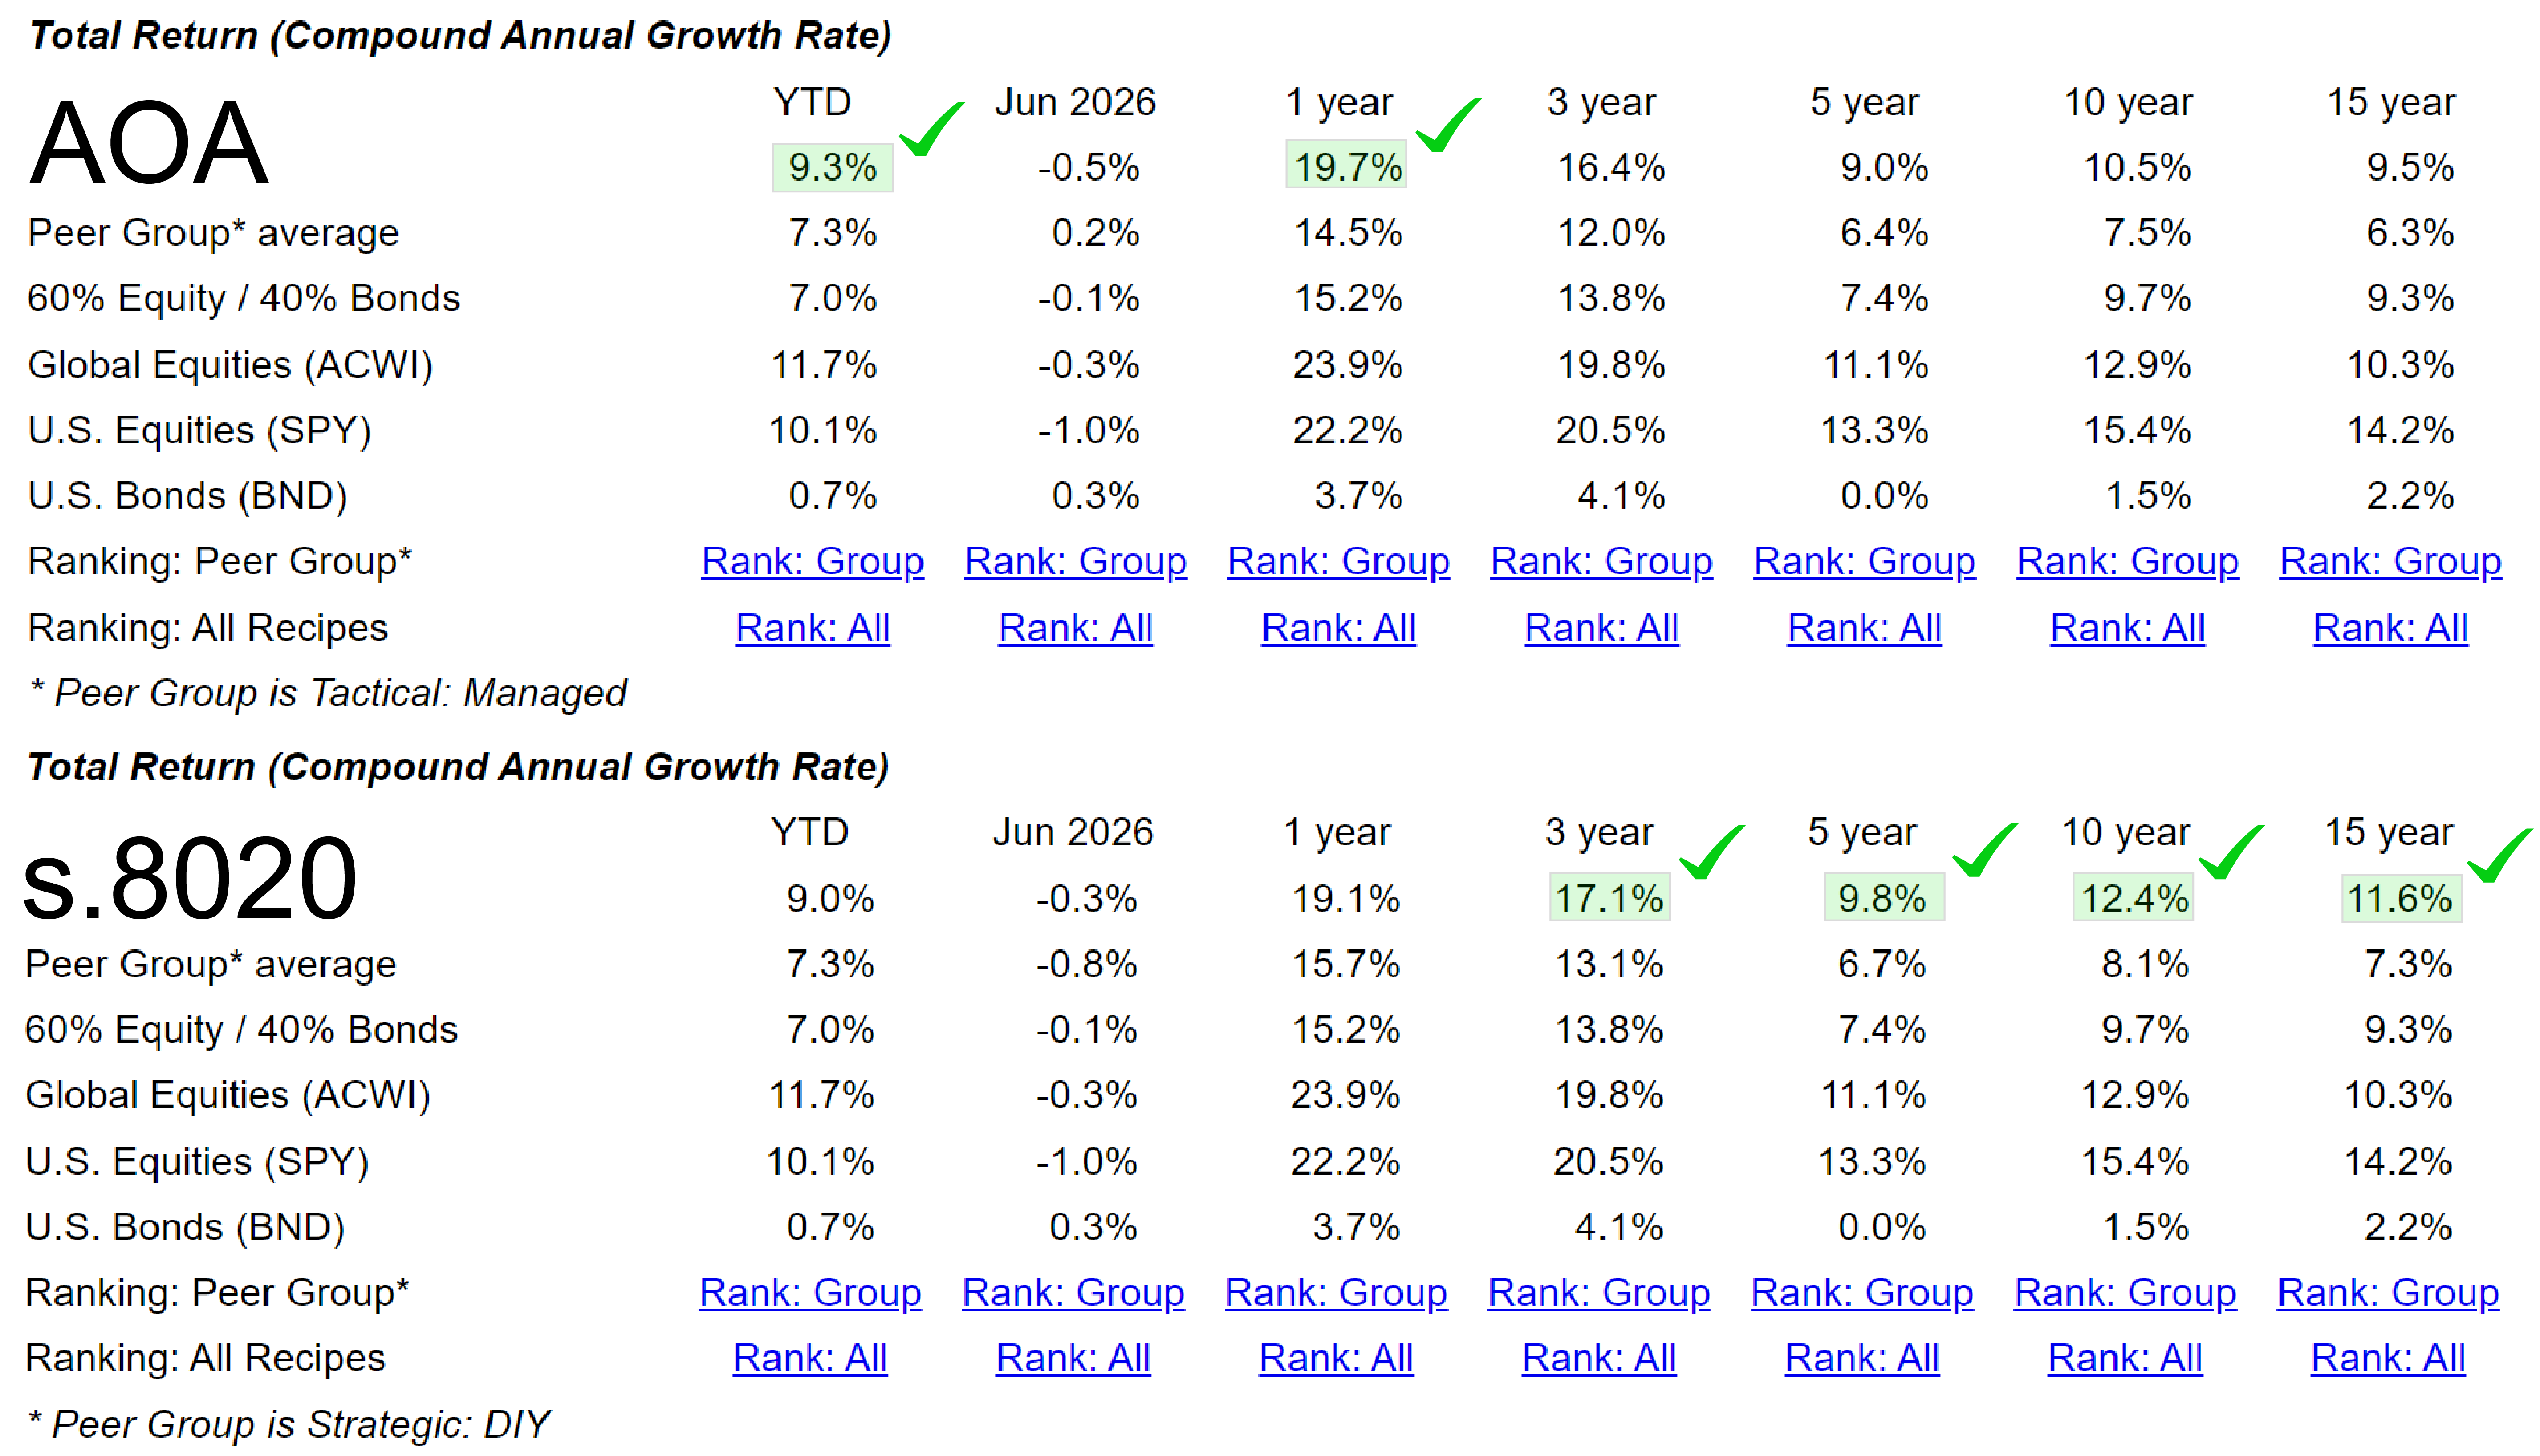
The 15-year comparison is especially notable. Over that period, s.8020 exceeds AOA by about two percentage points per year on an annualized basis. That is a meaningful difference over a long horizon, especially considering that s.8020 is constructed from a simple two-ETF blend.
At the same time, AOA remains a convenient, single-ticker ETF provided by iShares, and iShares ETFs are used in several other RecipeInvesting portfolio recipes. There is no issue with the provider itself, but the head-to-head results are an important reminder that a straightforward two-ETF, static 80/20 allocation can compare very favorably against a packaged single-ticker solution.
Simplicity vs. Long-Term Returns
RecipeInvesting’s static 80/20 allocation, s.8020, is a strategic portfolio recipe built from two ETFs, including a Vanguard fund and U.S. Bonds (BND). Over the long run, this two-fund approach has performed better than iShares AOA.
It is also worth remembering that AOA is not a strict two-fund allocation. Based on its holdings breakdown, AOA is spread across seven underlying funds. It appears that this broader, more diversified structure may have reduced returns over the past 15 years compared with a simpler 80/20 blend.
AOA, Risk, and the S&P 500 Comparison
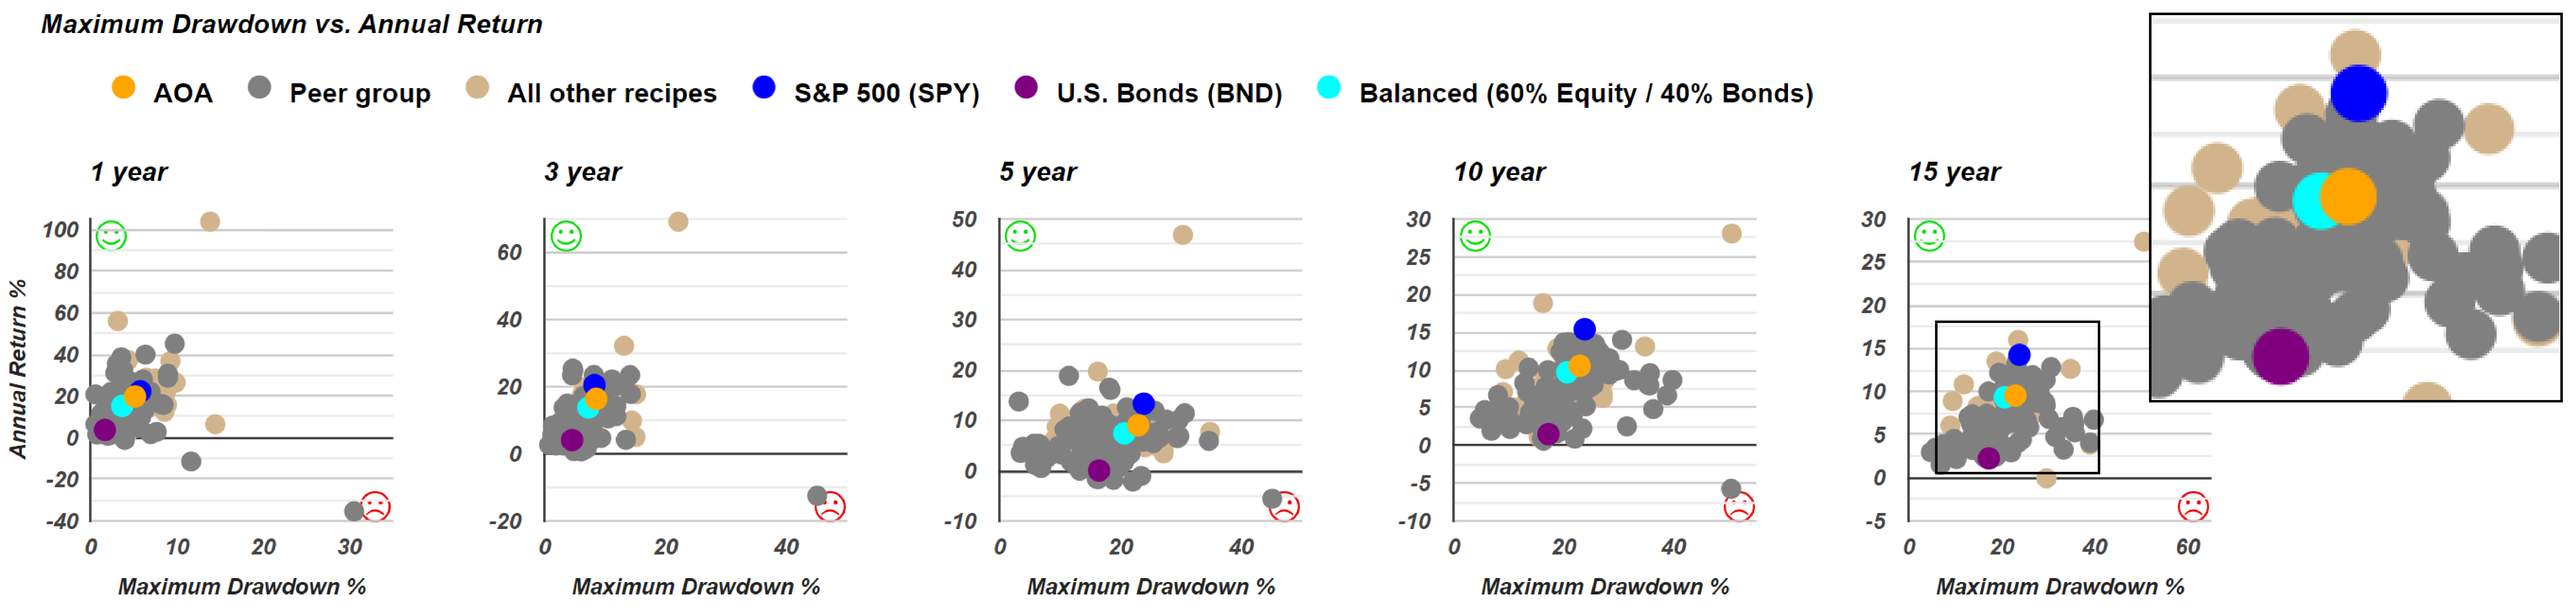
This comparison is not only about return. Risk matters as well. On the 15-year risk versus return chart, AOA sits below and to the left of the S&P 500, represented by SPY. That position suggests two key points:
- AOA has experienced somewhat less drawdown and volatility than the S&P 500 over the past 15 years.
- AOA’s return has been meaningfully lower, which is not an attractive trade-off in that time period.
For investors looking for strategies that have delivered higher return with lower risk than the S&P 500, the Top 5 Sector Rotation (t.srt5) portfolio recipe stands out on the same 15-year chart. It has shown higher returns with less risk than SPY.
There are also portfolio recipes that have achieved stronger returns but with greater risk, offering a different kind of trade-off for an investor to consider.
At the 20-year time horizon, the list of portfolio recipes that have outperformed the S&P 500 with both lower risk and higher return becomes broader. However, AOA does not have a full 20-year history, so it does not appear on the 20-year scatter plot and is only shown through the 15-year view.
Key Takeaways for Investors
This is an interesting look at a family of four related exchange-traded funds that offer simplicity through a single ticker an investor can purchase. As always, it is important to compare these funds with reasonable alternatives.
In this case, the comparisons are clear:
- The iShares balanced fund has not performed as well as a simple 60/40 two-ETF balanced portfolio recipe. Over a 15-year period, it lags by multiple percentage points.
- With AOA, iShares offers an 80/20 single-ticker solution, but it has not matched the results of a straightforward two-ticker 80/20 allocation that an investor can build directly.
Simplicity can be appealing, but it may come at the cost of higher returns. Like many investment decisions, there is a continuum:
- One end is extremely simple, such as a single-ticker allocation fund.
- The other end is highly complex, with many moving parts.
- In the middle, an investor can often find a practical balance that keeps implementation manageable while improving results.
This review highlights how this iShares family of four allocation ETFs compares with RecipeInvesting’s in-house strategic portfolios with similar allocations. It also shows how these funds stack up against certain tactical portfolio recipes that have delivered both higher returns and lower risk.