
Famous Investor Portfolios: Risk, Return, and Strategic vs. Tactical Investing
Famous Investor Portfolios: Risk, Return, and Strategic vs. Tactical Investing
August 2026
Topics this month
- Famous investor portfolios, including models inspired by Craig Israelson, Ben Graham, David Swensen, Ray Dalio, Harry Browne, and Warren Buffett
- Risk-versus-return comparisons using maximum drawdown, the Balanced 60/40 portfolio, and the S&P 500
- The Risk Return Compass and its green, yellow, blue, and red portfolio classifications
- Tactical versus Strategic portfolios, including long-term results for Quartile Sector Rotation and Adaptive Allocation F
- The benefits and trade-offs of fixed-allocation, Strategic portfolio recipes
Recipe Investing offers a library of investable model portfolios in several varieties: Tactical, Strategic, and Managed portfolio recipes. This month, the focus is on one particular area, portfolio families. We have organized our portfolio recipes, including Tactical and Strategic portfolios, into several categories for reference. This makes it easier to consider portfolios that share similar characteristics.
One category is famous investor portfolios. These are static or Strategic portfolios inspired by well-known investors, such as the manager of the Yale University portfolio, Ray Dalio, or Harry Browne. Through their publications or investing practices, these investors have indicated what their strategic models might be.
Comparing Famous Investor Portfolios
To examine these famous investor portfolios, we can begin with the most recent results on the Recipe Summary page, which presents scatter plots comparing the available portfolio recipes. These scatter plots can be viewed using several measures, including maximum drawdown, standard deviation, and downside deviation. As with most investors, a key area of emphasis is risk versus return, and the scatter plots provide a useful way to visualize that relationship.
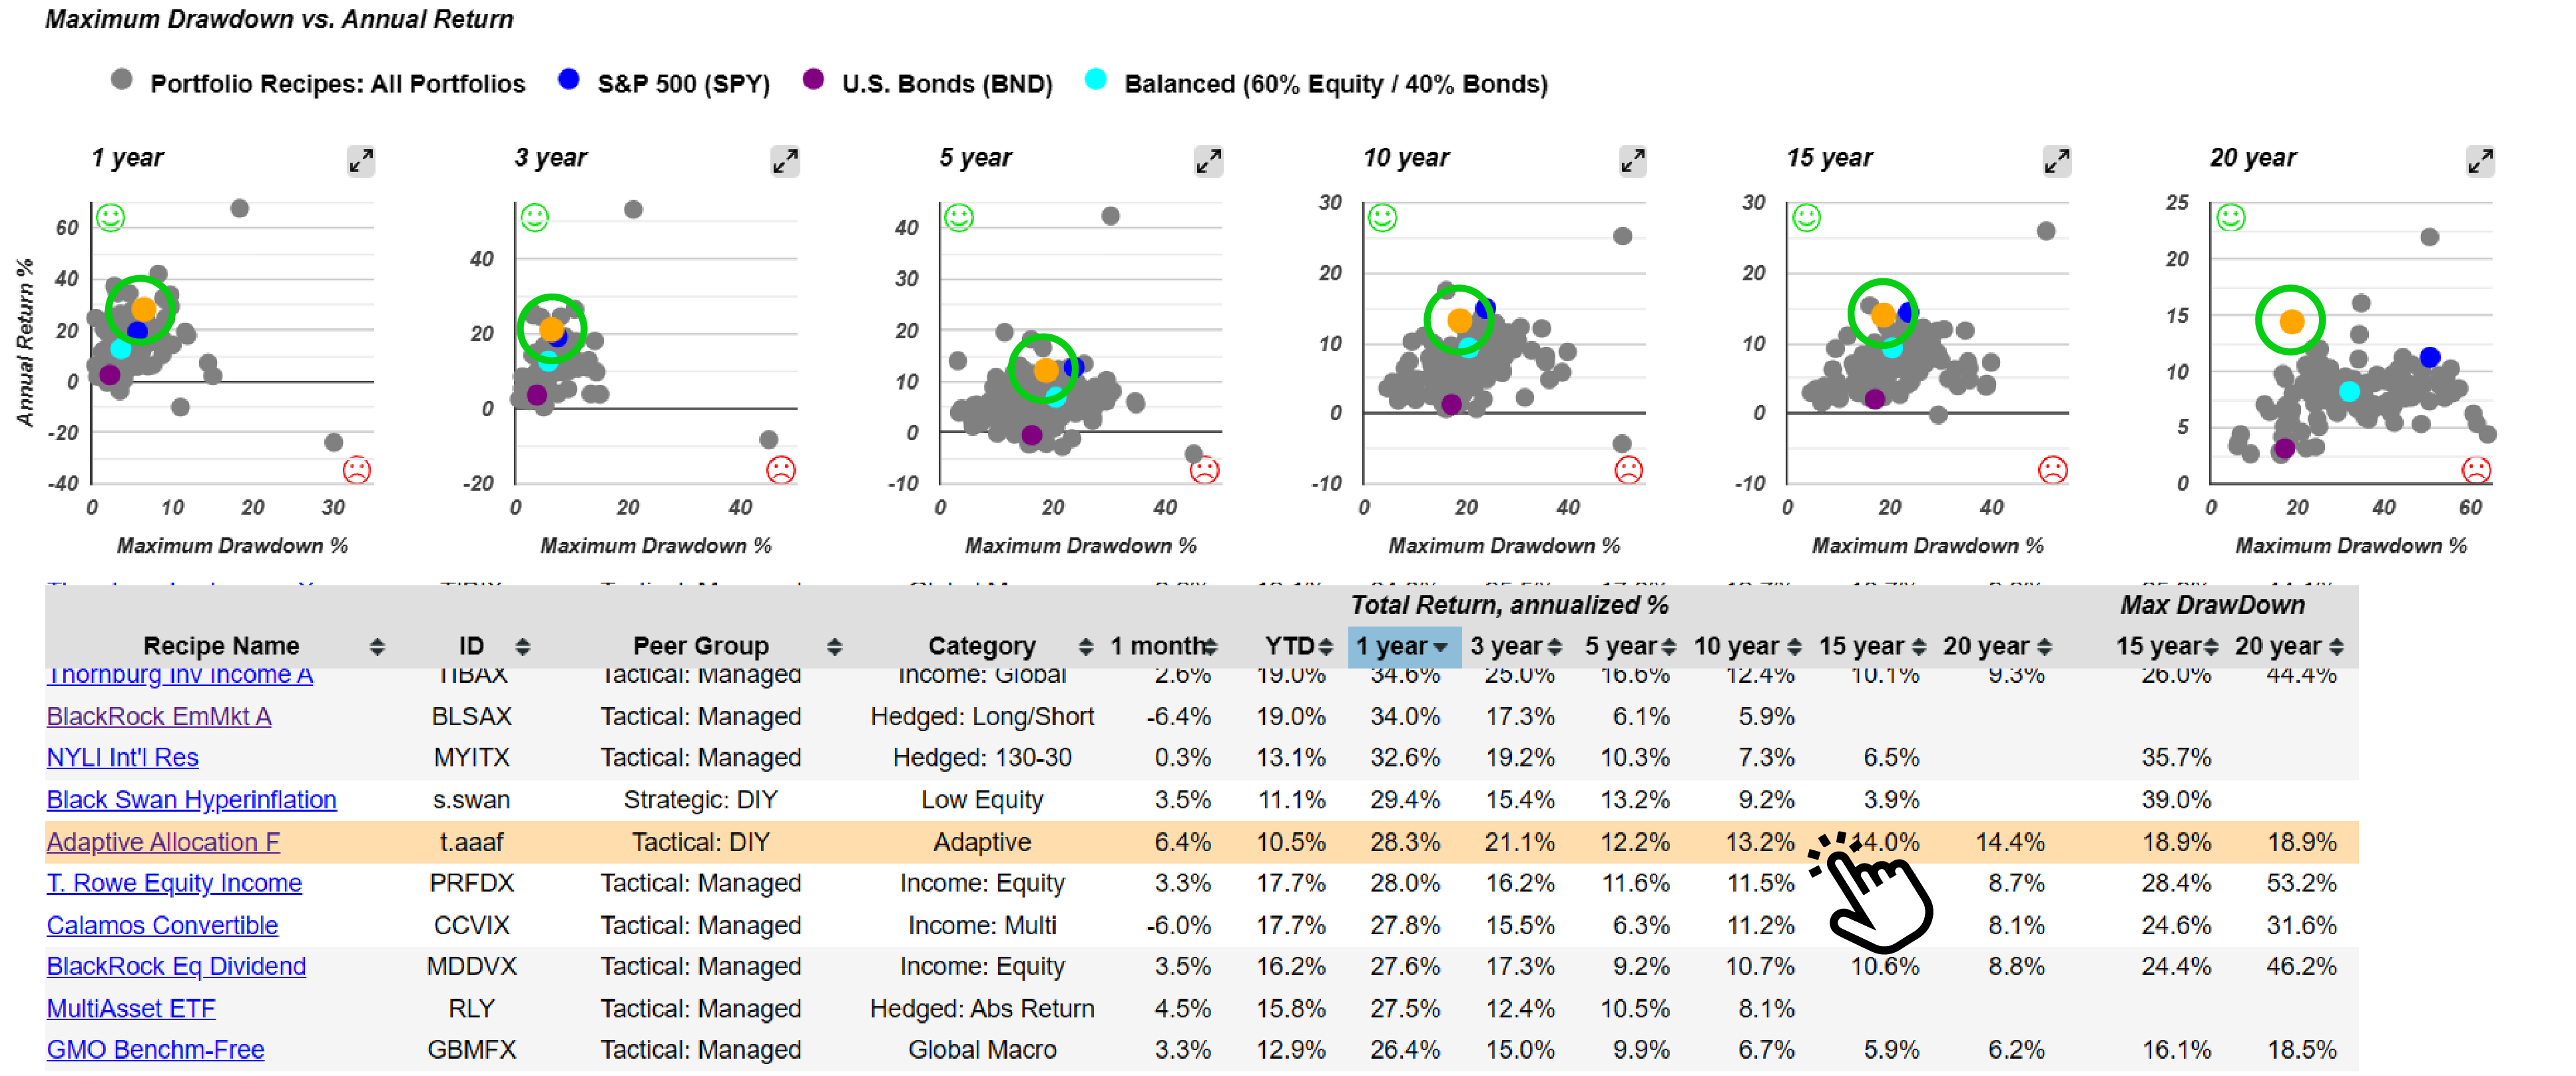
A recently added feature keeps the scatter plots visible at the top of the page while reviewing the results. Selecting a portfolio recipe highlights its row in orange and shows where that recipe falls in terms of risk and return across all available time horizons. This provides another way to explore and compare portfolio recipes, including Tactical Managed, Tactical DIY, and Strategic DIY portfolios.
This month, the focus is on Strategic DIY portfolios. These recipes use a fixed allocation and are rebalanced at the end of each month. They are not strictly static, but their underlying asset allocation remains fixed, such as 60% in one fund, 30% in another, and 10% in a third fund.
Strategic Portfolios Inspired by Famous Investors
Let us begin with some of these famous investor portfolios. Craig Israelson proposed the 7Twelve Israelson (s.712) portfolio, which recommends a fixed allocation across several exchange-traded funds. Although the allocation is fixed, the portfolio is broadly diversified.
Israelson proposed this portfolio some time ago, and its performance is now tracked monthly. Its results can be compared at a glance with several benchmarks. The Balanced 60/40 fund is a helpful benchmark because it falls near the center of the cluster of portfolio recipes. The 7Twelve Israelson portfolio has generally fallen below and to the left of the teal dot, indicating lower performance but also lower maximum drawdown. This may be an appealing trade-off for some investors.
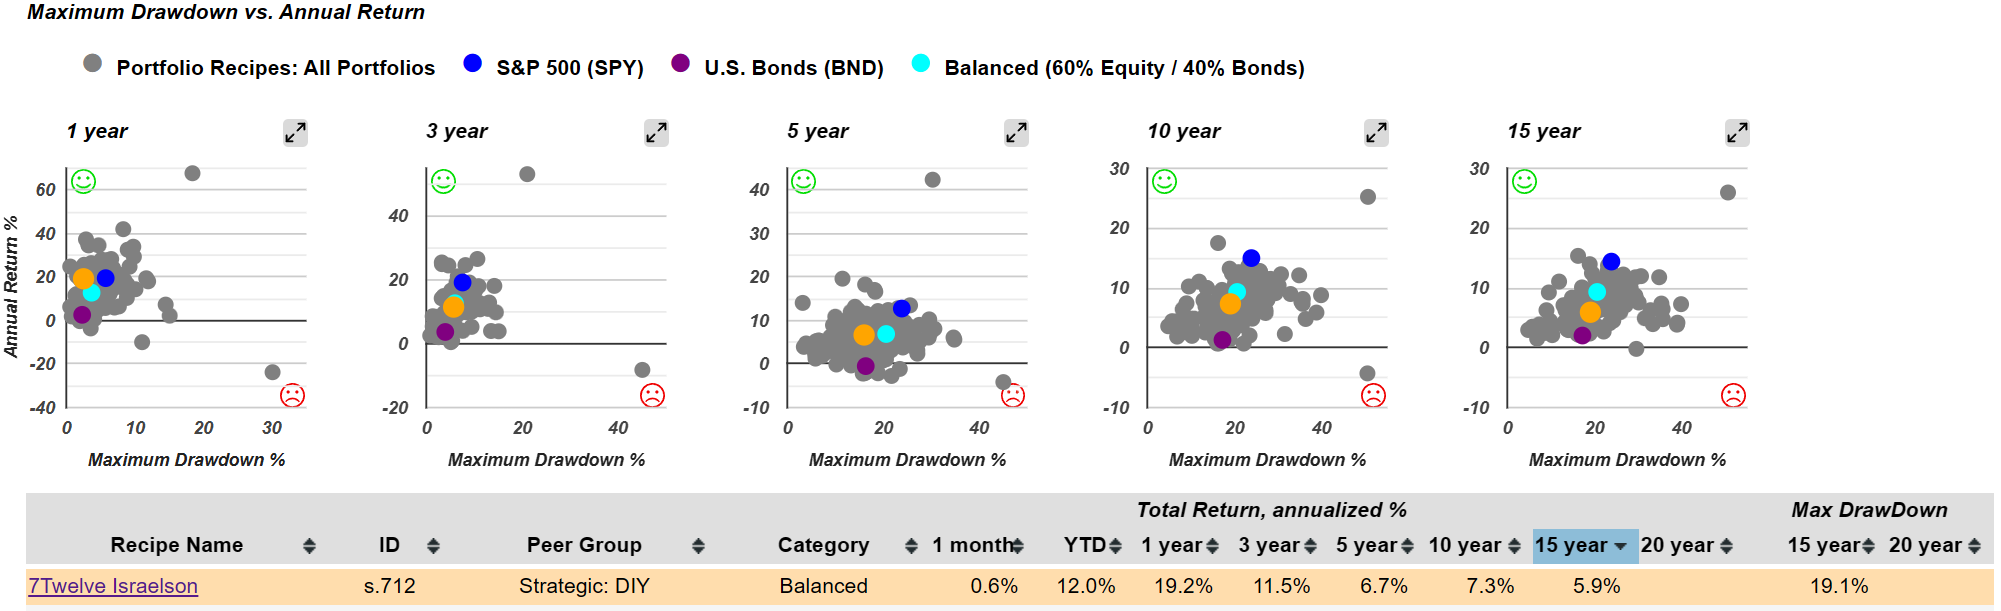
The portfolio has 15 years of history, rather than 20, because some of its underlying exchange-traded funds do not have a 20-year history. As a result, the same strategic allocation cannot be applied across the full two decades. Over the 15-year period, the portfolio falls roughly halfway between the Balanced 60/40 benchmark and the bond-fund benchmark. It may be suitable for investors seeking lower risk than a Balanced 60/40 portfolio, while potentially offering somewhat more return than a bond portfolio. Despite its simplicity, it serves its purpose as a strategic, or static, portfolio recipe.
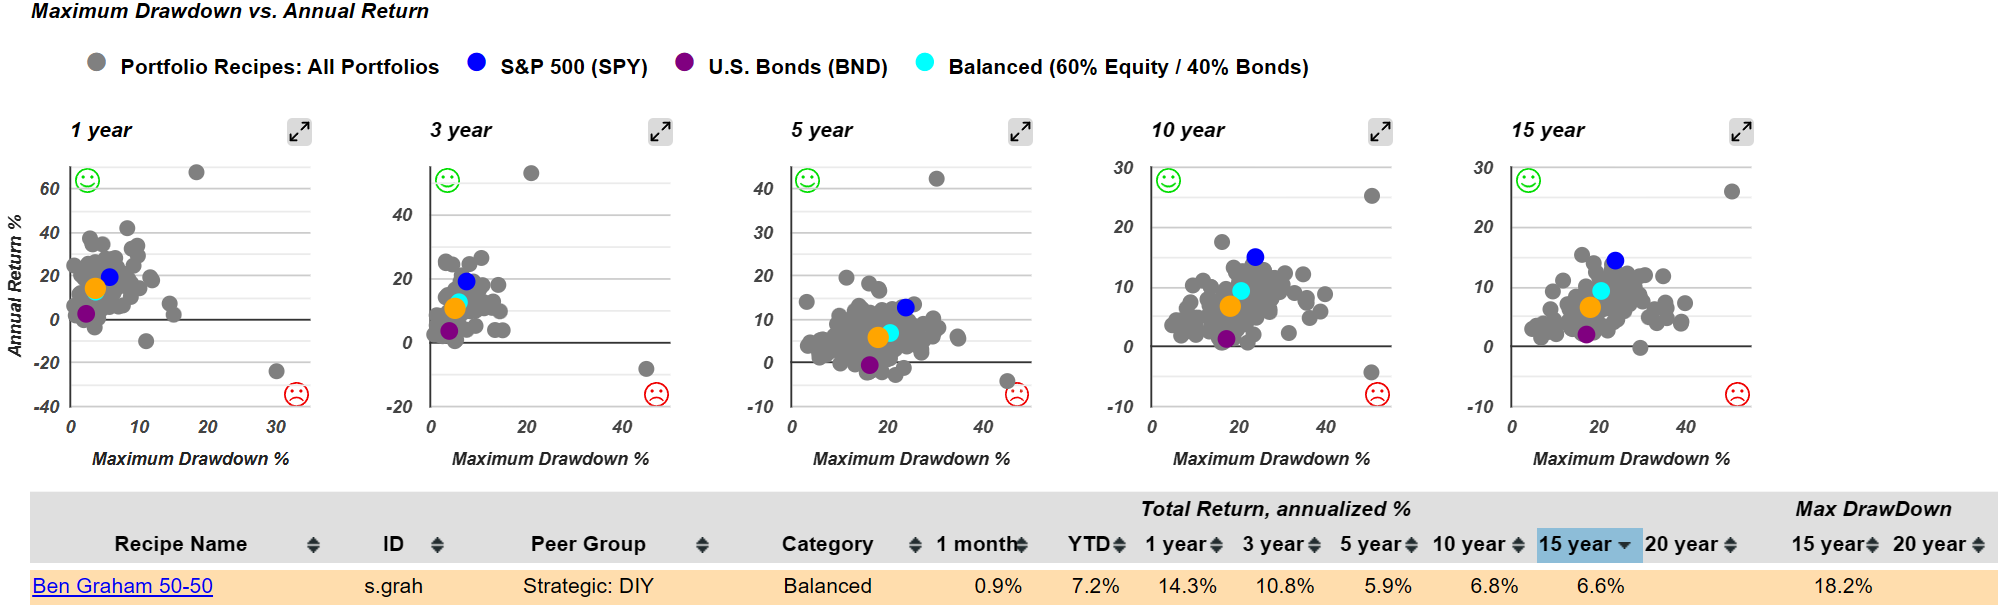
Next, consider Ben Graham (s.grah), another famous investor and author. Like the 7Twelve Israelson portfolio, the Ben Graham portfolio falls below and to the left of the Balanced 60/40 portfolio across the 3-, 5-, 10-, and 15-year periods. This indicates lower returns and lower risk, as measured by maximum drawdown. Over the past year, which is not particularly representative because it is such a short period, the Ben Graham portfolio has performed almost identically to the Balanced 60/40 portfolio.
The scatter plots are also available using downside deviation, standard deviation, and beta, allowing investors to compare annual returns using other measures of risk or volatility. For these comparisons, however, maximum drawdown remains a useful and easy-to-understand risk measure.
Portfolio Results and Risk Trade-Offs
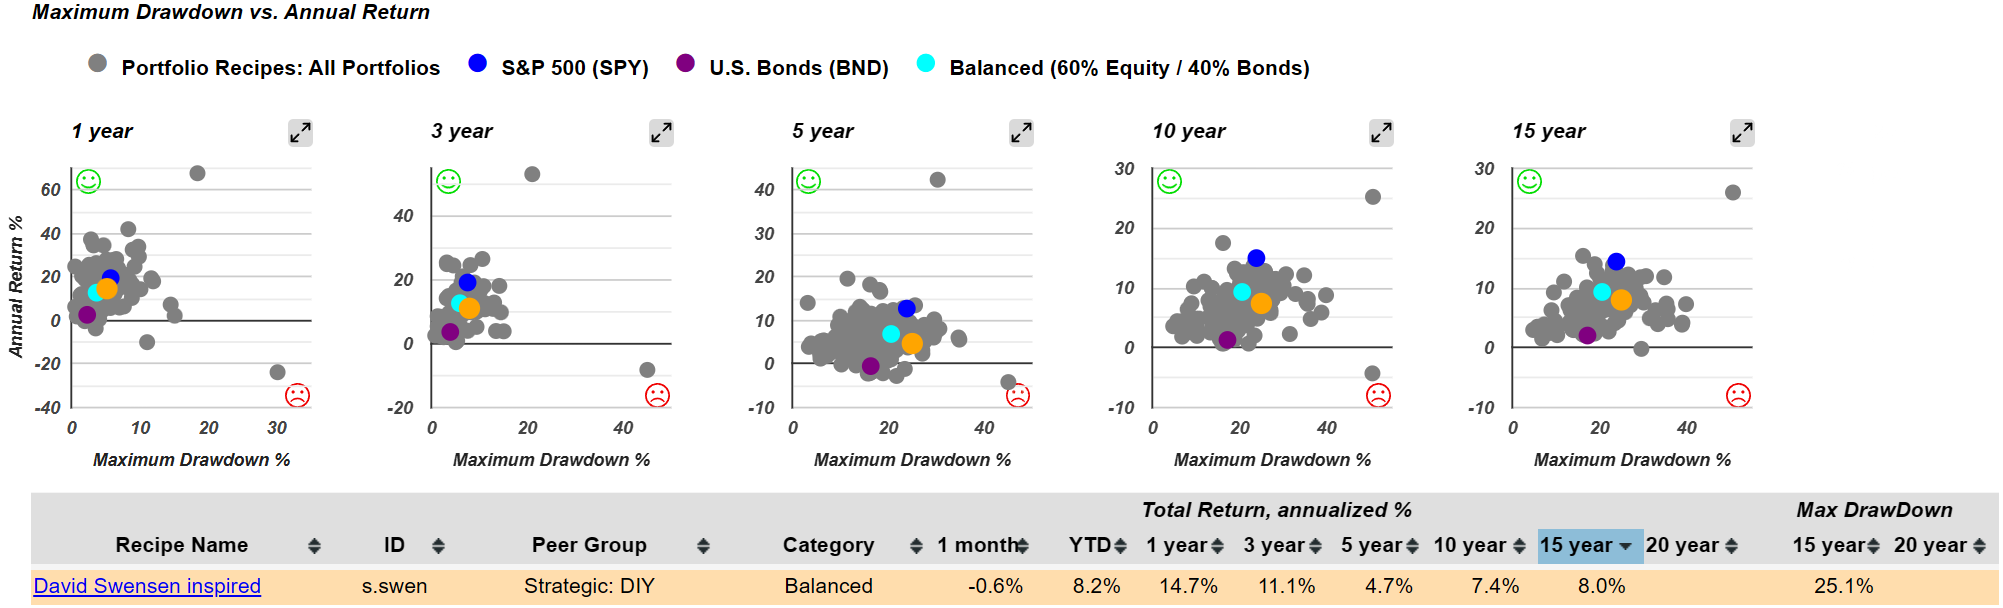
Next is the David Swensen-inspired portfolio (s.swen). Compared with the Balanced 60/40 portfolio, it falls below and to the right, indicating lower returns and a higher drawdown. Over the 3-, 5-, 10-, and 15-year periods, the David Swensen portfolio has performed worse than the 60/40 portfolio on both measures.
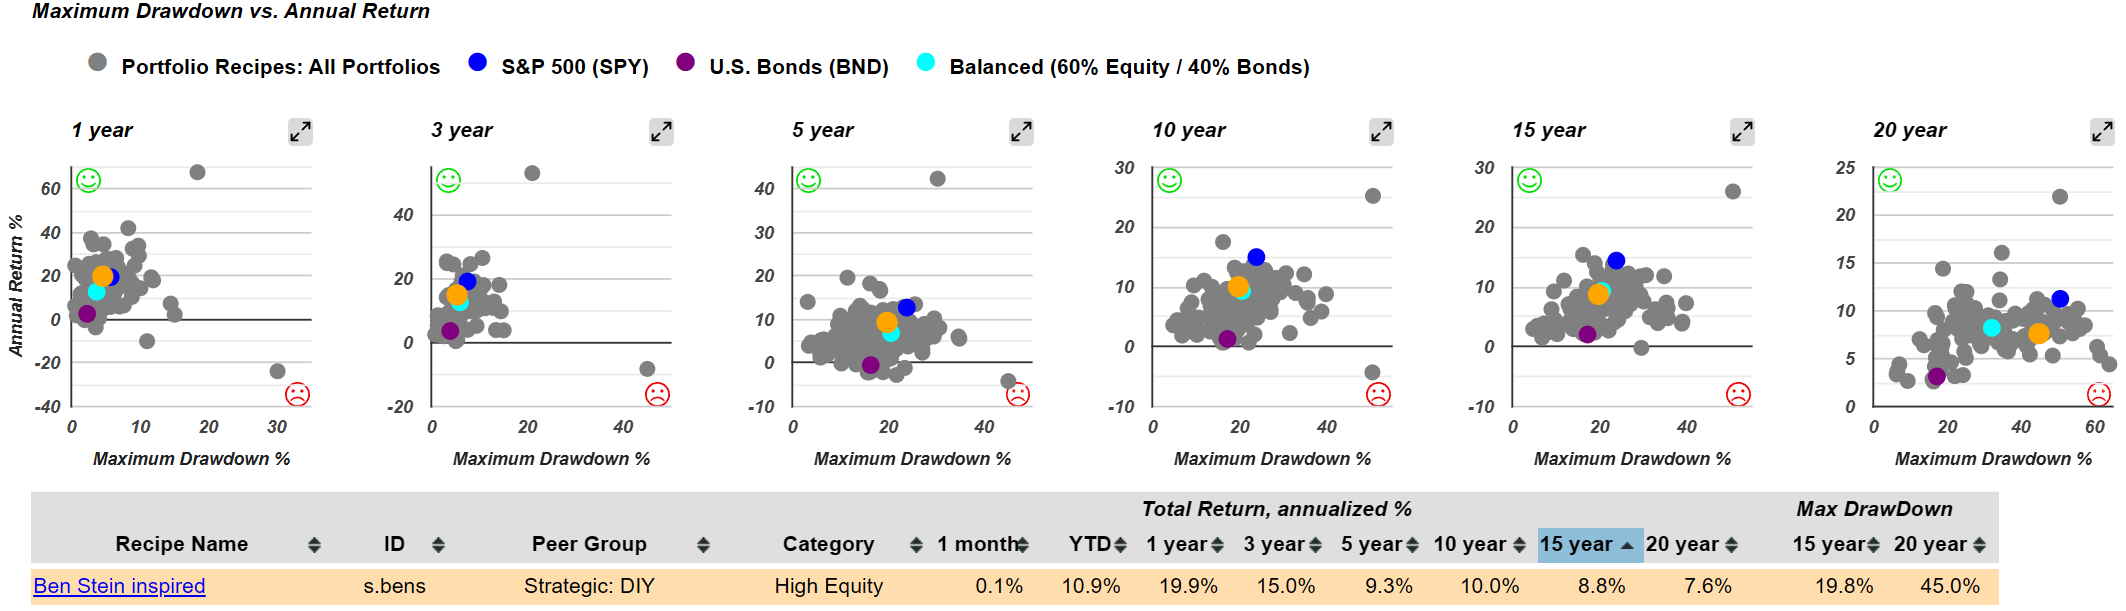
The Ben Stein portfolio (s.bens) was inspired by an article he wrote some years ago. It has performed almost the same as the Balanced 60/40 portfolio, except over the 20-year time horizon. Over that period, it falls below and to the right of the Balanced 60/40 portfolio, indicating worse risk and worse return.
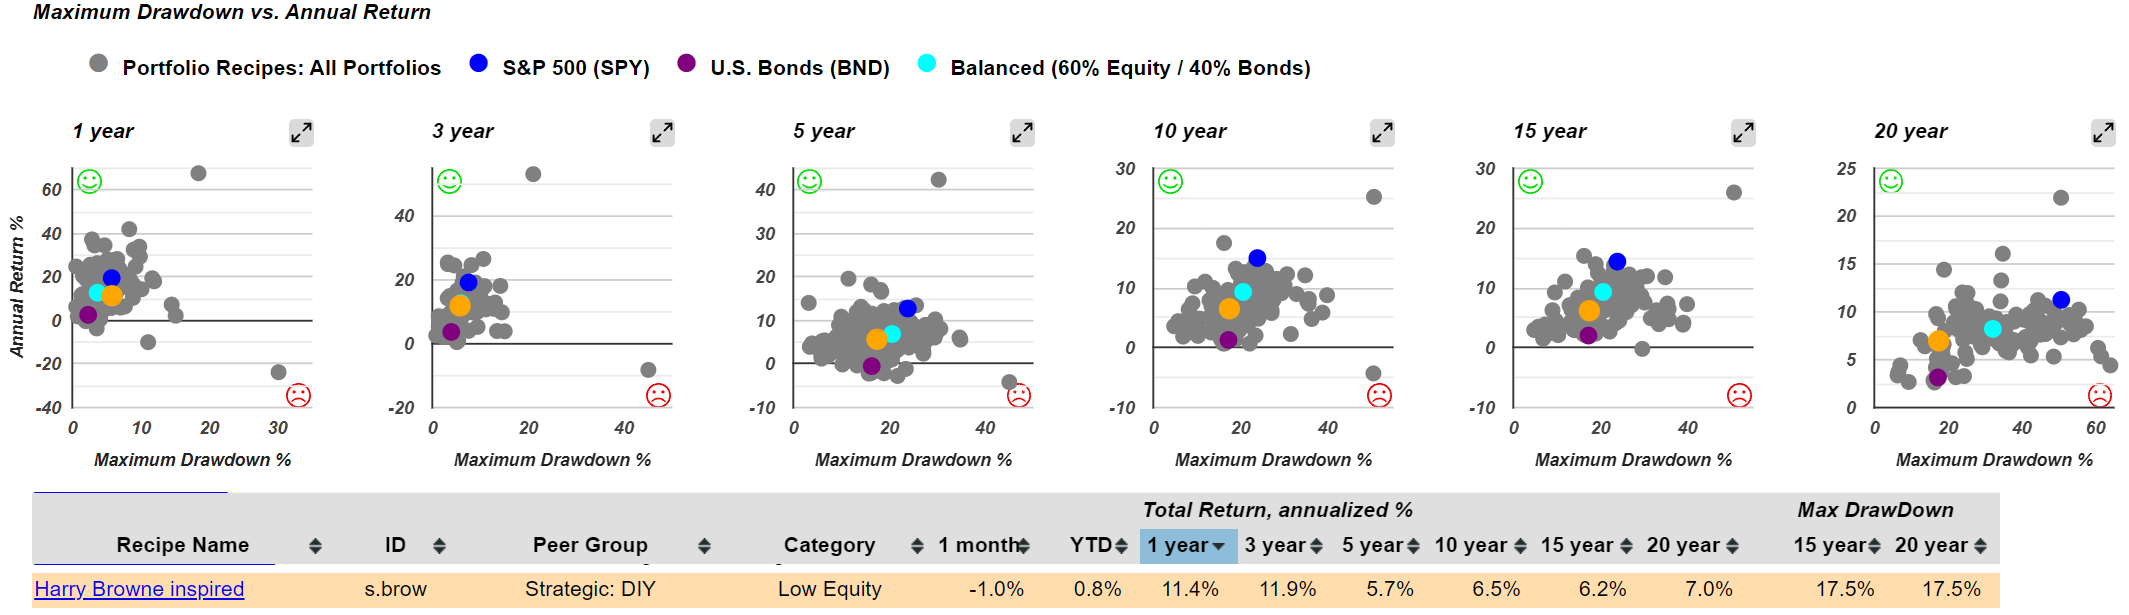
Harry Browne (s.brow) is another famous investor. This portfolio has produced considerably lower returns than the Balanced 60/40 portfolio. However, the 20-year results are interesting because it has delivered more return than the bond fund with a comparable maximum drawdown. It may be a strong option for investors seeking a somewhat less aggressive portfolio than the Balanced 60/40 fund.
Some investors may consider a balanced allocation too conservative and may prefer an allocation closer to the S&P 500. By design, however, these famous investor portfolios are usually diversified across three, four, or more exchange-traded funds. The intended trade-off is generally lower risk and lower return, so it is not surprising that many fall below and to the left of the Balanced 60/40 portfolio benchmark. The Ray Dalio-inspired portfolio (s.dali) continues this trend, falling below and to the left of the Balanced 60/40 portfolio.
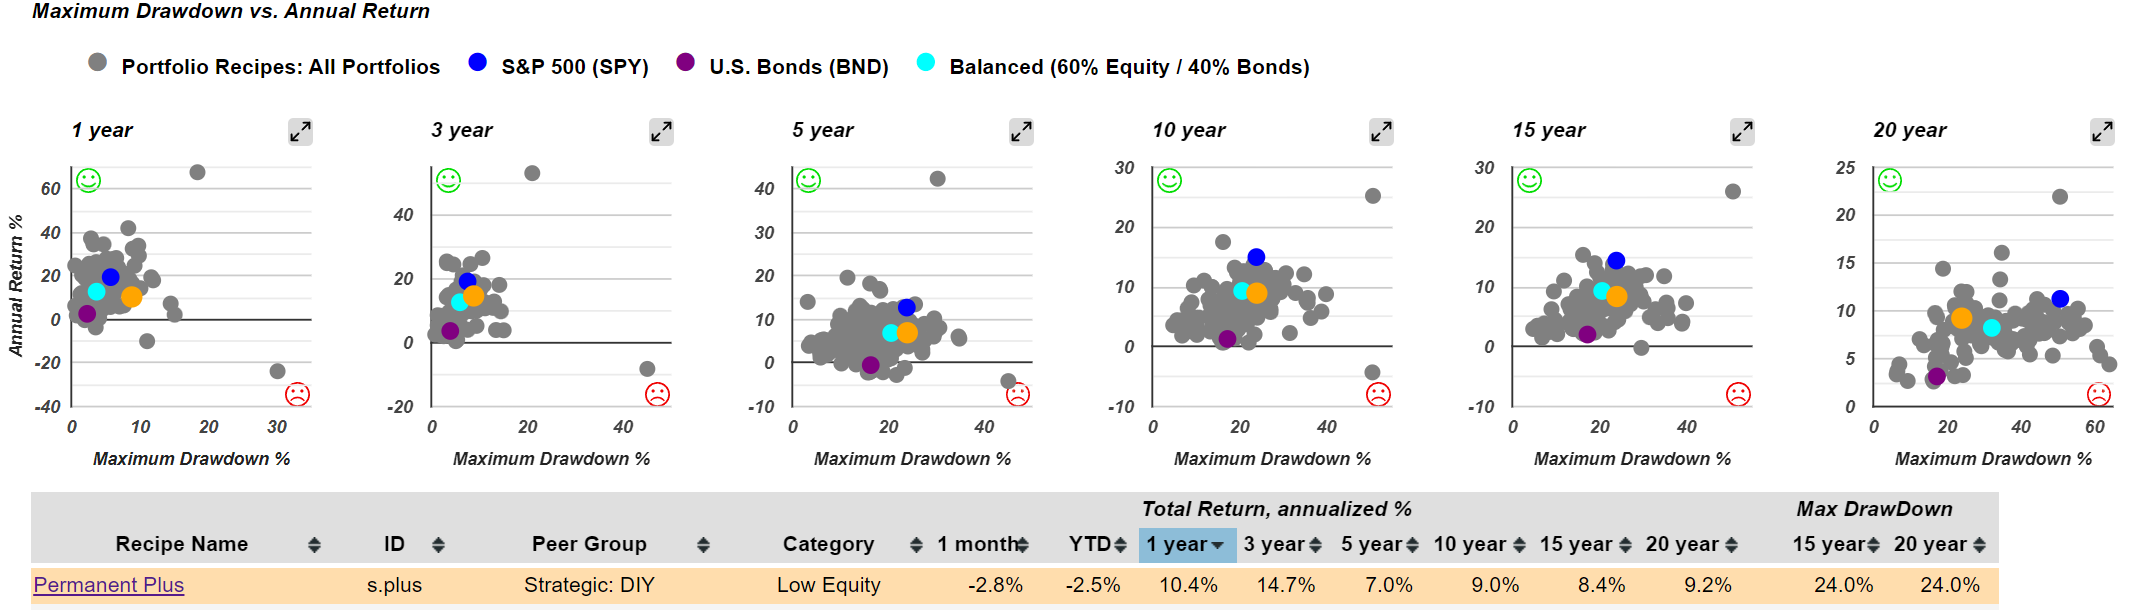
The Permanent Plus portfolio (s.plus) is another interesting example. It is based on the Permanent Portfolio (PRPFX), which includes an allocation to cash. Because markets are usually up more often than they are down, the cash component was removed and the remaining allocation was rebalanced to create Permanent Plus. Rather than four allocations, it uses three: GLD, IWF, and TLT.
Removing the cash component has resulted in somewhat better returns for Permanent Plus than for Harry Browne’s classic Permanent Portfolio. Over the past 20 years, Permanent Plus has produced a 9.2% annualized total return with a maximum drawdown of 24%. This is less than half of the S&P 500’s drawdown of approximately 50% over the same period. Over the past 5 and 10 years, Permanent Plus has been fairly close to the Balanced 60/40 benchmark, although it has been slightly worse in terms of both risk and return.
Berkshire Hathaway Compared With the S&P 500
Finally, Warren Buffett has stepped back from his senior leadership role at Berkshire Hathaway, but Berkshire Hathaway (BRK.A) stock remains part of the analysis. As a conglomerate, BRK.A has a degree of built-in diversification.
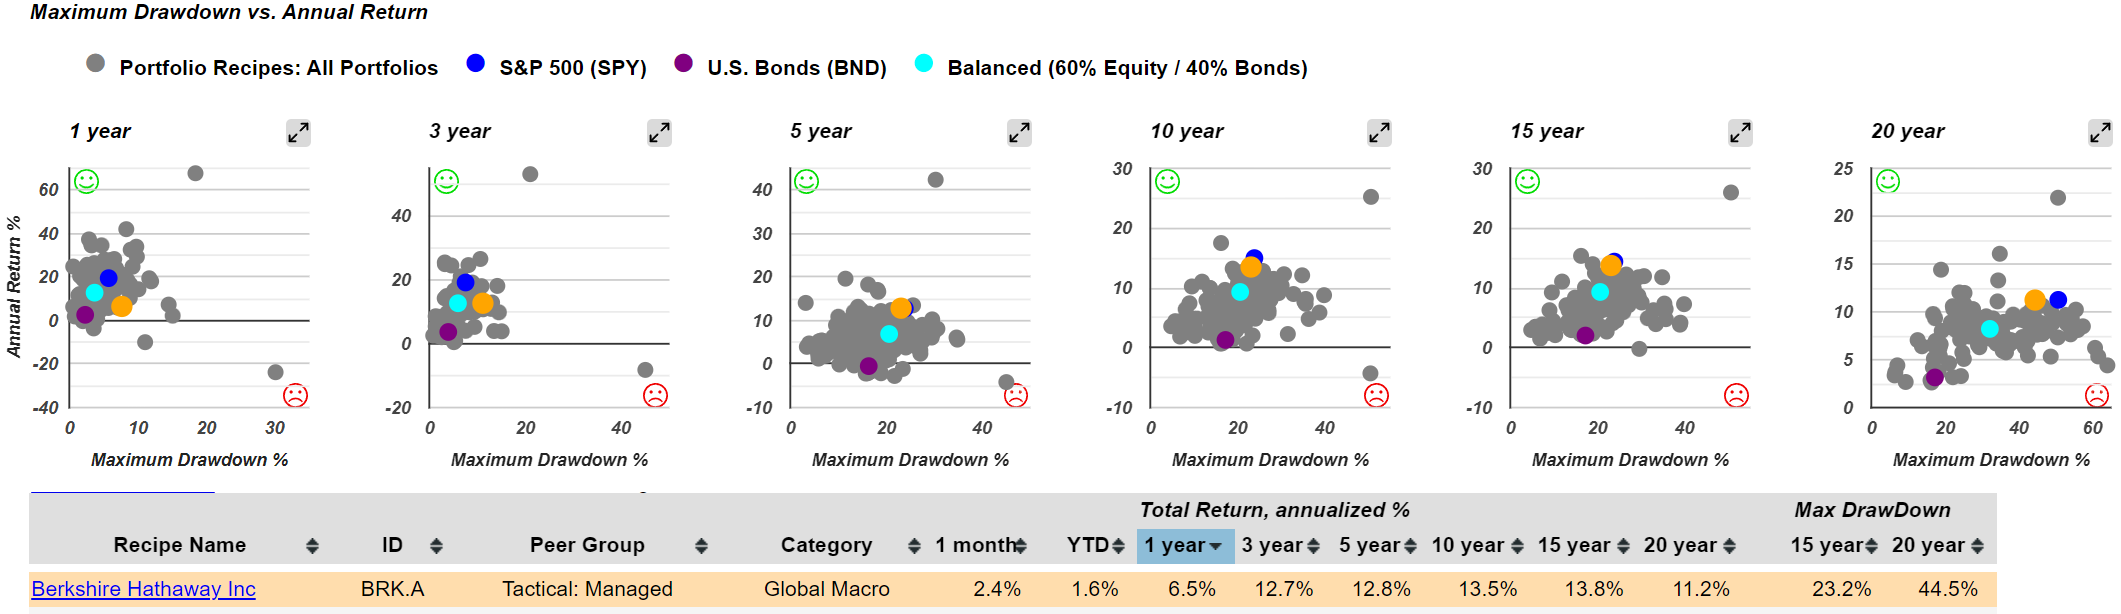
Over the past 20 years, Berkshire Hathaway has produced an annualized return of 11.2%, although it experienced a 44.5% drawdown during the same period. On the 20-year comparison, it falls just below and to the left of the S&P 500, indicating slightly lower risk with about the same return.
Berkshire Hathaway has been somewhat less aggressive than the S&P 500, but it has not necessarily provided much lower risk over the 10- and 15-year time horizons. Over the 3- and 1-year periods, it has performed noticeably worse than the S&P 500. Over the past year, it has also performed worse than the Balanced 60/40 portfolio. However, while the 20-year result is strong, the 15- and 10-year results have been roughly even with the S&P 500. This provides a useful perspective on these famous investor portfolios.
Using the Risk Return Compass
Another available tool is the Risk Return Compass. It uses the teal dot at the center of the scatter plot, representing the Balanced 60/40 portfolio, as a benchmark. Each portfolio recipe is measured against this single benchmark and assigned to a quadrant based on its relative risk and return.

For example, the Israelson portfolio was above and to the left of the benchmark over the past year. It therefore received a green square, indicating higher return and lower risk. Over the past 15 years, however, Israelson fell into the bottom-right quadrant, indicating higher risk and lower return than the Balanced 60/40 portfolio. Outside of the benchmark, green results are relatively uncommon. This reflects the difficulty static or strategic portfolios face in outperforming the benchmark on both risk and return. Among the portfolios reviewed, Ben Graham has generally produced lower risk and lower return than the Balanced 60/40 portfolio. David Swensen has been worse than the benchmark over the 3-, 5-, 10-, and 15-year periods. Ben Stein was ahead over the 3-year period and yellow over the 5- and 10-year periods, indicating higher return but also higher risk. This may appeal to investors seeking a somewhat more aggressive portfolio.

Harry Browne has been blue over several recent time periods, and the Ray Dalio-inspired portfolio has also been blue. Both are effectively milder versions of the Balanced 60/40 portfolio. Permanent Plus received a green result over the 20-year period, which is notable for a strategic or static portfolio that maintains the same allocations and is updated monthly. Its results have varied across the time periods, appearing in the red, yellow, blue, and green quadrants over the past 20 years. Berkshire Hathaway has been yellow across several time periods. Compared with the Balanced 60/40 benchmark, it has offered higher risk and higher return, similar to the S&P 500. Its performance profile is not identical to that of the S&P 500, but it has not outperformed the Balanced 60/40 portfolio on both risk and return.
Tactical Portfolios and Long-Term Performance
The Recipe Summary page shows that several Tactical portfolio recipes have performed strongly over the 20-year period. In Tactical portfolios, the percentage allocations can change each month. The underlying holdings may also change because they are selected from a universe ranging from only a few exchange-traded funds or mutual funds to more than 100 funds in the case of Quartile Sector Rotation (t.srqr).

Quartile Sector Rotation is a Sector Rotation portfolio recipe with the flexibility to move in and out of particular sectors. It has performed very well, particularly with its exposure to the semiconductor sector over the past year. On a 20-year annualized return basis, the top six performers are all Tactical portfolio recipes. SPY and Warren Buffett’s Berkshire Hathaway follow, along with a Robeco Long-Short fund. The Robeco fund is an institutional investment rather than a retail investment, but it remains a useful benchmark. Over the past 20 years, it generated an 11% annualized return with a 34% drawdown.
Adaptive Allocation F (t.aaaf), a subscriber favorite, stands out with a 14.4% annualized return and an 18.9% drawdown. The “F” designation reflects that it was the sixth Adaptive Allocation portfolio developed, following portfolios A through E.
Quartile Sector Rotation (t.srqr) had a 50.7% drawdown, slightly less than the S&P 500’s 50.8% maximum drawdown over the past 20 years. However, Quartile Sector Rotation produced a 21% annualized return, compared with 11.3% for the S&P 500. With nearly the same maximum drawdown, it delivered almost double the annualized return. These results illustrate the performance of some of the leading Tactical portfolios.
Strategic Portfolios: Simplicity and Long-Term Perspective

The first Strategic portfolio to appear on the 20-year performance list is the Strategic 80/20 (s.8020) portfolio, which holds 80% large-cap equities. As a mostly equity portfolio, it has a drawdown that is approximately one-fifth lower than that of the S&P 500, reflecting its lower equity exposure. Another notable option is Talmud Equities and Gold (s.talg), which has produced a 9.7% annualized return with a 38.5% drawdown. This is considerably less drawdown than the S&P 500.
Conclusion
This review of famous investor portfolios focuses on the strategic and static allocations these investors have discussed or written about. Many of these investors likely use more sophisticated methods in practice. However, at some point, each proposed a particular asset allocation that has been converted into a portfolio recipe and model portfolio, tracked and rebalanced monthly.
Some of these portfolios have performed solidly. However, it is always wise to compare them with a benchmark, whether the Balanced 60/40 portfolio or at least the S&P 500, to determine whether a portfolio provides better return, lower risk, or both.
The area of portfolios offering higher return and lower risk than the S&P 500 is sparsely populated. Quartile Sector Rotation (t.srqr) is an outlier, with higher risk and higher return. Although some portfolios have delivered higher returns with lower risk than the S&P 500, they are Tactical rather than Strategic or static portfolios.
Still, a Strategic or static portfolio offers the advantage of simplicity. It can be updated monthly, or adjusted quarterly by allowing winning positions to continue. This approach may be easier to administer and may have fewer tax consequences because it requires smaller adjustments to the overall portfolio.