
2025 Technology, Gold, Quartile Sector Struggles, and Harry Browne Low-Risk
Technology Volatility and Gold Momentum, Quartile Sector Rotation Struggles, and Dynamic Harry Browne's Low-Risk Approach (December 2025)
Topics this month
- Key Market Movements from ETFs: Technology, Gold, and Invesco QQQ
- The Recent Performance Shift in Quartile Sector Rotation (t.srqr)
- Berkshire Hathaway and Other Standout Performers in This Month’s Portfolio Review
- Dynamic Harry Browne (t.dyhb): A Low-Drawdown Alternative with Adaptive Flexibility
Welcome to the December 2025 edition of the RecipeInvesting.com commentary. Before exploring portfolio recipes, it is helpful to begin with the portfolio ingredients: the asset-class exchange-traded funds, global equity funds, and global sector funds that form the foundation of each recipe. These ingredients offer a broad overview of market activity across regions and industries. They also provide valuable context for understanding how different parts of the global market have behaved over the past month. To illustrate these market movements, scatter plots are available at the top of the dashboard. These visualizations make it easy to observe performance trends and relationships among various asset classes. Taking a moment to review these charts offers a quick, engaging snapshot of what has been happening across global markets throughout the month.
Key Market Movements from Technology, Gold, and Invesco QQQ
Several ETFs have experienced notable movement recently. Among the sector funds, Technology (IXN) having declined sharply over the past month. This is a clear reminder of the volatility that can occur when an investor focuses on individual “ingredients” rather than a broadly diversified portfolio.
When shifting the view to the top-performing ingredients, sectors such as technology, various countries, and healthcare show strong results over the most recent month. Healthcare, in particular, has displayed solid performance not only in the short term but also over the past two decades. During that 20-year period, the sector experienced a drawdown of roughly 37%, which is relatively moderate compared with many other focused asset classes. This history contributes to its strong risk-adjusted profile.
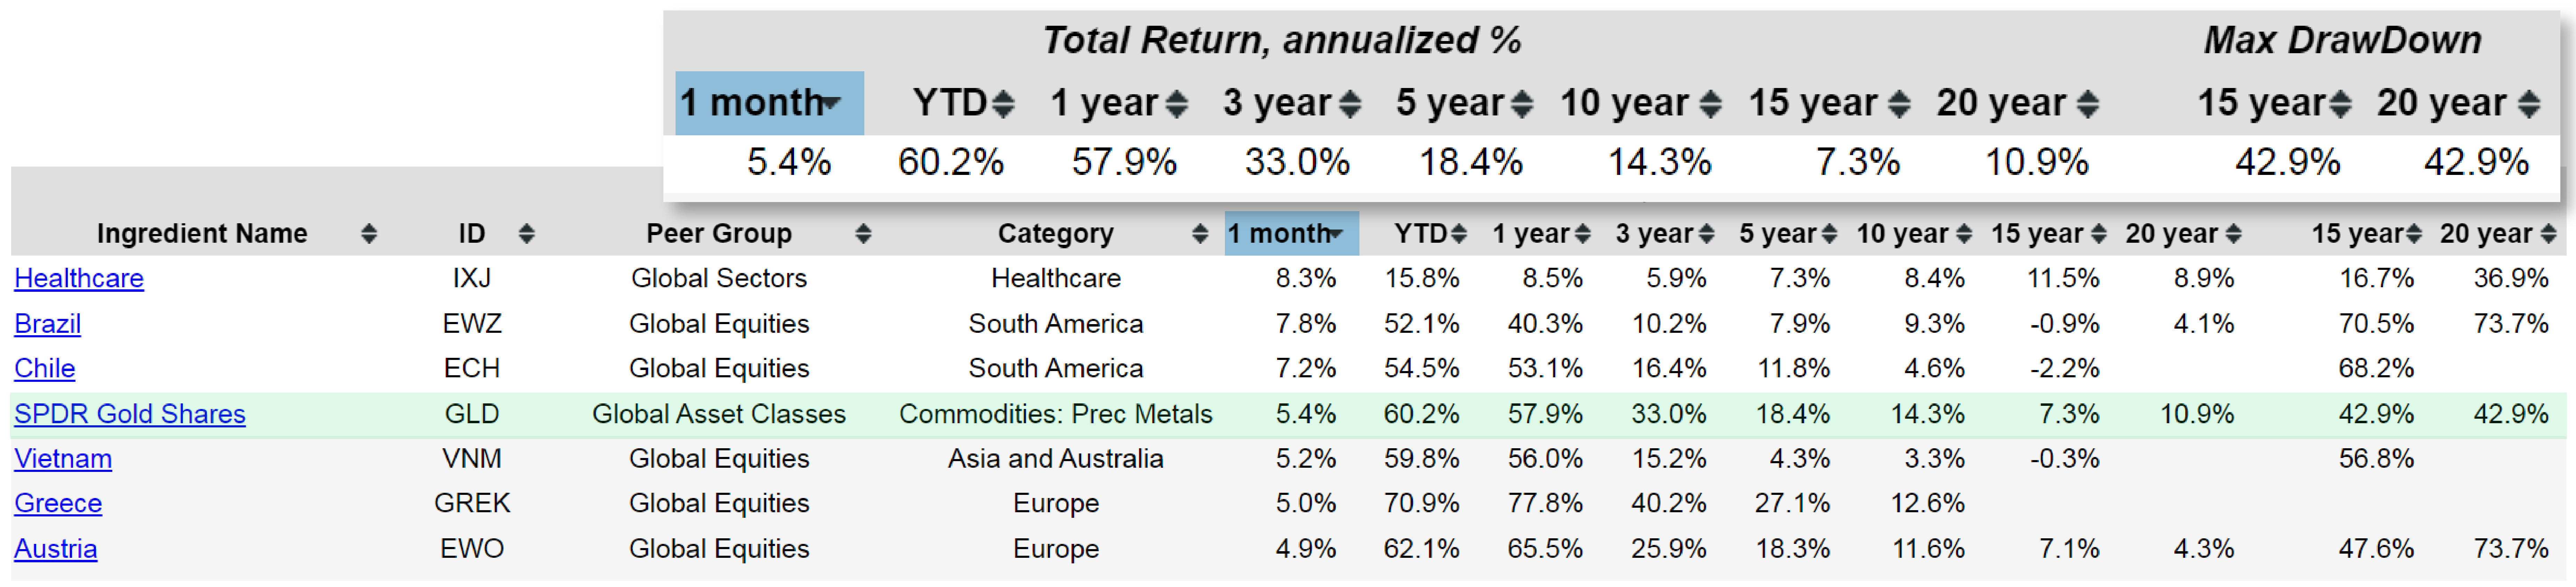
Gold (GLD) also stands out:
- Strong one-year performance: Gold has surged significantly over the past year.
- Solid recent returns: It has also performed reasonably well over the most recent month.
- Historical volatility: Despite this momentum, gold has experienced a drawdown of about 43% within the last 15 years.
As always, higher potential returns come with higher risk. Even so, Gold’s upward trajectory over the past year has been remarkable.
This provides a brief overview of the portfolio ingredients. When extending the analysis to identify which ingredients delivered the strongest 20-year returns, the Invesco QQQ (QQQ) stands out. This technology-focused exchange-traded fund posted an impressive 20-year return of 15.4%. However, it is important to remember that over the same period it also experienced a drawdown of nearly 50% based on month-end data. Strong long-term gains rarely come without meaningful risk.
Another way to evaluate risk is through downside deviation. Some investors prefer this measure instead of maximum drawdown, as it focuses specifically on the volatility that occurs below a target or minimum acceptable return. Reviewing downside deviation across the same time periods provides an additional lens for understanding the risk profile of each ingredient.

When ranking the ingredients by total return, the results are broadly consistent whether the assessment uses maximum drawdown, which reflects the largest peak-to-trough decline, or downside deviation, a variation of standard deviation that focuses specifically on downside volatility.
Across these measures, Invesco QQQ continues to perform strongly. Several other exchange-traded funds have also produced double-digit annualized returns over the past two decades, each paired with its own corresponding level of risk.
The Recent Performance Shift in Quartile Sector Rotation
Turning back to the portfolio recipes, the focus now shifts to the asset-allocation strategies available on the platform. These portfolios fall into several categories:
- Strategic DIY: Allocations remain constant, although they are rebalanced monthly.
- Tactical DIY: Allocations adjust dynamically and can shift from month to month.
- Tactical Managed: Professionally managed mutual funds or exchange-traded funds used for comparison or for investment purposes.

Reviewing the summary page for these recipes provides a clear view of how each portfolio has performed over the past month across different peer groups and categories. One particularly interesting development is the performance of the Quartile Sector Rotation (t.srqr) portfolio recipe. Although it has historically delivered strong returns, nearly 42% annually over the past three years and 34% annualized over five years, it has struggled over the most recent year.
The underlying methodology of this strategy explains part of the recent challenge. The algorithm selects the top-performing fund within a sector and holds it until it drops out of the top quartile. Recently, one fund has hovered just above that cutoff, meaning the strategy continued to hold it even as its performance declined. This has contributed to the portfolio’s weaker results over the past month.
Despite this short-term setback, the strategy has performed exceptionally well over the past 15 years, even when accounting for periods of elevated risk shown in its maximum drawdown history. Overall, this reflects the downside activity observed over the past month.
Berkshire Hathaway and Other Standout Performers in This Month’s Portfolio Review
Looking at the upside, Berkshire Hathaway (BRK.A) stands out. Although nearly everything tracked in this list is a mutual fund, an exchange-traded fund, or one of the strategic or tactical model portfolios, Berkshire Hathaway is the one exception. It is included because it effectively functions as a global macro stock, a diversified conglomerate spanning multiple industries. With Warren Buffett’s reputation as one of the world’s most influential investors, Berkshire Hathaway serves as a useful comparison point within the broader analysis.

This month, it holds the top position for one-month total return among all portfolio recipes and related investments tracked on the platform. Its strong performance highlights how individual, broad-based companies can occasionally outpace more structured portfolio strategies.
Another noteworthy result comes from the Black Swan Hyperinflation (s.swan) portfolio. It has performed very well over the past year, but when reviewing its longer-term track record, the portfolio has lagged significantly over the past 15 years. This contrast underscores the importance of evaluating both short-term momentum and long-term consistency when reviewing portfolio outcomes.
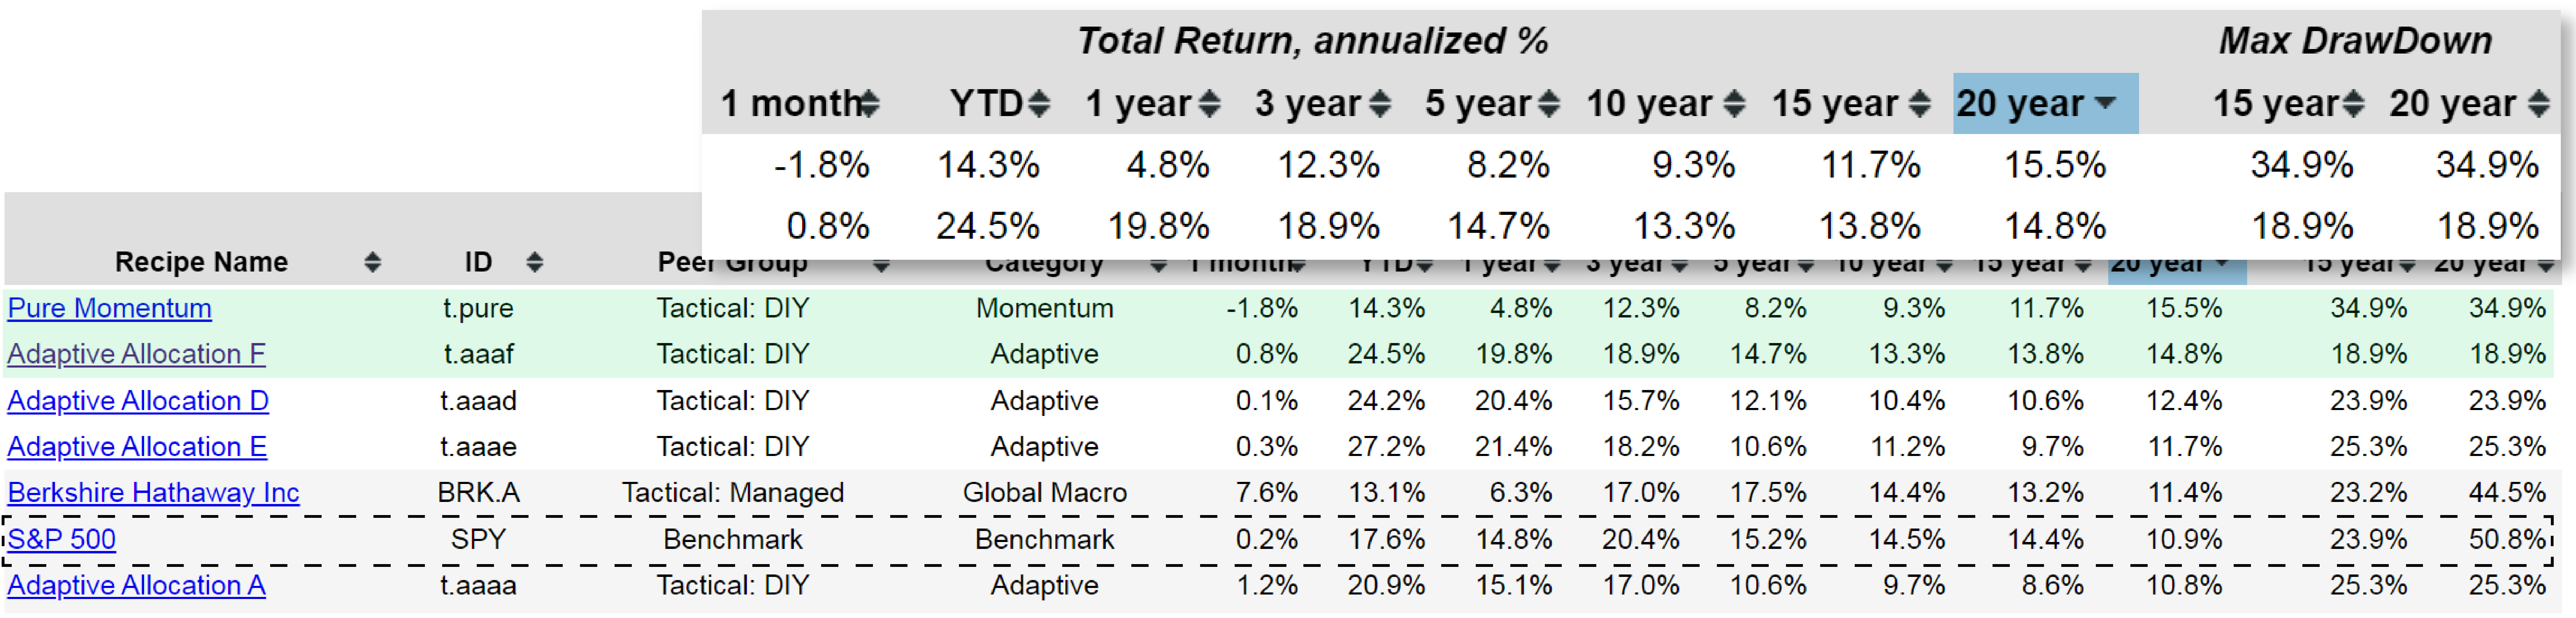
This provides a look at the best and worst-performing recipes for the month. Conducting a similar review over a longer horizon, specifically the past 20 years, offers additional insight. By sorting the list by 20-year total return, the top performer becomes clear: the momentum-based tactical portfolio Pure Momentum (t.pure). This strategy has delivered an impressive annualized return of 15.5% over two decades, paired with a maximum drawdown of about 35%. Over shorter periods, it has also held up reasonably well, declining only 1.8% over the past month and gaining roughly 12% annually over the past three years. Its five-year annualized return of 8.2%, while more modest, remains respectable.
Several Adaptive Asset Allocation portfolios also rank highly over the past 20 years. Adaptive Allocation F (t.aaaf) is a notable example and remains one of the more popular options, largely because it has produced consistent results with a drawdown of less than 19% over the two-decade period. Year-to-date, it has continued to perform relatively well.
Reviewing the 20-year total return column reveals the wide variation in risk across the portfolios:
- Lower drawdown examples: t.aaaf with under 19%
- Higher drawdown examples: the S&P 500 benchmark (SPY), which experienced a decline of more than 50% during the 2008 financial crisis
- Institutional benchmarks: Robeco Long/Short (BPLSX), with over a 10% annualized return and a 34% drawdown, though unfortunately limited to institutional investors
Other Adaptive Asset Allocation strategies also show strong long-term performance, including variations with annualized returns above 10% and drawdowns below 30%. Within this family, versions F, D, and E have generally outperformed the B, C, and A models due to their stronger return profiles combined with lower drawdowns.
These six variations of the Adaptive Asset Allocation algorithm represent different approaches within the same framework. Their performance is tracked monthly, with rebalancing applied as needed to maintain alignment with each model’s methodology.
Dynamic Harry Browne: A Low-Drawdown Alternative with Adaptive Flexibility

One of the more interesting examples is the Dynamic Harry Browne (t.dyhb) portfolio. Sorting the list alphabetically makes it easy to locate. This strategy has produced a 7.3% annualized return over the past 20 years while keeping its maximum drawdown to just 14%. This level of downside risk is even lower than what was observed in the previously mentioned Adaptive Allocation F (t.aaaf) portfolio. Although the long-term return is more modest, the reduced drawdown reflects a conservative risk profile.
The structure of the Dynamic Harry Browne portfolio helps explain these results. It ranks three core asset classes: equities, long-term bonds, and gold—based on their three-month performance. However, one distinctive feature sets it apart: it can allocate up to 100% into short-term bonds. When all three primary assets (gold, long-term bonds, and equities) show negative or weak returns, the portfolio shifts fully into short-term bonds. This flexibility provides a meaningful hedge during downturns, which is reflected in the strategy’s relatively low 20-year maximum drawdown of about 13%.
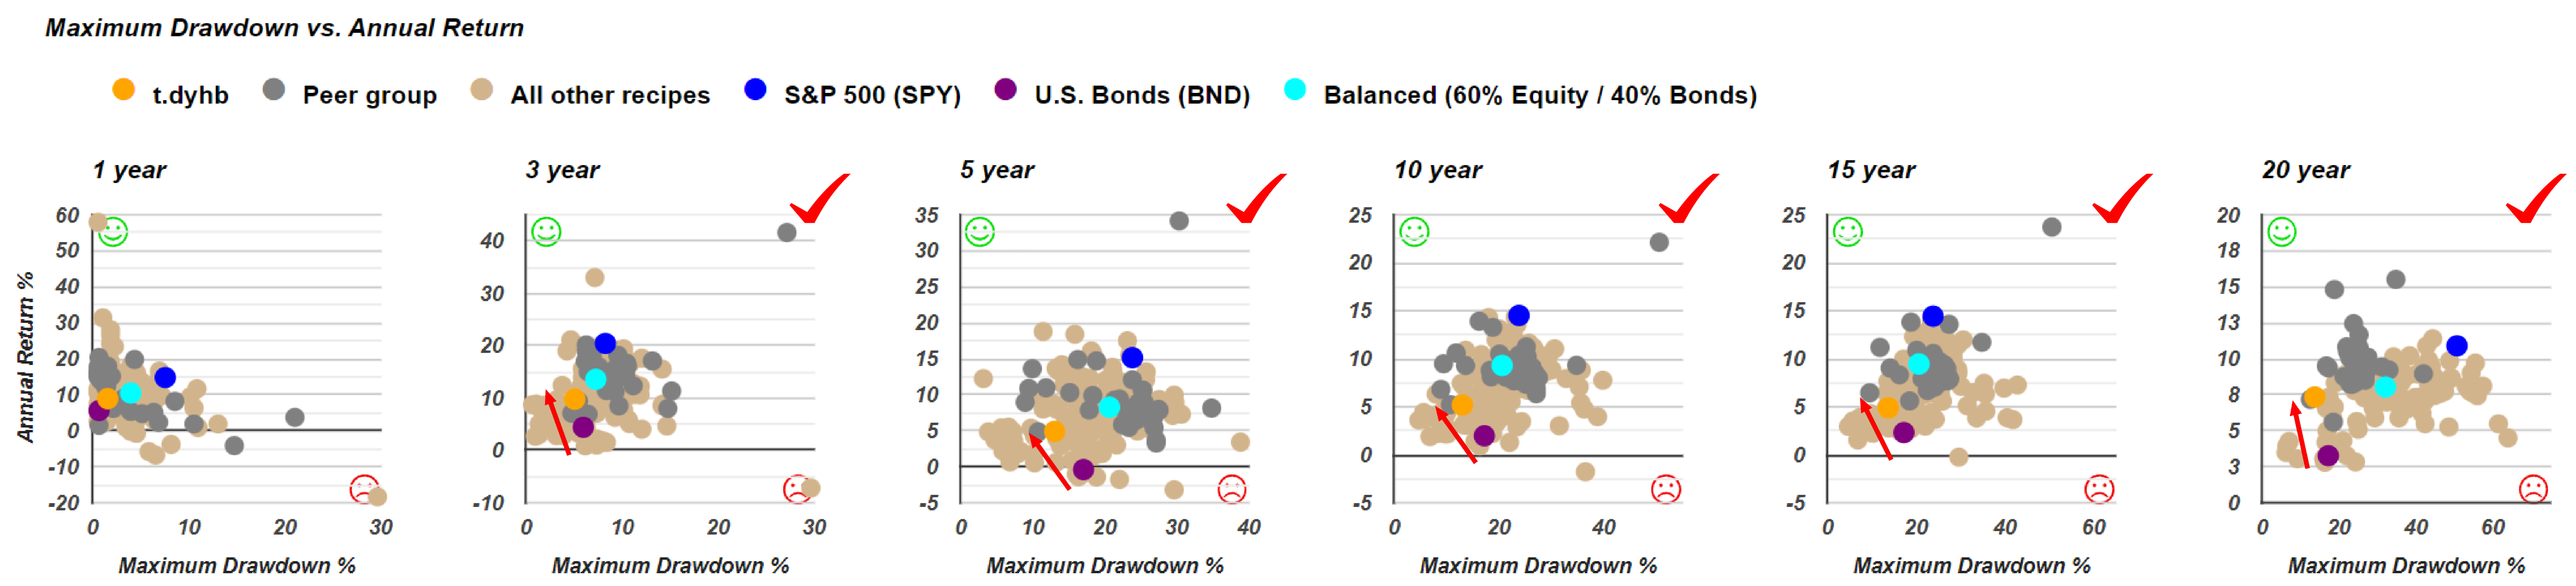
When charting the Dynamic Harry Browne portfolio on a maximum drawdown scatter plot, its performance typically lands between the benchmark Balanced 60/40 (s.6040) portfolio and the U.S. Bonds (BND) portfolio. In many time periods: three years, five years, ten years, and fifteen years—it appears above and to the left of BND, indicating both higher returns and lower drawdown compared with the bond benchmark.
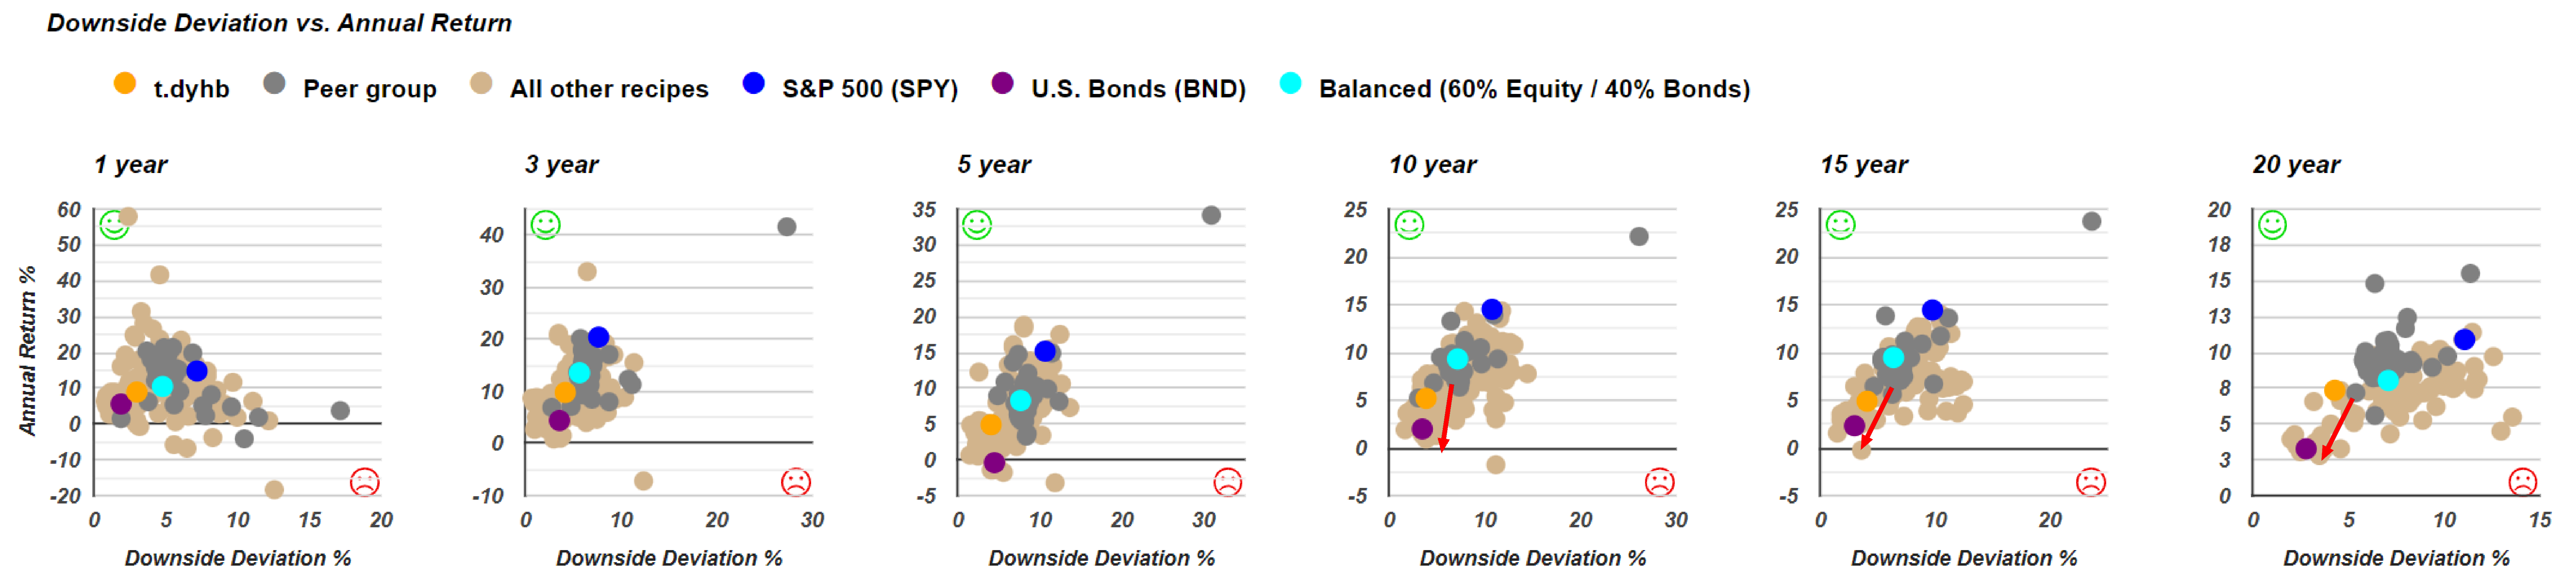
Evaluating the portfolio using downside deviation tells a slightly different story. On this metric, the strategy plots above and to the right of BND, suggesting higher returns paired with somewhat higher downside volatility. Even so, its position remains between the Balanced 60/40 portfolio and BND, and still above the trajectory that would connect those two benchmarks. This implies that even a blended allocation of SPY and BND, whether structured as a 60/40, 50/50, or 40/60 mix would likely underperform the Dynamic Harry Browne strategy on both return and risk-adjusted bases.
Overall, the Dynamic Harry Browne portfolio demonstrates how a rules-based, flexible allocation approach can offer balanced performance with comparatively low drawdowns across multiple market cycles.
As an investor explores the various portfolio options and adjusts the table views, selecting any individual portfolio recipe or any of the managed exchange-traded funds or mutual funds opens a detailed view where the chosen fund appears as the highlighted orange point. This allows for direct comparison against all other funds and portfolio recipes using the scatter plot results. Each point on the scatter plot identifies the corresponding recipe when hovered over, making it easy to examine the underlying strategies and analyze their performance. From there, an investor can continue to investigate specific models in greater detail.