
2025 Tactical, Strategic, Calamos Convertible Fund, and iShare ETFs
Tactical and Strategic Portfolios, Calamos Convertible Fund, and iShares ETF Performance Review (November 2025)
Topics this month
- October 2025 Tactical Portfolio Highlights: Winners and Underperformers
- How the Calamos Convertible Fund Compares to the S&P 500 and Balanced 60/40 Portfolio
- Permanent Plus Portfolio: A Strategic Approach to Steady Long-Term Performance
- Strong Performers and Key Insights from iShares ETFs
Welcome to the November 2025 commentary from RecipeInvesting.com. At Recipe Investing, the focus is on analyzing and evaluating a wide range of portfolio “recipes” also known as model portfolios or asset allocation portfolios. These portfolios are designed to provide investors with structured, diversified investment approaches based on different strategies and objectives. We track and review dozens of these portfolios each month, offering insights into how they perform across various market conditions. These portfolios generally fall into two main categories: “tactical portfolios”, which adjust their allocations monthly in response to changing market trends and “static or strategic portfolios”, which maintain the same allocation from month to month for a more consistent, long-term approach. By studying this broad range of investment strategies, Recipe Investing aims to help the investor identify portfolios that balance high returns with lower risk over time, a goal shared by every thoughtful and disciplined investor.
The results for the month ending October 31st reveal a mixed landscape across tactical asset allocation portfolios. An examination of one-month performance data highlights both significant underperformers and standout winners.
October 2025 Tactical Portfolio Highlights: Winners and Underperformers
Notable Underperformers

Among the poorest performers for the month, Berkshire Hathaway (BRK.A), a widely respected stock, encountered difficulties. More concerning is the AGF U.S. Market Neutral Anti-Beta Fund (BTAL), which has delivered consistently disappointing results:
- Ten-year annualized return: -2%
- Year-to-date performance: down over 20%
- Persistent negative returns across multiple periods
While the fund deserves recognition for maintaining its stated mandate, presumably seeking market neutrality, a strategy that consistently trends downward fails to serve as a viable investment option for most investors.
Top Monthly Performers
Shifting focus to the strongest performers reveals several tactical portfolios that delivered impressive results. These tactical strategies, identified by the "t." prefix, reallocate monthly with changing underlying ETFs.

The Quartile Sector Rotation (t.srqr), a highly concentrated single-fund recipe, stands out with exceptional performance. Despite experiencing a maximum drawdown of at least 50% at some point during the past 15 years, the strategy has delivered over 24% annualized returns on a compounded basis over that same period, ranking it among the highest performers tracked. Other momentum-based tactical portfolios also showed strength, including Top 5 Sector Rotation (t.srt5) and Top 3 Sector Rotation (t.srt3).
Among professionally managed mutual funds, Calamos Convertible (CCVIX) demonstrated a robust performance across multiple timeframes:
- One-month return: 4.1%
- Year-to-date gain: 22%
- Twenty-year annualized return: 7.6%
- Maximum drawdown: 31%
These results underscore the value of strategic portfolio allocation and the importance of evaluating investments across various time horizons.
How the Calamos Convertible Fund Compares to the S&P 500 and Balanced 60/40 Portfolio
Examining the Calamos Convertible Fund provides a useful case study in understanding how risk and return interact over time. This fund invests primarily in convertible securities, giving it characteristics of both stocks and bonds.
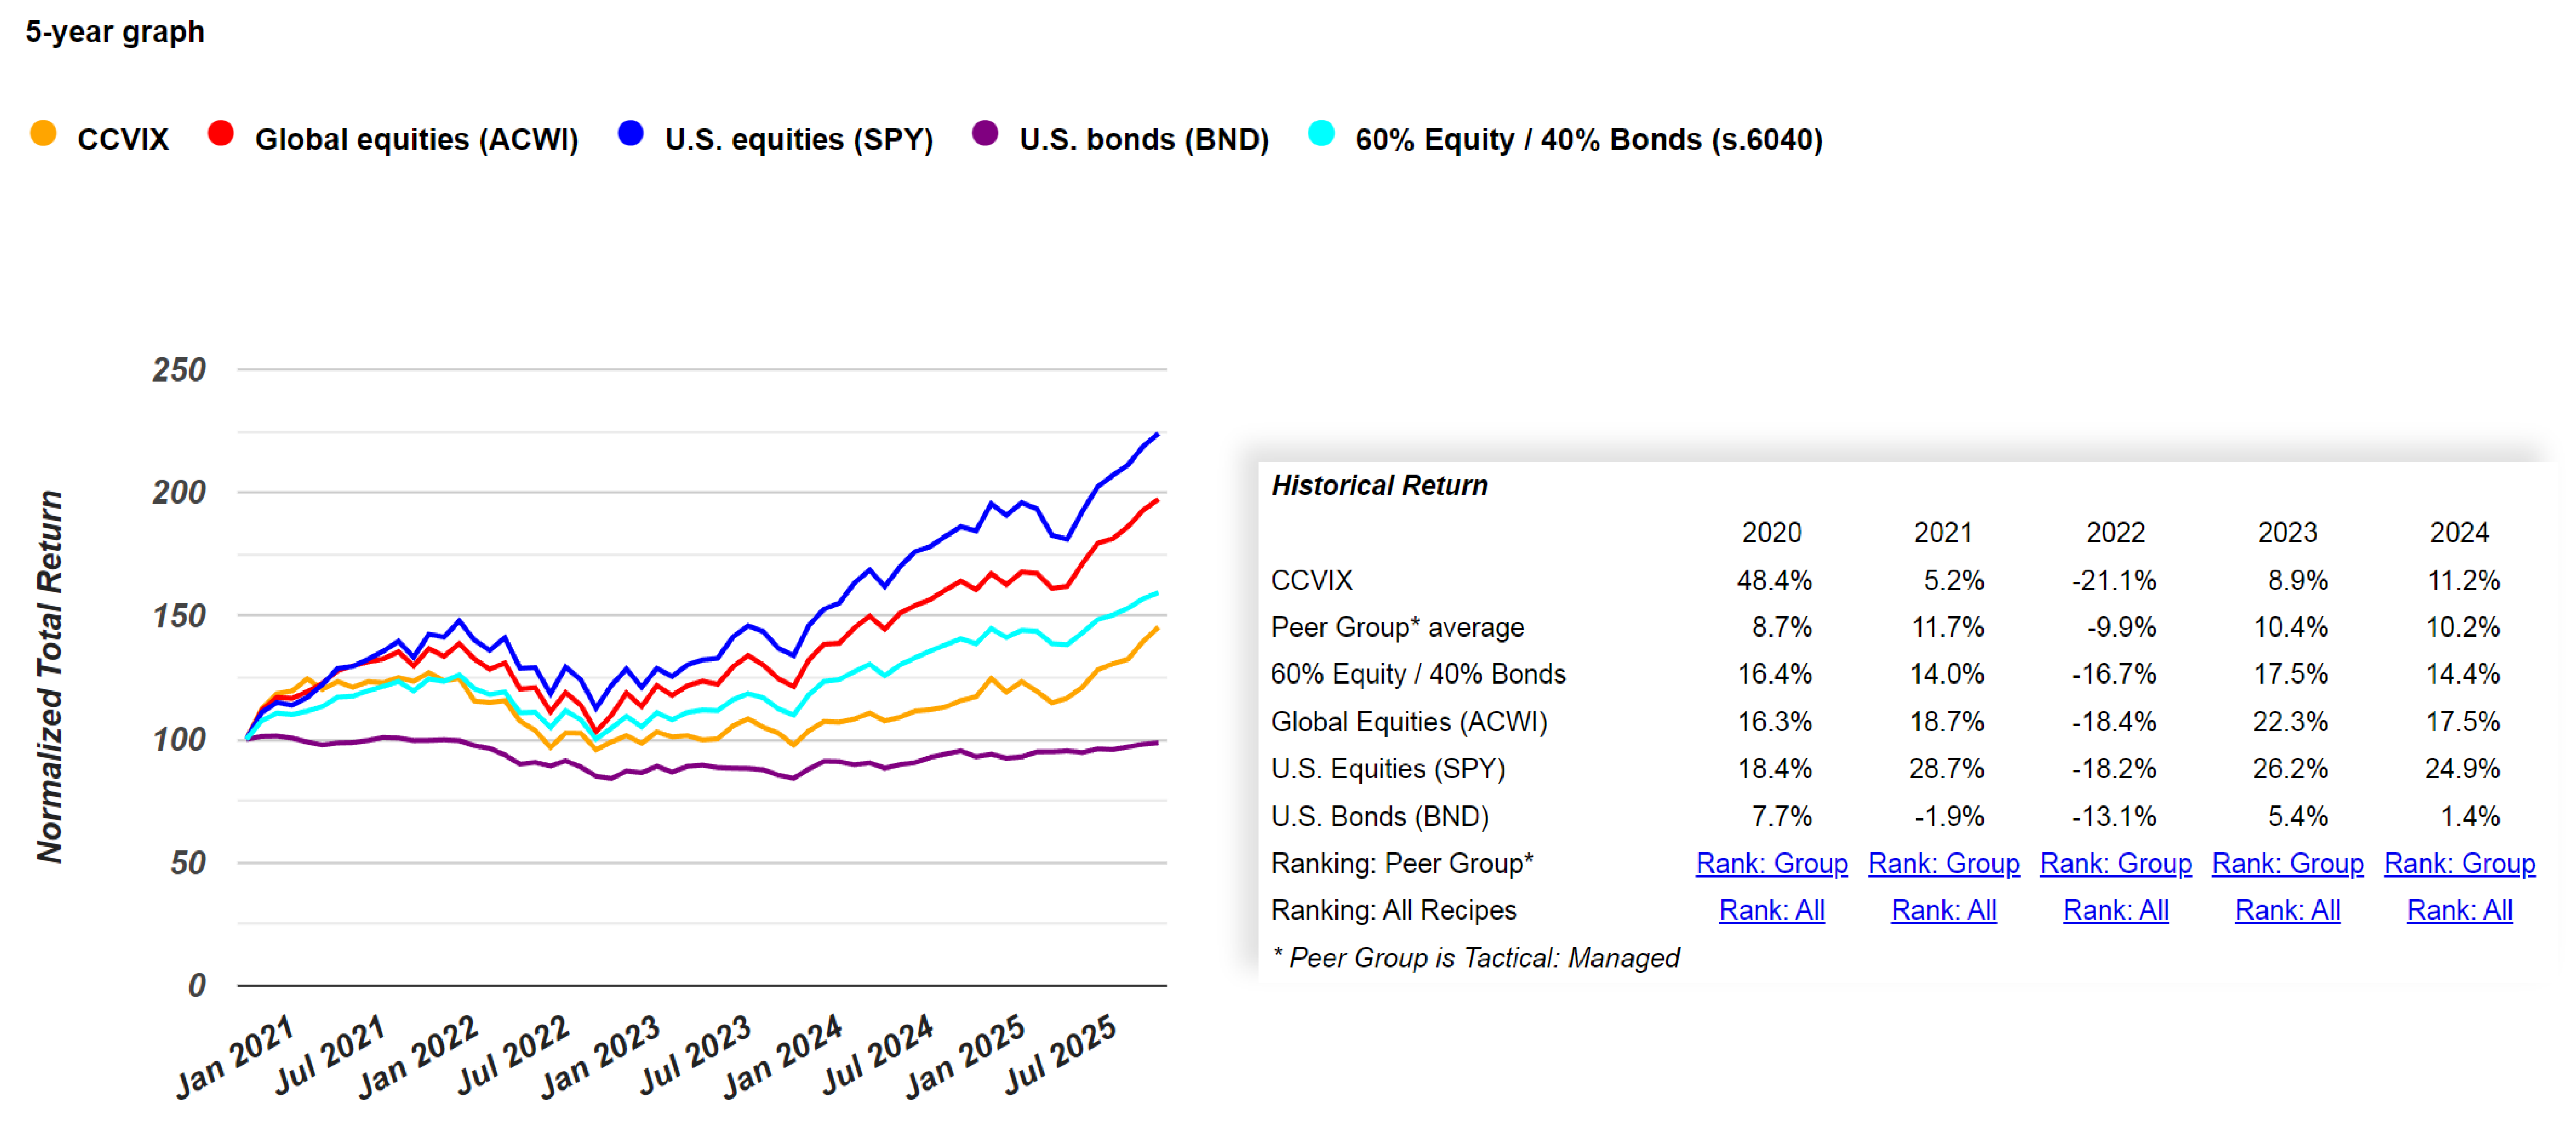
When compared against the S&P 500 (SPY) benchmark, the fund’s performance has shown periods of strength and weakness. Over the past five years, for example, the orange line representing CCVIX on the performance chart trails the blue line of the S&P 500. While the broader market has seen sharper declines at times, the fund’s recovery has been uneven. Notably, CCVIX underperformed the S&P 500 in 2022, indicating some vulnerability during volatile periods.
One of the most insightful ways to evaluate the fund’s performance is through scatter plots that show risk versus return across all portfolio recipes tracked by Recipe Investing.
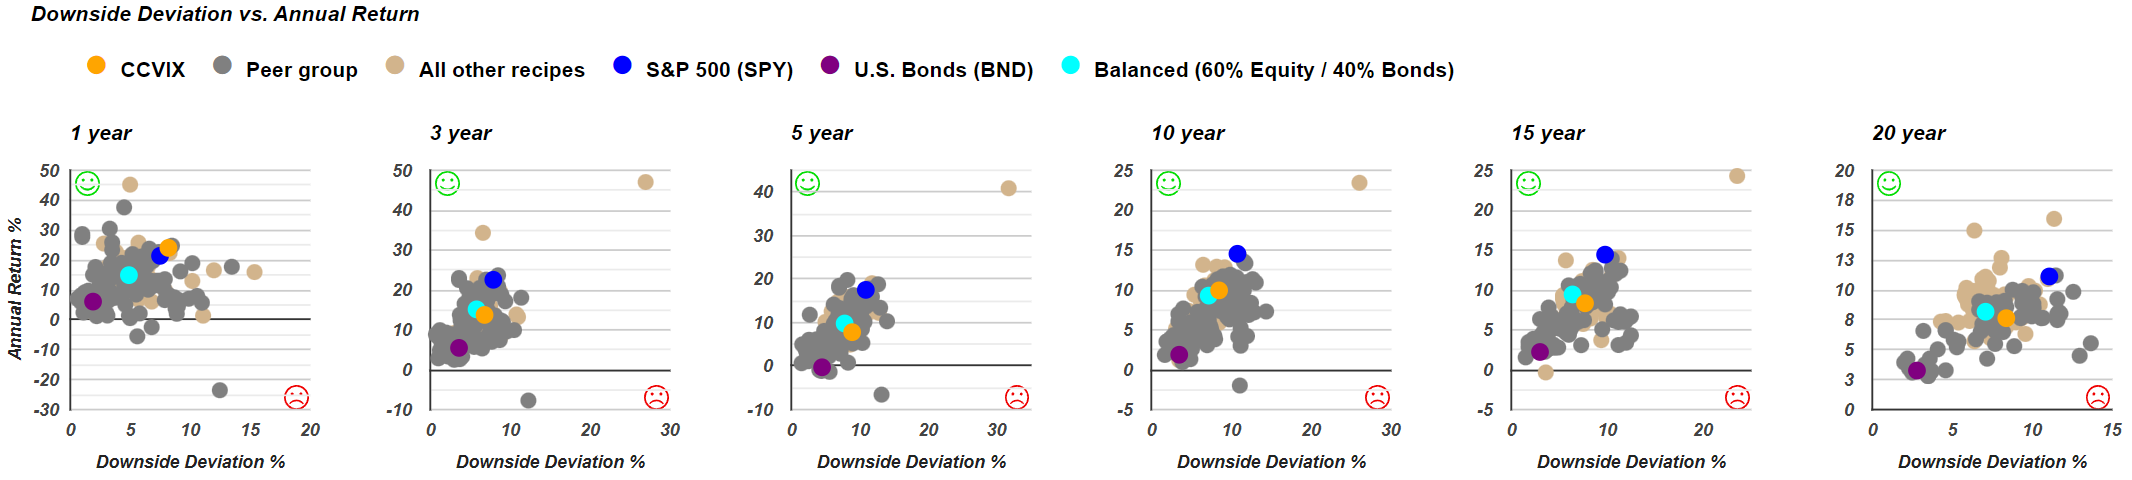
- On the one-year chart, the orange dot (CCVIX) appears above and to the right of the blue dot (S&P 500). This position means the fund took on greater risk and achieved slightly higher returns, a trade-off that aligns with expectations but isn’t particularly compelling in terms of efficiency.
- Over a three-year period, the fund’s position is lower return with higher risk compared to the Balanced 60/40 (s.6040) portfolio, represented by the teal dot.
- Across five years, this pattern remains consistent.
- At the ten-year mark, CCVIX performs modestly better than the 60/40 benchmark.
- Over 15 and 20 years, however, it falls below and to the right of the 60/40 portfolio, indicating higher downside risk and lower returns over the long term.
These results suggest that while CCVIX has moments of outperformance, its long-term risk-adjusted returns lag behind more balanced strategies. Although the Calamos Convertible Fund has delivered positive returns in certain timeframes, the broader data show a higher level of risk without a consistent reward premium. The appeal of the fund’s “shine” fades somewhat under deeper analysis. This is precisely why Recipe Investing emphasizes not just quick performance overviews, but also detailed risk–return evaluations.
An investor’s capital is limited, and chasing recent gains without understanding the underlying volatility can lead to disappointing results. While past performance is never a guarantee of future results, historical behavior offers valuable insight into how a fund may respond under different market conditions. By comparing multiple time horizons and risk metrics, an investor can make more informed, disciplined decisions, focusing not just on returns, but on how efficiently those returns are achieved.
Permanent Plus Portfolio: A Strategic Approach to Steady Long-Term Performance
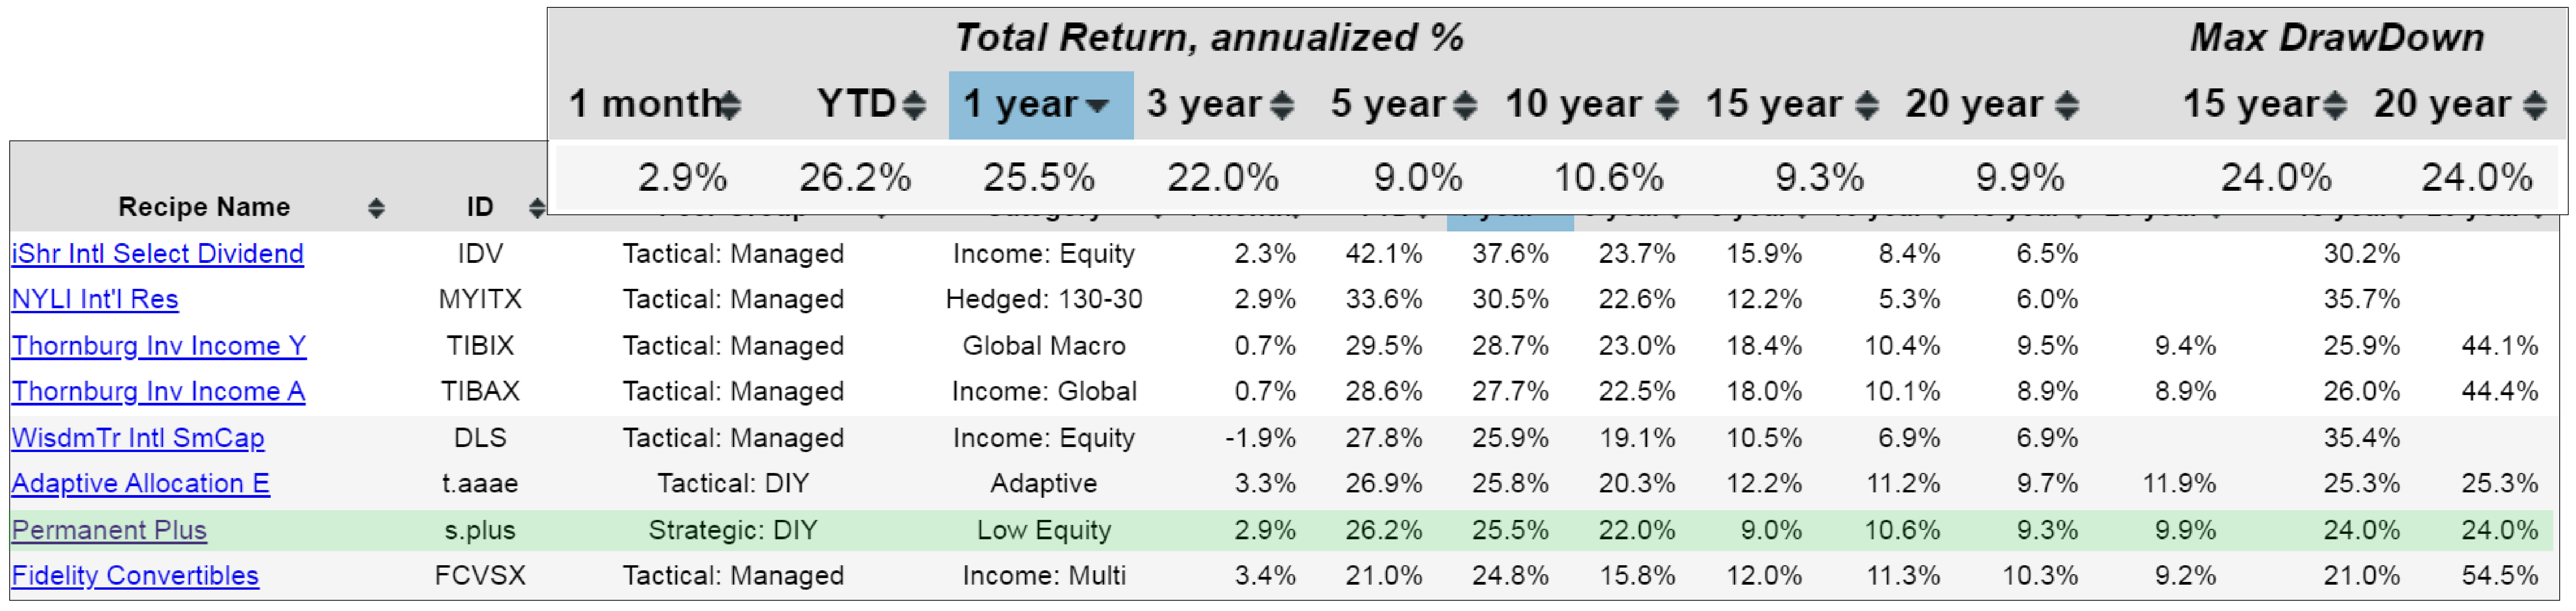
Shifting the analysis to one-year performance reveals a notable standout among the top performers. The Permanent Plus portfolio (s.plus), positioned approximately four to seven lines down in the rankings, deserves particular attention for its consistent performance characteristics.
The "s." prefix at the beginning indicates this is a strategic portfolio, a term preferred over "static," and certainly not to be confused with "stagnant." While the portfolio's component holdings remain constant, monthly rebalancing maintains optimal allocation. Investors holding this portfolio could likely rebalance quarterly without significantly impacting overall returns.
The Permanent Plus represents a modified version of the Harry Browne portfolio, investing across three exchange-traded funds. Notably, the portfolio excludes the traditional fourth cash component. While cash does provide stability, historical analysis demonstrates it tends to drag down overall portfolio performance. The term "Permanent Plus" carries a certain irony: by subtracting a component from the original framework, the portfolio has actually achieved higher returns, hence the "Plus" name.
The portfolio's track record presents compelling statistics:
- Maximum drawdown over 20 years: 24% (occurring within the past 15 years)
- Annualized return over 20 years: over 9%
- Trailing 12-month return: 25.5%
These figures position Permanent Plus as an intriguing option for investors seeking a "set it and forget it" portfolio that has delivered consistent performance over time. However, consistency does not mean absence of volatility.
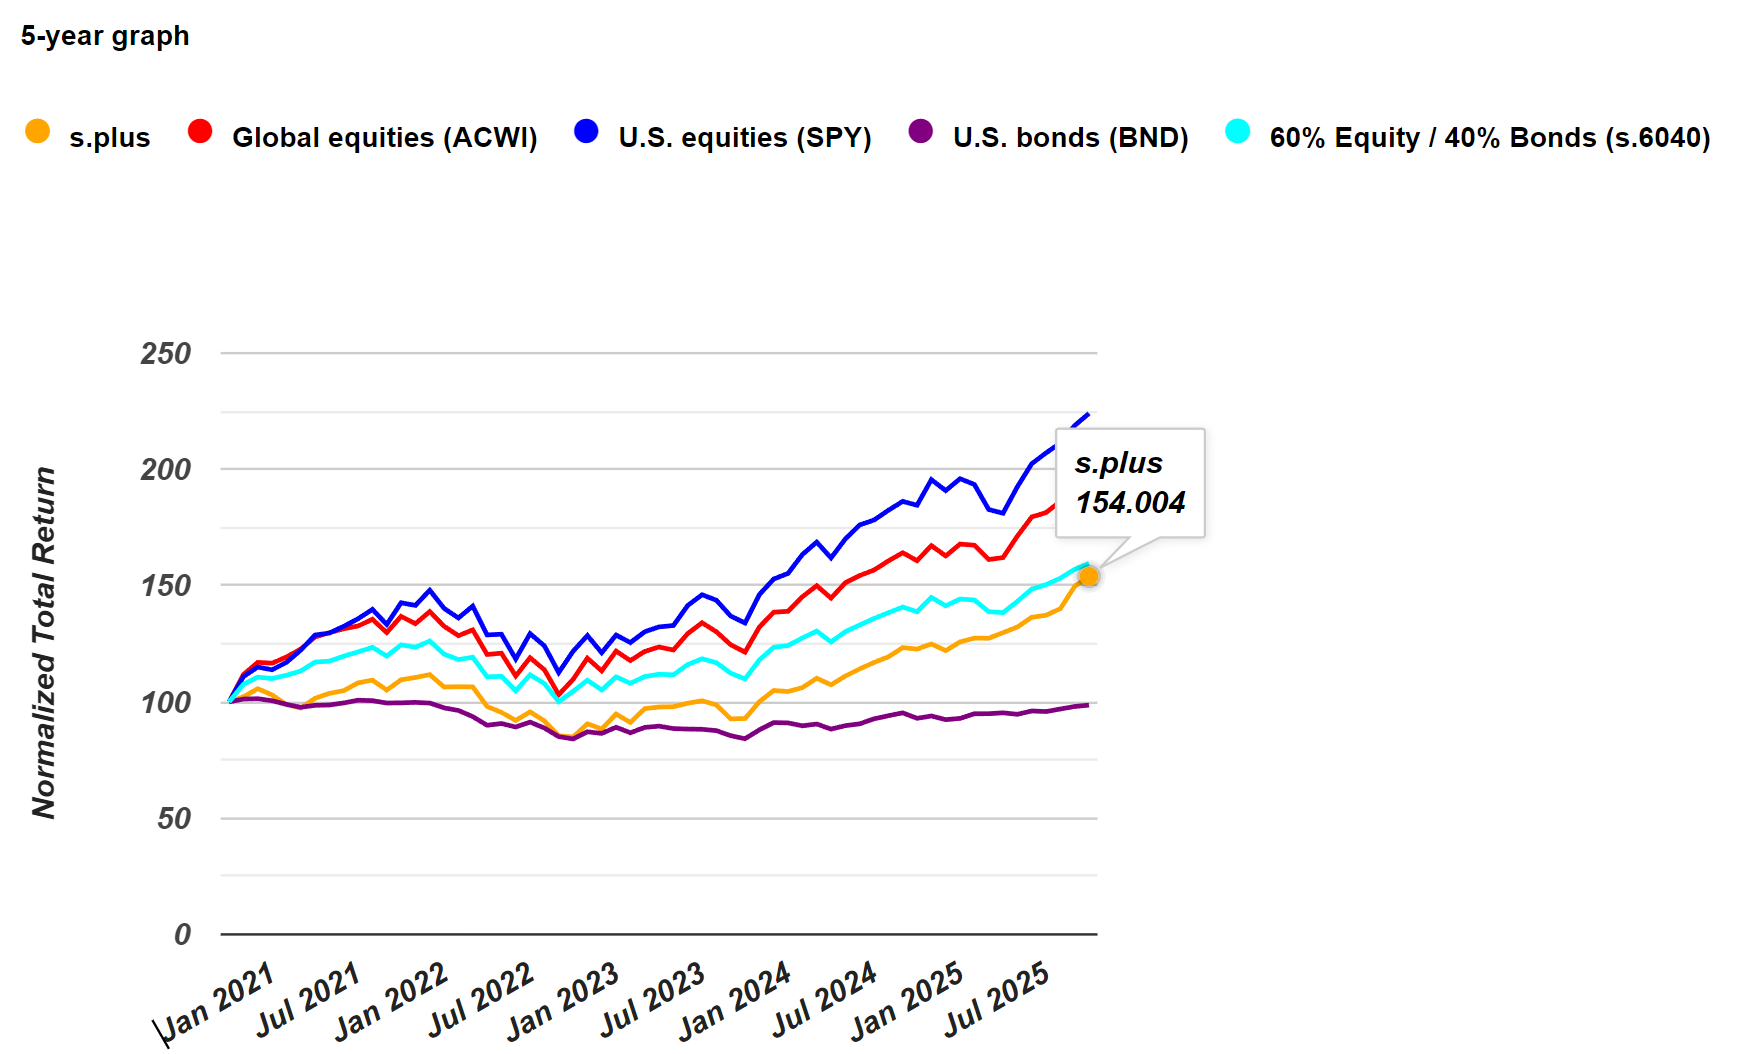
Examining the five-year chart reveals periods of meaningful drawdown that investors must be prepared to tolerate. The portfolio has experienced extended periods of underperformance before recovering. While it ranks well below the top performers in absolute return terms, particularly when compared to the S&P 500, this comparison requires important context.
The S&P 500 represents a pure equity investment that has experienced a 50% maximum drawdown over the past 20 years, carrying considerably more risk than a diversified strategic allocation. The Permanent Plus portfolio offers a different value proposition: lower volatility and reduced maximum drawdown in exchange for more moderate returns. For investors prioritizing capital preservation alongside growth, this tradeoff may prove attractive, particularly for those uncomfortable with the dramatic swings inherent in pure equity exposure.
Strong Performers and Key Insights from iShares ETFs
As part of Recipe Investing’s analysis, the research also extends beyond portfolio recipes to include a wide range of mutual funds and exchange-traded funds (ETFs) from major fund families. Subscribers with Pro access can explore in-depth data and analysis across these funds, but even a general overview offers valuable insights into current market trends.
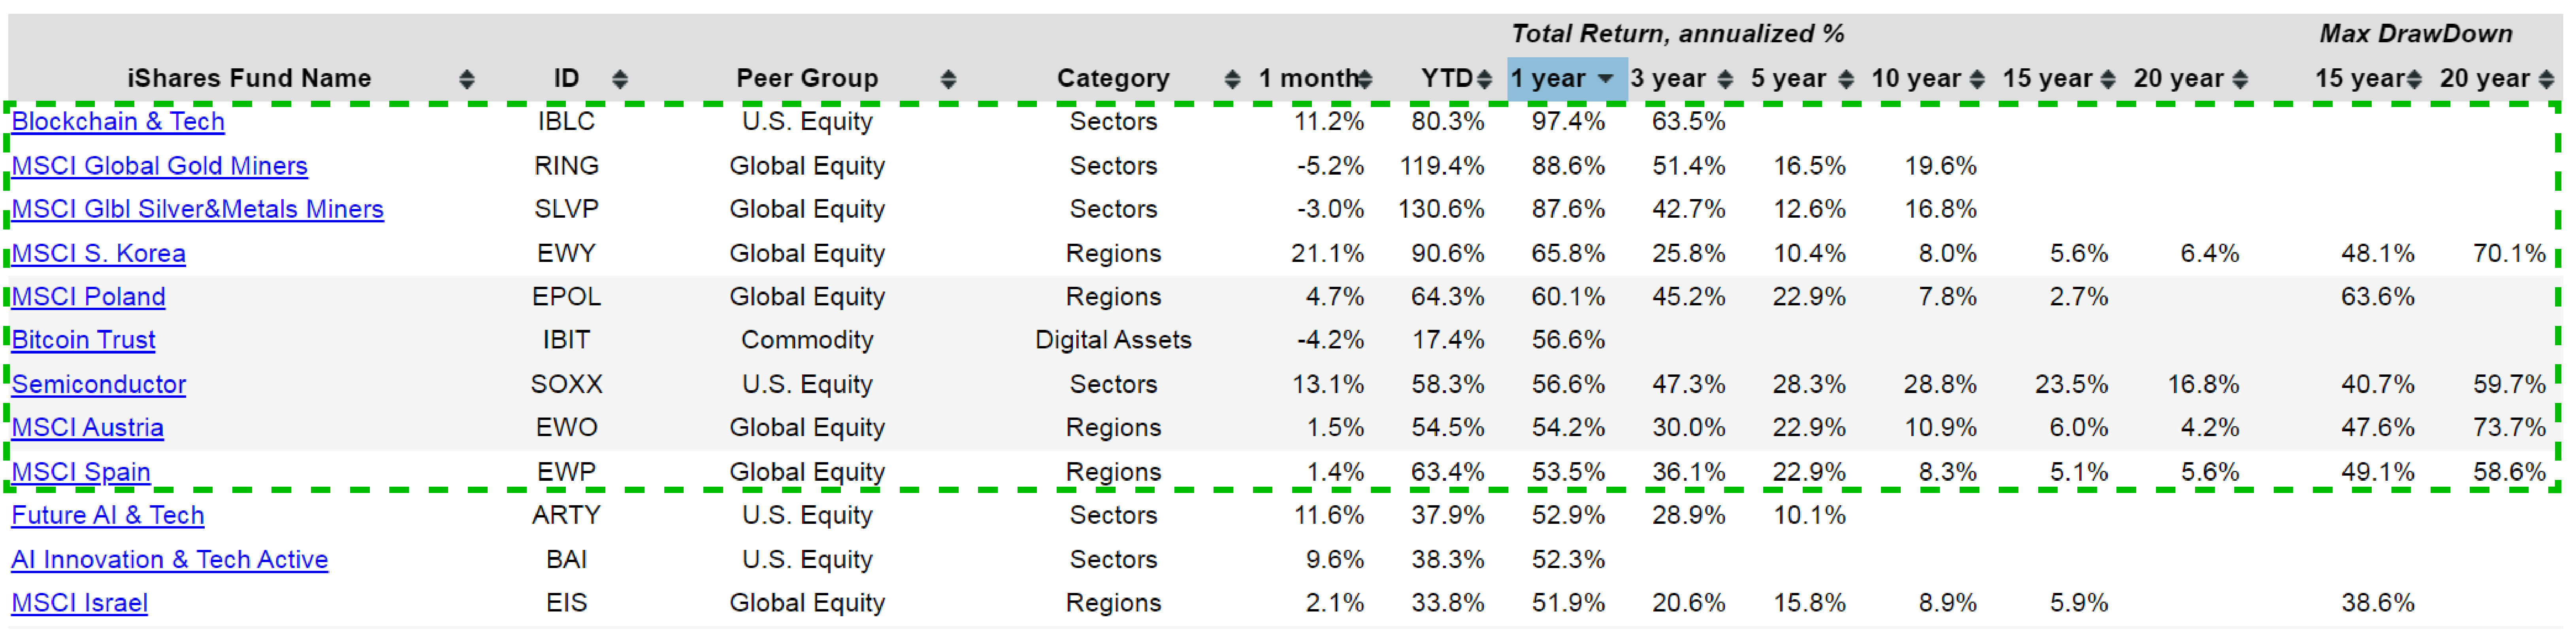
Among the iShares ETF family, several funds have delivered remarkable one-year returns, revealing clear thematic strengths. Some of the top-performing areas include:
- Regional markets: South Korea, Poland, Austria, and Spain have all performed exceptionally well.
- Sectors: Semiconductors, cryptocurrency, bitcoin, and blockchain ETFs have also shown impressive gains over the past year.
However, while these results are eye-catching, it’s important to recognize the volatility behind them. Many of these funds lack long performance histories, making it difficult to evaluate their behavior across full market cycles.
For instance, the South Korea ETF has performed strongly in the past month, but over the past 20 years, it once experienced a staggering 70% drawdown. Despite this, it still achieved a 6.4% annualized return over that same period. The resilience is notable, but the level of historical volatility is significant.
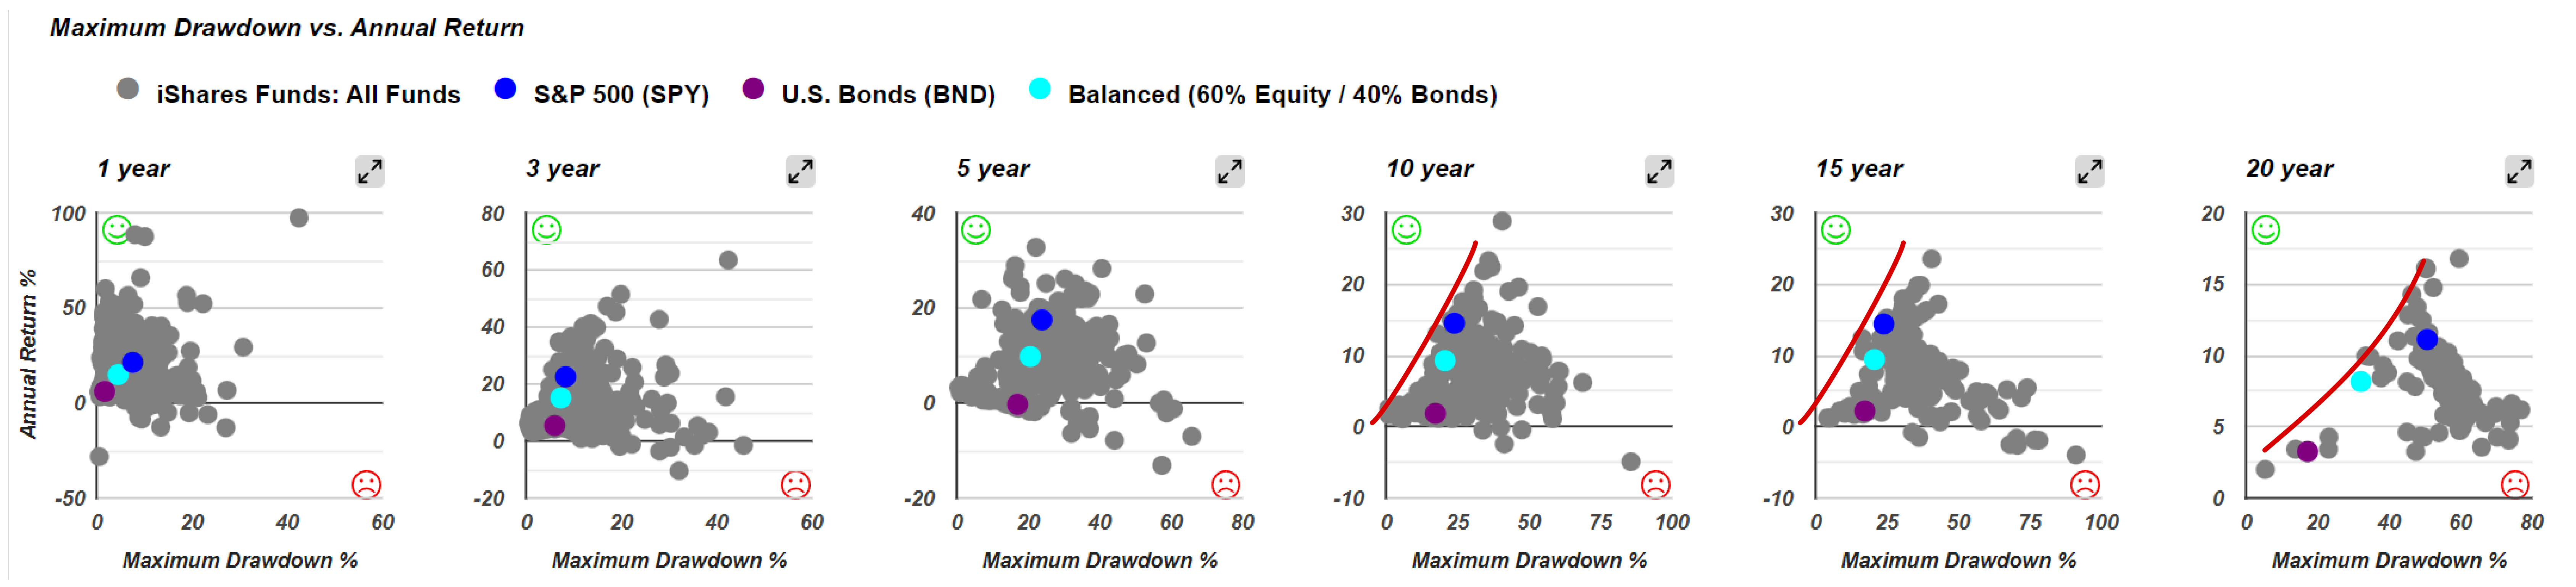
When examining iShares ETFs across different time horizons 10, 15, and 20 years, a clear risk–return frontier emerges. This frontier illustrates the natural limit that most standalone ETFs face:
- Funds positioned along this curve demonstrate the typical balance between higher risk and higher return.
- Only tactical or dynamically managed portfolios, those that shift allocations based on algorithms or market conditions tend to break beyond this boundary.
In other words, unless a portfolio employs a tactical allocation strategy, performance generally remains confined within this risk–return curve.
Final Observations
Over shorter periods, such as five years or less, variability among ETFs is much greater. But over decades, these differences tend to even out, reinforcing the long-term relationship between risk, return, and portfolio structure. Overall, this analysis of iShares ETFs underscores both the opportunities and the limitations within the ETF landscape. Tactical diversification and disciplined rebalancing remain key tools for investors seeking to optimize performance while managing risk. As Recipe Investing continues its monthly reviews, these insights form part of a broader effort to understand how individual funds and complete portfolio “recipes” behave over time, helping investors make informed, data-driven decisions.