
2025 Momentum ETFs, Convertible Securities, and Portfolio Customization
Momentum ETF Analysis, Convertible Securities Performance, and Portfolio Customization Strategies (August 2025)
Topics this month
- Invesco Dorsey Wright Momentum: Performance Analysis vs. S&P 500
- Convertible Securities Fund Analysis: Risk-Return Performance Review
- Tactical Adaptive Asset Allocation: Strategy Performance Overview
- Portfolio Substitution Strategies: Customizing Investment Recommendations
- Monthly Publication Schedule and Trading Considerations
Welcome to the August 2025 commentary from RecipeInvesting.com. For this commentary, we’re examining portfolio performance for the period ending July 31, 2025. Using the Pro subscription—which includes additional insights such as analysis of Vanguard, Fidelity, iShares, and American Funds—we’ll explore the latest results and trends across our portfolio recipes. Even for those on the Investor (base) plan, this commentary provides valuable insights into how different portfolios have performed and what the data reveals about current market conditions.
The Recipe Summary page provides a comprehensive overview of all tracked tactical asset allocation portfolios. This dashboard allows investors to quickly identify which portfolios have underperformed and which have excelled over specific time periods, such as the past month.
When sorting portfolios by one-month returns, one particular fund stands out with a remarkable 4.3% return—significantly ahead of the next best performer at 2.8%. This standout performer is the Invesco Dorsey Wright Momentum ETF, trading under the ticker PDP.
Invesco Dorsey Wright Momentum: Performance Analysis vs S&P 500
The Invesco Dorsey Wright Momentum (PDP) topped all tactical asset allocation portfolios for July 31st, showing strong long-term numbers with a 15-year annualized return of 12.7%, 1-year return of 15%, and 1-month return of 4.3%.
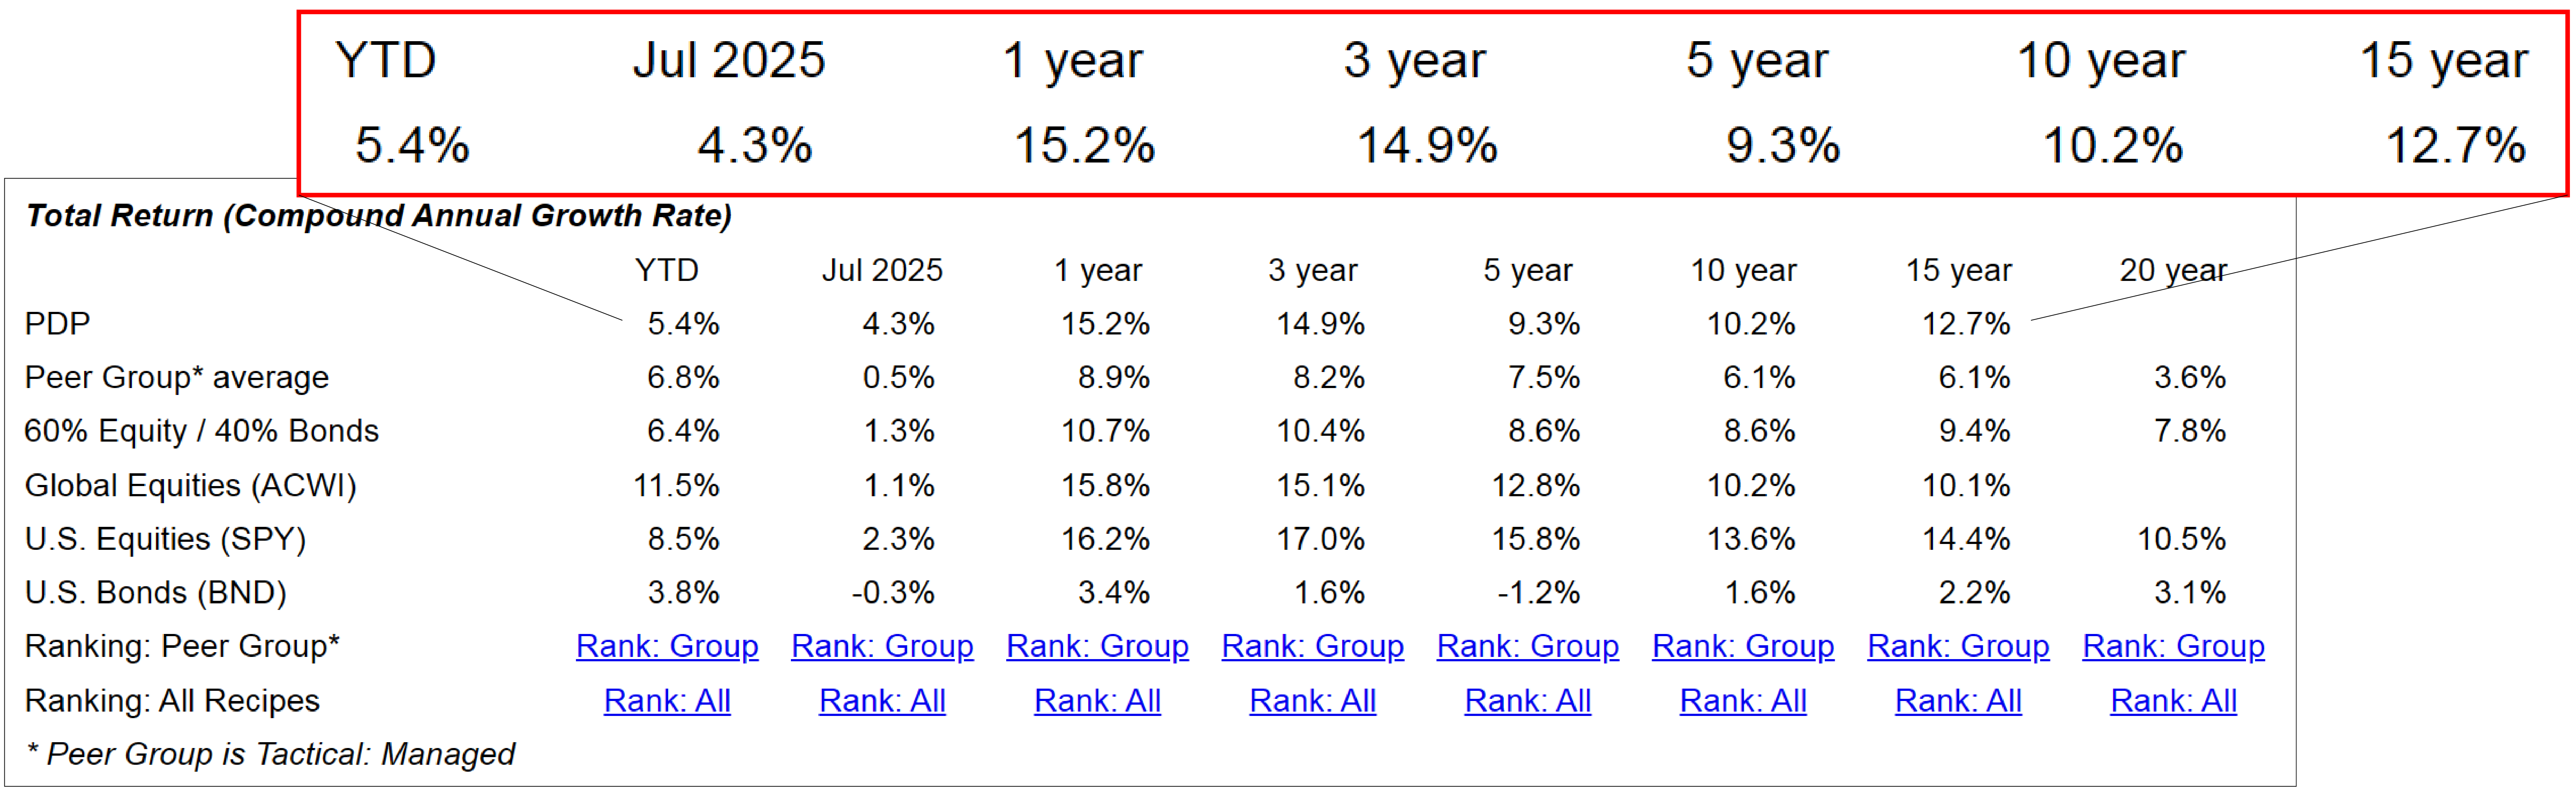
However, deeper analysis reveals concerning patterns when compared to the S&P 500 (SPY). While PDP's surface performance appears impressive, it consistently underperforms SPY across all time horizons while carrying higher risk.
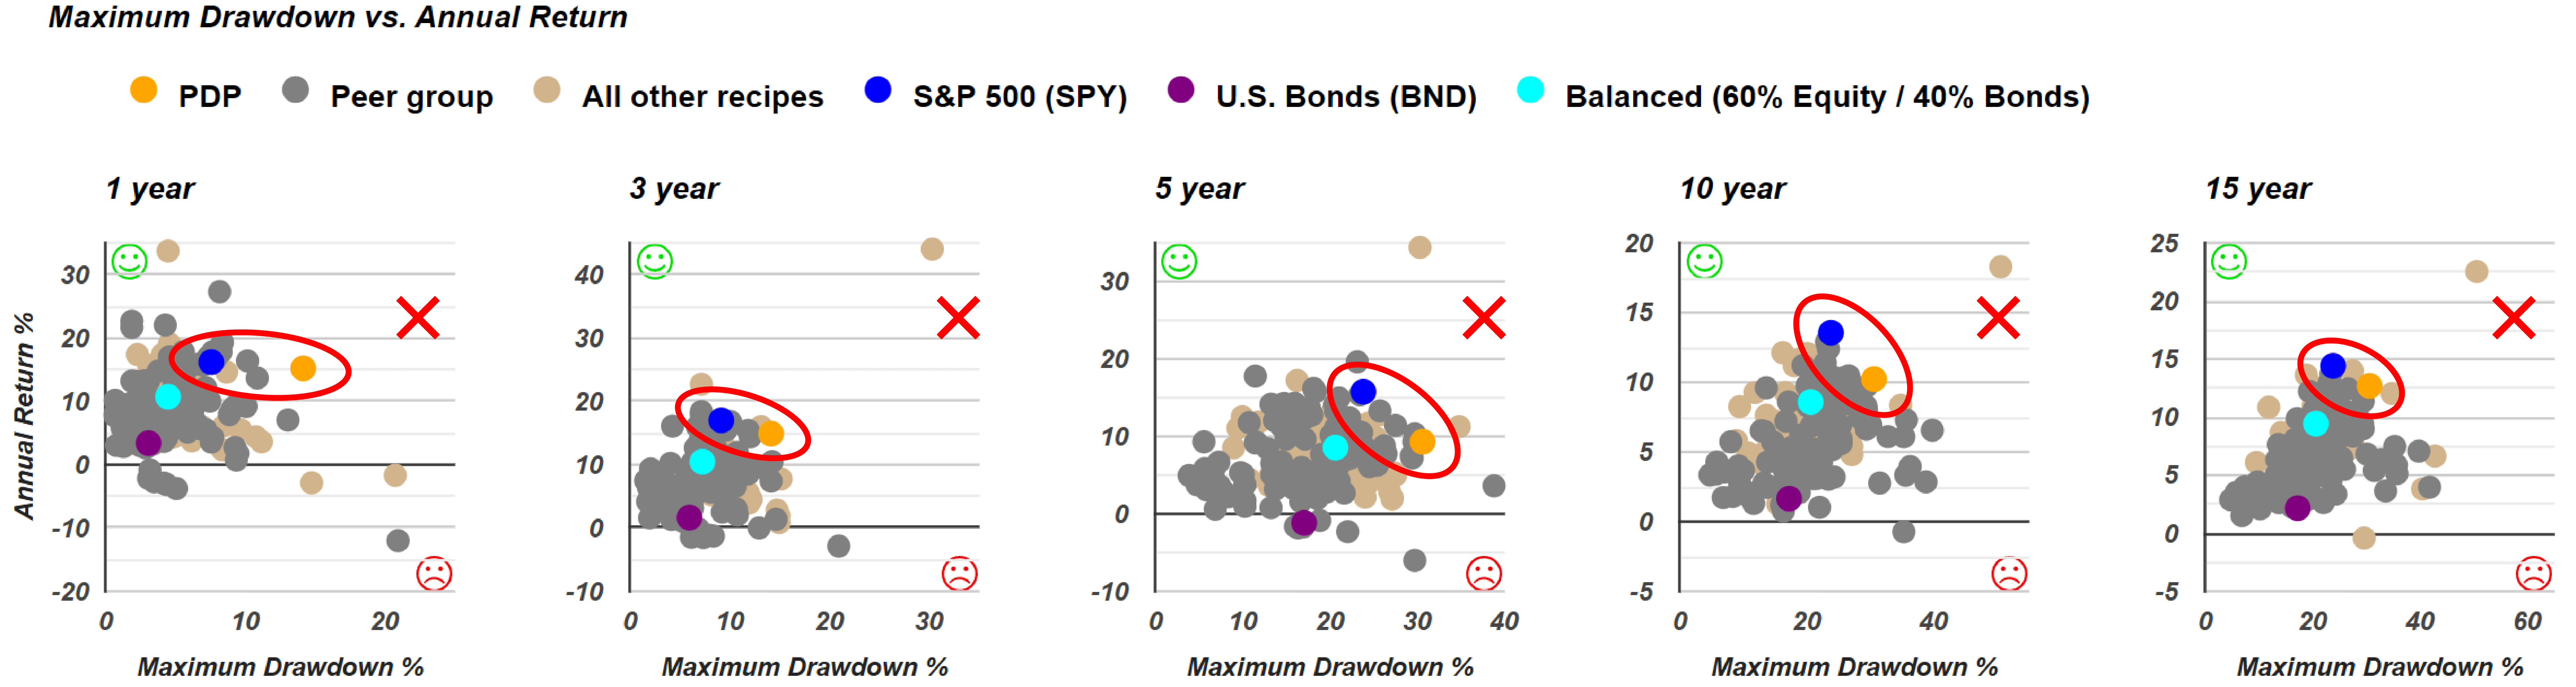
Over the past decade, PDP experienced a maximum drawdown of approximately 30% compared to the S&P 500's 24%. More troubling, PDP shows:
- 1-year period: Lower returns with 12-13% drawdowns versus SPY's sub-10%
- 3 and 5 years: Increasingly inferior risk-adjusted returns
- Consistent underperformance: Across all analyzed timeframes
Despite being a top tactical performer, PDP's active management fees aren't justified by its risk-adjusted returns. The fund fails to earn its keep against the S&P 500 benchmark, suggesting investors might achieve better results with lower-cost index alternatives.
Convertible Securities Fund Analysis: Risk-Return Performance Review
Convertible securities funds are having a standout month, with the Invesco Convertible Securities (CNSDX) ranking among the top three performers. Positions two through four are all occupied by convertible funds, highlighting this asset class's current strength.
Convertible securities offer a unique hybrid structure—bonds that provide fixed income with the option to convert to equity when advantageous. This combination delivers bond-like stability with equity upside potential, essentially creating its own distinct asset class.

CNSDX has delivered strong results with a 17% return over the past year and an 8.1% average annual return over its 20-year track record. However, volatility considerations include:
- 15-year maximum drawdown: 20%
- 20-year maximum drawdown: 36.3%
While losing over one-third of value on paper is concerning, context matters. The S&P 500 experienced a maximum drawdown exceeding 50% during the same 20-year period, making the convertible fund's volatility relatively moderate. Convertible securities funds are dominating this month's top performers, with Invesco Convertible Securities (CNSDX) among the top three. This asset class offers a unique hybrid structure—bonds with equity conversion potential, delivering fixed income stability with upside opportunity.
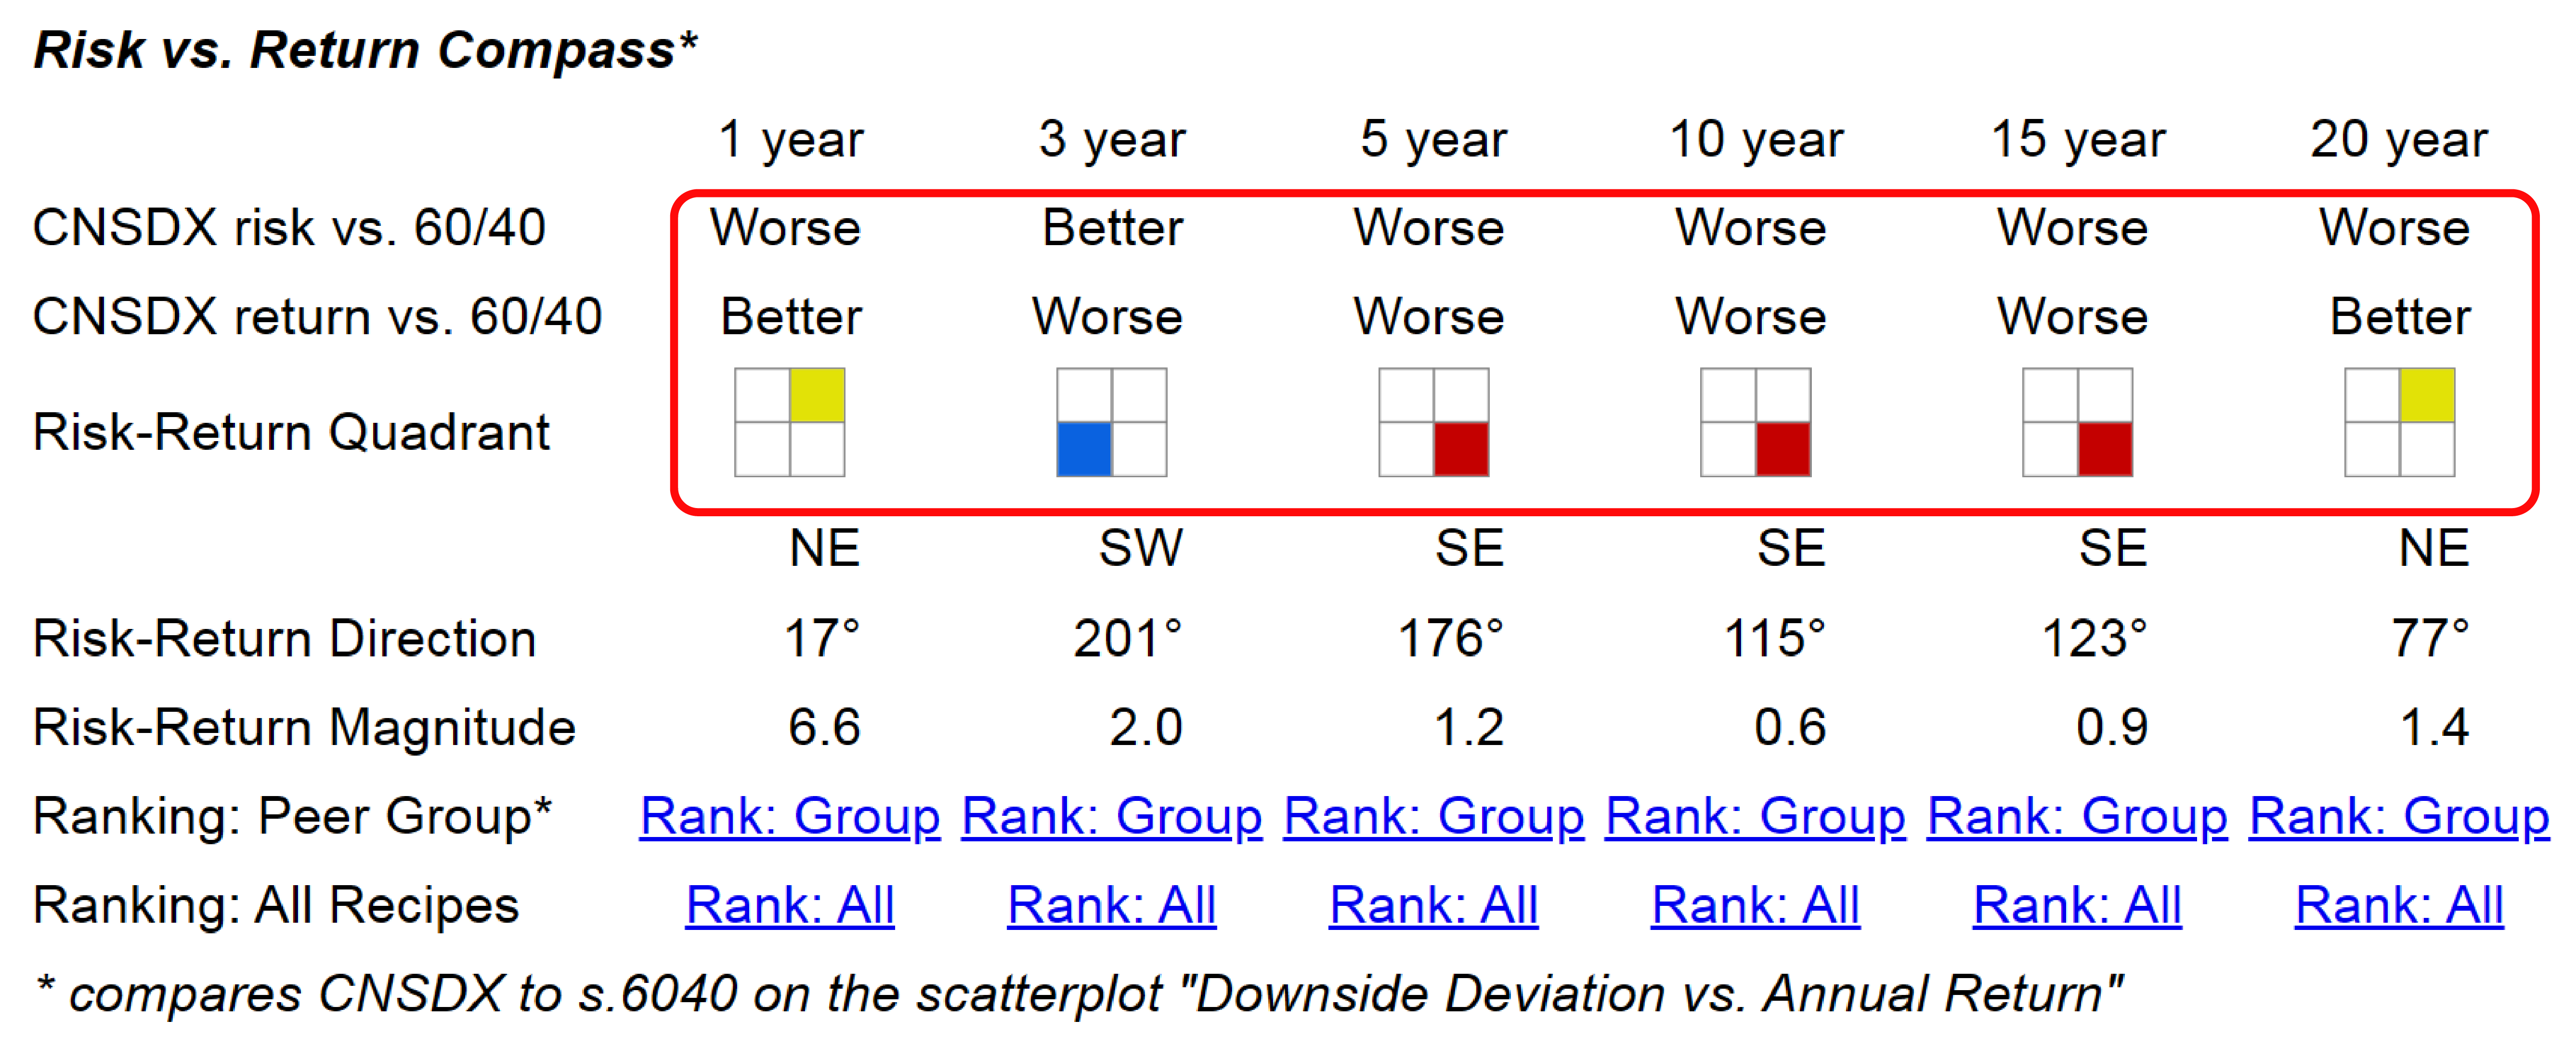
Using downside deviation (which only penalizes negative volatility), the fund shows varying risk-return relationships across timeframes. Over the past year and 20-year period, it demonstrates higher risk with higher returns versus a 60/40 portfolio, while showing lower risk and lower returns over three years. However, the 5, 10, and 15-year periods reveal slightly worse risk-adjusted performance compared to balanced allocation strategies.
The analysis reveals several alternatives worth considering, including the S&P 500 with its higher risk and higher long-term returns, Pure Momentum Portfolios offering significantly higher risk-return profiles for aggressive investors, and Adaptive Allocation F as a popular choice delivering higher returns with lower risk. The traditional 60/40 Balanced Portfolio serves as a moderate risk-return benchmark for comparison. While convertible securities funds demonstrate solid fundamentals and current appeal, investors should evaluate them against relevant alternatives based on their risk tolerance and return objectives rather than relying solely on headline performance figures.
Tactical Adaptive Asset Allocation: Strategy Performance Overview
Tactical adaptive asset allocation portfolios (t.aaa series) consistently rank among top performers, offering valuable insights into current market strategies and risk-return trade-offs.
Strategy Mechanics
The "t." prefix indicates monthly tactical rebalancing, while "aaa" represents Adaptive Asset Allocation using a two-step process:
- Momentum Analysis: Algorithm identifies strongest-performing ETFs from a pool of approximately nine funds
- Risk Optimization: Analyzes historical data to minimize risk across selected ETFs
The strategy offers flexibility through key variables: investment universe selection, momentum lookback periods, risk analysis timeframes, and risk minimization techniques. These explain why six variants exist (t.aaaa through t.aaaf), each optimized for different conditions.
Performance Spotlight: t.aaaf
The t.aaaf variant has become a "fan favorite" due to exceptional risk-adjusted performance over 20 years:
Risk Management:
- Maximum drawdown: 18.9% over 20 years (recently increased from ~14-15%)
- Exceptional downside protection
Returns:
- 14% annualized return (20 years)
- 13.6% annualized return (15 years)
- 13.4% return (past 12 months)
Other variants like t.aaaa show slightly higher risk with marginally lower long-term returns but superior recent one-year performance, highlighting that no single strategy consistently outperforms across all periods.
The consistent top-tier performance of these systematic, algorithm-driven approaches demonstrates their effectiveness across varying market conditions. However, different variants may outperform during different cycles, emphasizing the importance of understanding each strategy's parameters and risk characteristics rather than relying solely on monthly rankings.
Portfolio Substitution Strategies: Customizing Investment Recommendations
Investors can customize recommended portfolio strategies through substitutions while maintaining the core strategic framework. The Quartile Sector Rotation (t.srqr) strategy exemplifies this flexibility—it holds one mutual fund at a time, rotating quarterly based on performance rankings, refined over 15 years of implementation.
Three Substitution Approaches
1. Mutual Fund Substitutions Investors can substitute recommended mutual funds with alternatives offering superior performance, lower fees, or enhanced features. Thorough analysis should guide these decisions, comparing historical performance, expense ratios, and fund characteristics.
2. ETF-to-Mutual Fund Substitutions With numerous new ETFs available, investors should analyze:
- Historical performance and volatility metrics
- Expense ratios and trading costs
- Liquidity characteristics
If ETFs outperform recommended mutual funds across relevant metrics, substitution is advisable.
3. Advanced Deconstruction Strategy The most sophisticated approach involves deconstructing recommended ETFs to select individual securities. For example, if t.aaaF recommends 20% large-cap allocation via an ETF, investors can:
- Analyze the ETF's underlying holdings
- Select superior individual companies
- Construct a custom portfolio maintaining the 20% allocation
This offers potential for enhanced returns and tax optimization but requires significantly more analysis effort.
Implementation Guidelines
Performance Tracking: Official metrics remain based on original recommendations for consistency, while investor results may exceed published figures through substitutions.
Strategic Focus: The system maintains focus on asset allocation at the fund level, with individual security selection left to investors choosing the advanced deconstruction approach.
All published performance numbers remain permanent once released, ensuring transparency and preventing retroactive adjustments.
Monthly Publication Schedule and Trading Considerations
Target Publication Timeline
Monthly allocation updates target 9:30 a.m. Eastern Time publication to provide investors with timely information before active trading begins. This timeline is most achievable when month-end falls on Friday, allowing weekend analysis for Monday morning publication.
Data Processing Constraints
Publication depends on external data availability following a specific sequence:
Mutual Fund Schedule:
- Trading completes at 4:00 p.m. Eastern
- NAV calculations occur 2-4 hours later
- Total return data becomes available 5:00-7:00 a.m. Eastern next day
Challenges: Quarter-end periods often see staggered data releases throughout morning hours, creating delays despite overnight processing time.
Analysis Process
Once data arrives, the process combines automated algorithms with human oversight:
- Automated algorithm execution using updated performance data
- Manual quality control checks
- Comprehensive analytics generation
- Portfolio allocation calculations
This hybrid approach requires substantial monthly effort beyond simple automation.
Trading Timing Considerations
For investors concerned about missing early trading, research suggests the first market hour typically experiences increased volatility, wider bid-ask spreads, and higher slippage potential. Many professionals recommend waiting 1-2 hours after the market opens for more stable pricing, improved spreads, and better execution prices. The publication process balances timeliness with analytical rigor. While the 9:30 a.m. target remains the goal, external factors may impact scheduling. The commitment focuses on delivering accurate, thoroughly analyzed recommendations rather than meeting arbitrary time constraints that might compromise quality.