'How I Would Invest $1,000,000 In Retirement': A Critical Analysis
'How I Would Invest $1,000,000 In Retirement': A Critical Analysis
Summary
- A finance influencer's $1 million retirement plan targets income and growth with a blue-chip dividend fund.
- We test this approach with data from Vanguard, Fidelity, and iShares funds to see if we can replicate this strategy’s performance over 20 years.
- Sustaining 4% withdrawals while growing the portfolio requires high returns—and higher risks.
- Alternatives like tech funds and tactical portfolios offer different risk-return profiles

A friend recently forwarded me a short video by Tyler Gardner, a former financial adviser, who has over a million followers on various social media channels. He had an interesting take on how to generate retirement income if you start with $1 million.
I know what you're thinking: I shouldn't be trolling social media for investing tips. Good point; I agree. But technically, I'm not following the advice, I'm reviewing it.
In this era of clickbait, I couldn't resist finding out what Tyler was serving up in his 96-second video.
Tyler's Approach
According to the video, here's how Tyler would invest $1 million in retirement:
1. "I would invest 100% of my money in a blue-chip, dividend fund that paid out about 3.5% in dividends each year."
2. In early January, sell 4% of my fund to generate cash.
3. Take social security at age 62 for another $25,000 per year of pretax income.
4. Watch the all-stock fund grow at the historical average of 8% per year, even after selling 4% annually. Tyler says, "in 16 years my initial $1 million should be worth closer to $3.49 million."
The Review
Could this really work? Hmm. Income without eroding the corpus: that's an investor's dream.
Let's break this analysis down into several parts:
Replication: Can we replicate Tyler's approach with a fund?
Performance: How would this approach have fared in real life, over the past 20 years?
Alternatives: What are alternatives to this approach?
I'll ignore the part about taking social security at 62, since that does not affect the portfolio or investment income that Tyler describes.
I'll also ignore the detail about the dividend fund paying "3.5% in dividends" since we're more concerned with total return and less concerned with the exact dividend payout percentage. After all, to generate income we could sell shares in a fund with a lovely, stable total return even if that fund doesn't pay a dividend. But we'll still look for blue-chip, dividend funds in order to follow Tyler's recommendation.
Replication: can we replicate the type of fund mentioned?
First up, what "blue-chip, dividend fund" would be good to use for this investing scenario? Let's look for blue-chip and dividend funds at Vanguard, iShares, Fidelity with at least 20 years of history. Here are six that meet the criteria and that we are already tracking.
iShares Select Dividend ETF (DVY)
Fidelity Blue Chip Growth Fund (FBGRX)
Fidelity Dividend Growth Fund (FDGFX)
Fidelity Equity Dividend Income Fund (FEQTX)
Fidelity Strategic Dividend & Income Fund (FSDIX)
Vanguard Dividend Growth (VDIGX)
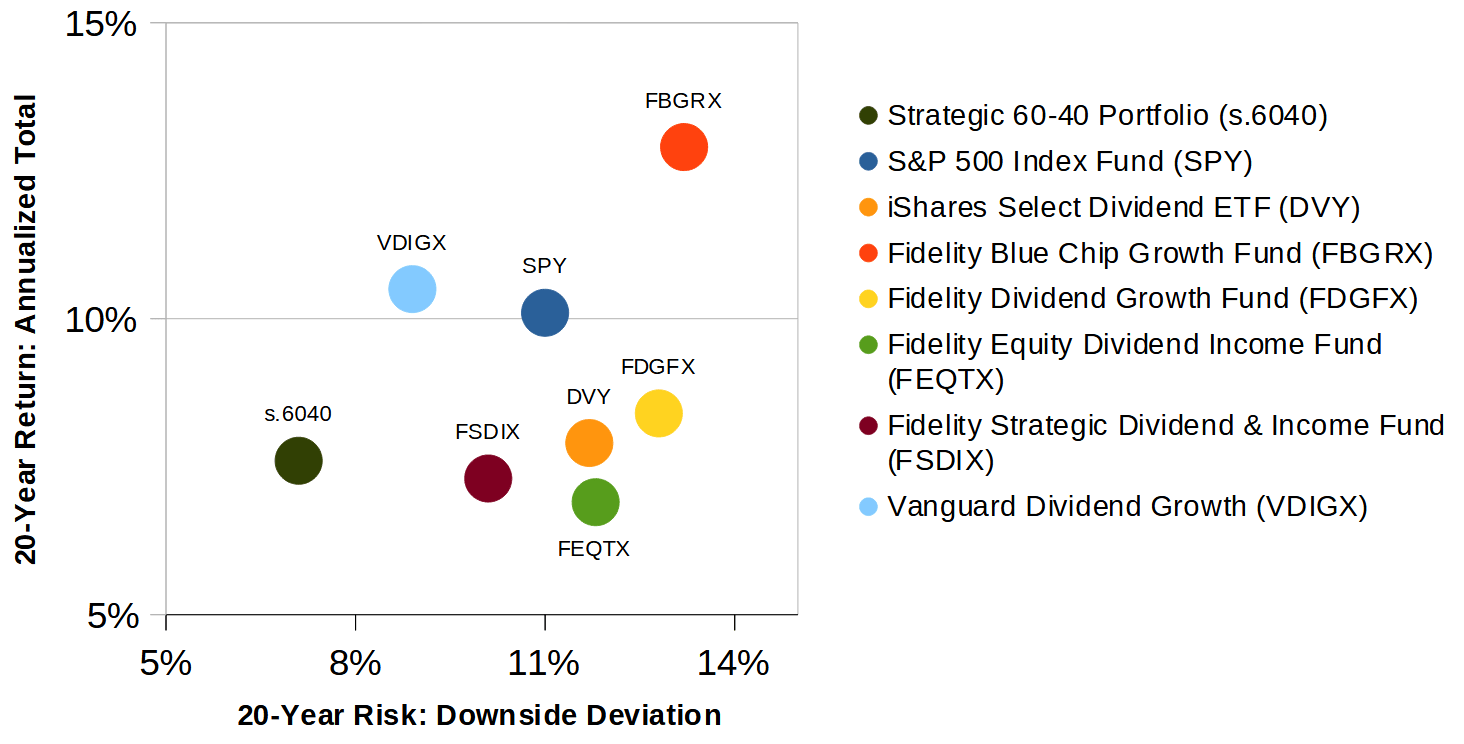
Let's look at the risk and return metrics for these six funds over the past 20 years. For comparison, we can also add two benchmarks: an S&P 500 fund (SPY) and a Balanced Portfolio consisting of 60% equities and 40% bonds (s.6040).
Exhibit A: Performance and risk for selected Blue Chip and Dividend Funds
Fund name | Fund ticker | Total annual return % (20 years) | Max Drawdown | Standard Deviation | Downside Deviation |
S&P 500 Index Fund (Benchmark) | 10.1% | 50.8% | 16.7% | 11.0% | |
Strategic 60-40 Portfolio (Benchmark) | 7.6% | 32.2% | 10.7% | 7.1% | |
iShares Select Dividend ETF | 7.9% | 57.5% | 16.6% | 11.7% | |
Fidelity Blue Chip Growth Fund | FBGRX | 12.9% | 48.8% | 21.1% | 13.2% |
Fidelity Dividend Growth Fund | FDGFX | 8.4% | 56.0% | 18.9% | 12.8% |
Fidelity Equity Dividend Income Fund | 6.9% | 56.1% | 17.1% | 11.8% | |
Fidelity Strategic Dividend & Income Fund | 7.3% | 54.8% | 14.4% | 10.1% | |
Vanguard Dividend Growth | VDIGX | 10.5% | 37.9% | 13.8% | 8.9% |
We can also look at the risk vs. return data in a scatterplot. Let's use Downside Deviation as the risk measure. We like to use Downside Deviation (instead of Standard Deviation) as the risk metric since Downside Deviation does not penalize for upward swings in performance, unlike Standard Deviation. Exhibit B plots the risk vs. return for the six portfolios plus two benchmarks.
According to Tyler, you can invest in a fund, take out 4% annually, and still have 8% annual return even after the 4% withdrawal. This would seem to require a 12% annual return: 4% for the annual withdrawal plus 8% for continued compound growth.
In Tyler's video, he provides specific details on this compounding effect. He says that "in 16 years my initial $1 million should be worth closer to $3.49 million." Let's double-check what interest rate (after withdrawals) would be needed to achieve that.
We can calculate the required annual interest rate. Let r be the interest rate we want to find. So if $1 million is multiplied by (1 + r) for 16 years, then we want to end up with $3.49 million to match Tyler's scenario.
So we have the following equation, which we can solve for r.
$1,000,000 * (1 + r) ^ 16 = $3,490,000
Solving this for r, we get 8.16%, which is close to the "average of 8% per year" that Tyler refers to, so his math checks out.
But which fund with "Dividend" in its name has a total return of around 12% annually? Looking back at Exhibit A, we couldn't find a single one at Fidelity, iShares, or Vanguard.
Should we stop here and mark this as a "BUSTED" myth? Or should we keep the investigation going? Let's continue by choosing a high-performing "blue chip" fund without strictly following Tyler's advice that the fund also be a "dividend fund." In other words, we can delete the "dividend" requirement but keep the "blue chip" requirement.
Based on the set of funds we've selected, that leaves us with Fidelity Blue Chip Growth Fund. Of course, there are many other "blue chip," large-cap funds without the exact words "blue chip" in their names, but let's run with FBGRX.
As we look closer at FBGRX, we see that it's tech-heavy, with a high level of risk. But FBGRX has posted solid returns over the past few years.
Performance: How would this approach have fared in real life?
Next, let's model Tyler's approach using FBGRX as the chosen fund. We'll see how this would have fared over the past 20 years.
In other words, if we started on Jan 1, 2005 with $1 million… what would we end up with on Dec 31, 2024?
Let's look at the following growth of $1 million over the past 20 years using these scenarios:
Scenario A. FBGRX total return with no withdrawals, for comparison.
Scenario B. FBGRX total return with 4% annual withdrawals. This is the withdrawal amount that Tyler proposes.
Scenario C. Vanguard Dividend Growth total return with 4% annual withdrawals. This is the best fund we found with "dividend" in its name, so this is the closest comparison to Tyler's proposed scenario.
Exhibit C: Growth of $1 million over the past 20 years, under three scenarios
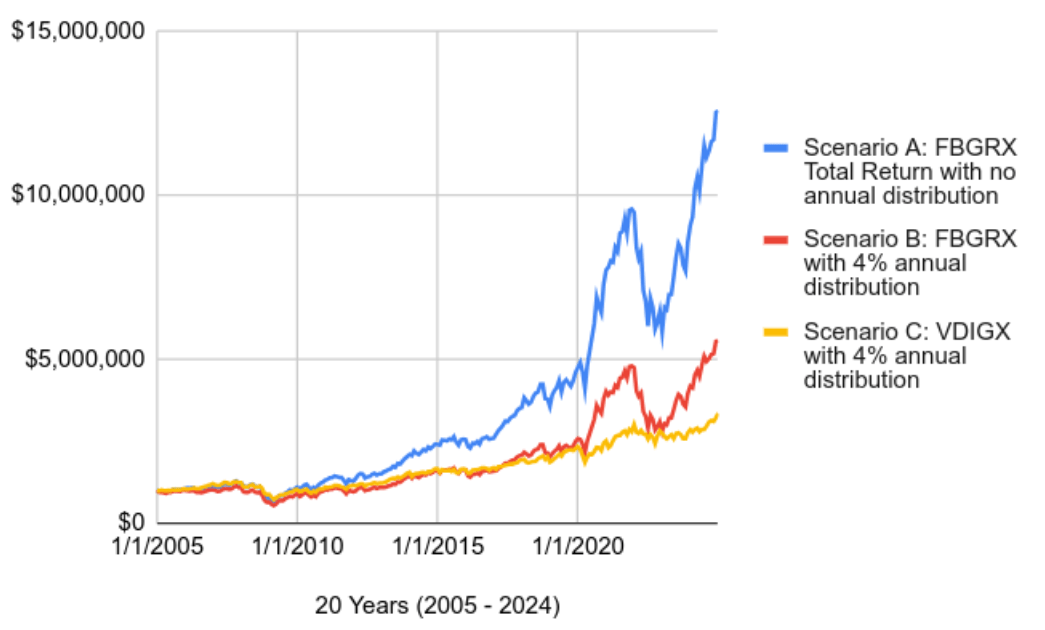
With Scenario A, FBGRX with no withdrawals, we have $12.6 million at the end of 20 years. Nice! But this is the scenario without annual distributions, so we need to move on to Scenario B.
With Scenario B, FBGRX with annual 4% withdrawals, we have $5.6 million at the end of 20 years. This appears to confirm Tyler's proposed methodology. But note that this is not a "dividend fund" that Tyler specifies. Also note that had you invested in Scenario B over these past 20 years, you would have needed to:
Endure highly variable annual withdrawals. (After Year 5, there was a 35% drop in annual distributions compared to Year 1)
Weather significant drawdowns. For example, just over 5 years into this plan (in Month 62) the portfolio value was 43% below where it started.
Wait several years for the distributions to increase. After Year 7, the annual withdrawal provided only 2.4% more cash than the first distribution after Year 1. That does not come close to keeping up with inflation.
With Scenario C, we look at the best dividend fund that we found-- the Vanguard Dividend Growth. With annual 4% withdrawals, we end up with $3.3 million. This appears to get close to Tyler's scenario, but there's one more wrinkle: we're looking at the past 20 years, and for some reason Tyler referred to a 16-year time horizon. So let's look at 16 years instead.
- If we look at the first 16 years of this time series (2005 through 2020), we have $2.5 million left, for a 4.7% return after distributions.
- If we look at the latest 16 years of this time series (2009 through 2024), we have $3.8 million left, for a 9.0% return after distributions.
So using VDIGX, we can replicate Tyler's proposed scenario if we use the most recent 16 years, but not the 16 years ending in 2020, and not the 20 years ending in 2024. This observation calls for that old chestnut: "timing is everything." It may also be helpful to observe that with retrospective data snooping, you can achieve all kinds of fantastic results. Caveat emptor.
The 20-year return of FBGRX is attractive (in Scenarios A and B, above) but the risk is not as alluring. So let's explore one last question.
Alternatives: What's better than FBGRX?
Given the volatility of FBGRX, let's look at risk and return data from the past 20 years to see if we can find anything better than FBGRX, considering both risk and return. We'll search among five different types of portfolios:
Vanguard funds
iShares ETFs
Fidelity funds
Strategic (Static) DIY Portfolios
Tactical (Dynamic) DIY Portfolios
The FBGRX metrics over the past 20 years, which we aim to beat, are 12.9% annual return with 13.2% downside deviation.
After searching for a winner among the six different portfolio types, here's what we found:
Among Vanguard funds, nothing beats FBGRX in terms of both the risk and return. The Vanguard fund with a higher return and lowest risk was the Vanguard Dividend Growth with 10.5% annual return and 8.9% downside deviation.
Among iShares funds, nothing beats FBGRX in terms of both risk and return. The iShares ETF with a higher return and lowest risk was iShares Select Dividend ETF (DVY) with 7.9% annual return and 11.7% downside deviation.
Among other Fidelity funds, nothing beats FBGRX in terms of both risk and return. The Fidelity fund that came close, Fidelity Dividend Growth Fund (FDGFX), has an annual return of 8.4%, and 12.8% of downside deviation.
Among the tactical model portfolios that we track at RecipeInvesting.com, two did manage to have a higher return with lower risk.
Conclusion
Tyler's approach requires a portfolio with approximately 12% annualized return, which stems from needing 4% for withdrawals plus 8% for continued growth. Based on our research, a relatively high-risk fund is needed to make this work, and it works only for some time periods.
We looked at funds from Vanguard, Fidelity, and iShares, but did not find any funds with "dividend" in their name that could make Tyler's approach work over the past 20 years. Some tech funds that get close, but all of those come with higher risk. However, if you step into the world of tactical model portfolios or alpha-generating fund managers, you can find more choices for higher return portfolios with lower risk.
as published on
Disclosure: I am/we are long EFA, IWM, GLD, TLT, QQQ, SPY, EEM. I wrote this article myself, and it expresses my own opinions. I am not receiving compensation for it. I have no business relationship with any company whose stock is mentioned in this article.