Article - Top Performing Portfolios Using Just 3 ETFs
Top Performing Portfolios Using Just 3 ETFs
The recent Wall Street Journal article "A Portfolio That's as Simple as One, Two, Three" got us thinking about the possibilities of using just three ETFs to build a portfolio. But the article was sparse on examples. It provided only two specific portfolio allocation ideas: 1) 40% U.S. stocks, 20% international stocks, 40% total bond market and 2) an allocation using an all-country equity fund (e.g., ACWI) plus a U.S. bond fund and an international bond fund.
That left us hungry for more actionable asset allocation ideas using three ETFs. We also wanted to explore portfolio allocations using other types of assets. This article explains how we looked at a full range of portfolios using just three ETFs, and which portfolios performed best.
Our approach to finding the best portfolios using just three ETFs
- Choose a list of global asset classes from which to pick the three ETFs.
- Create portfolios by choosing every unique combination of three ETFs from the asset class list.
- Apply an allocation (% weighting) to each ETF within each portfolio.
- Calculate risk and return metrics for each portfolio.
- Identify winners and losers based on risk and return.
Choosing the asset classes:
- Gold (NYSEARCA:GLD)
- Real estate (VNQ or ICF or VGSIX)
- Long Term Treasury bonds (VGLT or TLT or VUSTX)
- Short Term Treasuries (VGSH or SHY or VFISX)
- U.S. aggregate bonds (BND or AGG or VBMFX)
- U.S. equity: (VTI or IVV or VTSMX)
- Commodities: (DJP or DBC or PCRIX)
- International equity (VXUS or VEU or VGTSX)
Are there asset classes we've missed? Sure, but these eight should give us some idea of where to look first. If you can't imagine yourself owning some of the above asset classes, then we hope there will still be some portfolio combinations worth considering.
Creating the Portfolios
Using a bit of combinatorial math, there are 56 possible combinations if we pick three asset classes at a time from a set of eight. To see the full list of 56 portfolios, visit Portfolios Using Just 3 ETFs: List of 56 Portfolios based on Global Asset Classes.
Applying the Allocations
We've applied an equal weight of one-third (33.33%) to each item in each portfolio. This equal weighting is a simplification; there are many other allocation possibilities (e.g., 60%/20%/20%, 20%/20%/60%) but this allows us to explore a manageable number of portfolios and should give us an idea of what looks most promising.
Then we calculated the risk and return for each portfolio using annual data and the assumption of annual rebalancing and no transaction costs or taxes.
The results
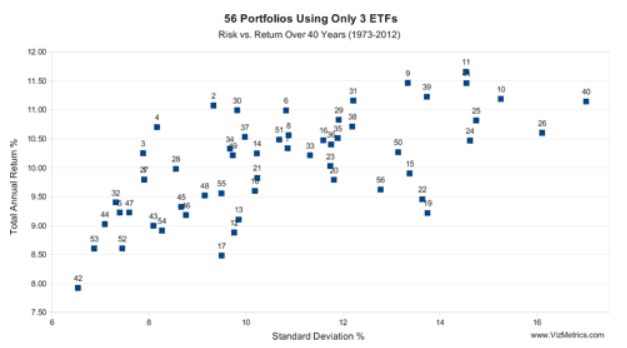
Which three-fund portfolios had lower risk and higher return? Here's what we found. The top left of the chart contains the portfolios with the lowest risk and highest return.
A few highlights:
- Portfolio #2 (Gold, Real Estate, Short Term Treasuries) has an annual return of 11.07% with a standard deviation of 9.33%
- Portfolio #4 (Gold, Real Estate, U.S. Equities) has an annual return of 10.70% with a standard deviation of 8.17%
- Portfolio #30 (Real Estate, Short Term Treasuries, International Equities) has an annual return of 10.99% with a standard deviation of 9.82%
- The highest return portfolio, #11, would have increased 82-fold (8,200%) over the 40-year period.
We're aware of the particular behavior of the gold market in the early 1970's. Portfolios #1 through #21 contain gold, and Portfolios #22 through #56 have no gold.
Looking at the poorer performing portfolios,
- Portfolio #40 offers significantly higher risk without much extra return.
- Portfolio #19 offers significantly lower return compared to other portfolios with similar risk (e.g., Portfolios #9, #39).
- The lowest return (and lowest risk) portfolio, #42, would have increased 21-fold (2,100%) over the 40-year period.
To see detailed descriptions of all 56 portfolios with the Risk vs. Return scatterplot, visit Portfolios Using Just 3 ETFs: Risk vs. Return Scatterplot.
Conclusion
Several portfolios, such as #2 and #30, have offered solid returns of 11% per year at below-market risk.
Looking at volatility, all 56 of the 3-ETF portfolios in this analysis were less volatile than holding the single asset class of U.S. equities, which has a standard deviation of 18.1% (!) over the 40-year period.
Looking at total annual returns, most of the portfolios in this analysis had a higher return than the U.S. equities asset class, which had an annual return of 9.5%.
The top-performing portfolios are worth further analysis to see if additional optimizations can be made with asset selection, factor tilts, or other variations.
as published on
Disclosure: I am/we are long EFA, IWM, GLD, TLT, QQQ, SPY, EEM. I wrote this article myself, and it expresses my own opinions. I am not receiving compensation for it. I have no business relationship with any company whose stock is mentioned in this article.