Article - The Top Tactical Portfolios Based On 29 Asset Allocation
The Top Tactical Portfolios Based On 29 Asset Allocation
To complement our analysis of strategic asset allocation portfolios, we studied a mix of tactical model ETF portfolios. This analysis looked at tactical models that 1) rebalance monthly according to risk and return metrics and 2) select ETFs each month from a fixed set of asset classes.
Our analysis compared 29 tactical portfolios on a risk vs. return basis. The tactical portfolios use different allocation approaches in the following categories:
- Risk and volatility portfolios
- Momentum (trend following) portfolios
- Blended portfolios using risk and momentum
The Question
Here's the main question we wanted to answer:
Which tactical ETF model portfolios produce the best risk-adjusted return?
Our Approach
We tested the following 29 tactical allocation models over the past 10 years, using monthly data:
- Adaptive Asset Allocation (4 portfolio variations using ETFs)
- Mebane Faber's Momentum Portfolios (2 variations)
- Equal Weight (2 variations)
- Risk Parity (3 variations)
- Maximum Diversification
- Minimum Variance (3 variations)
- Minimum Correlation
- Maximum Sharpe Ratio
- Equal Risk Contribution
- Target Return 12%
- Target Risk 10%
- Maximum Drawdown
- Minimum Downside Deviation
- Minimum Mean Absolute Deviation [MAD] (2 variations)
- Minimum Conditional Value at Risk [CVaR]
- Minimum Conditional Drawdown at Risk [CDaR]
The algorithms, which determine each portfolio's allocation, use a variety of risk and return metrics. Each portfolio consists of ETFs chosen from a group of 9 asset class ETFs (DBC, EEM, EFA, GLD, IWM, IYR, QQQ, SPY, TLT).
One of the Mebane Faber portfolios adds some additional asset classes (BND, SHY, VNQ, IEF, IGOV, IWD, IWF, IWN, IWO). As benchmarks, we also included a Balanced Portfolio (60% VTI, 40% BND), Aggregate bonds, S&P 500, and global equities (NASDAQ:ACWI).
For a high-level view comparing 10 of these tactical portfolios to 65 other asset allocations and famous active managers, see VizMetrics Report #vm03. This report contains a risk vs. return scatterplot comparing total return to maximum drawdown over the past seven years.
The Results
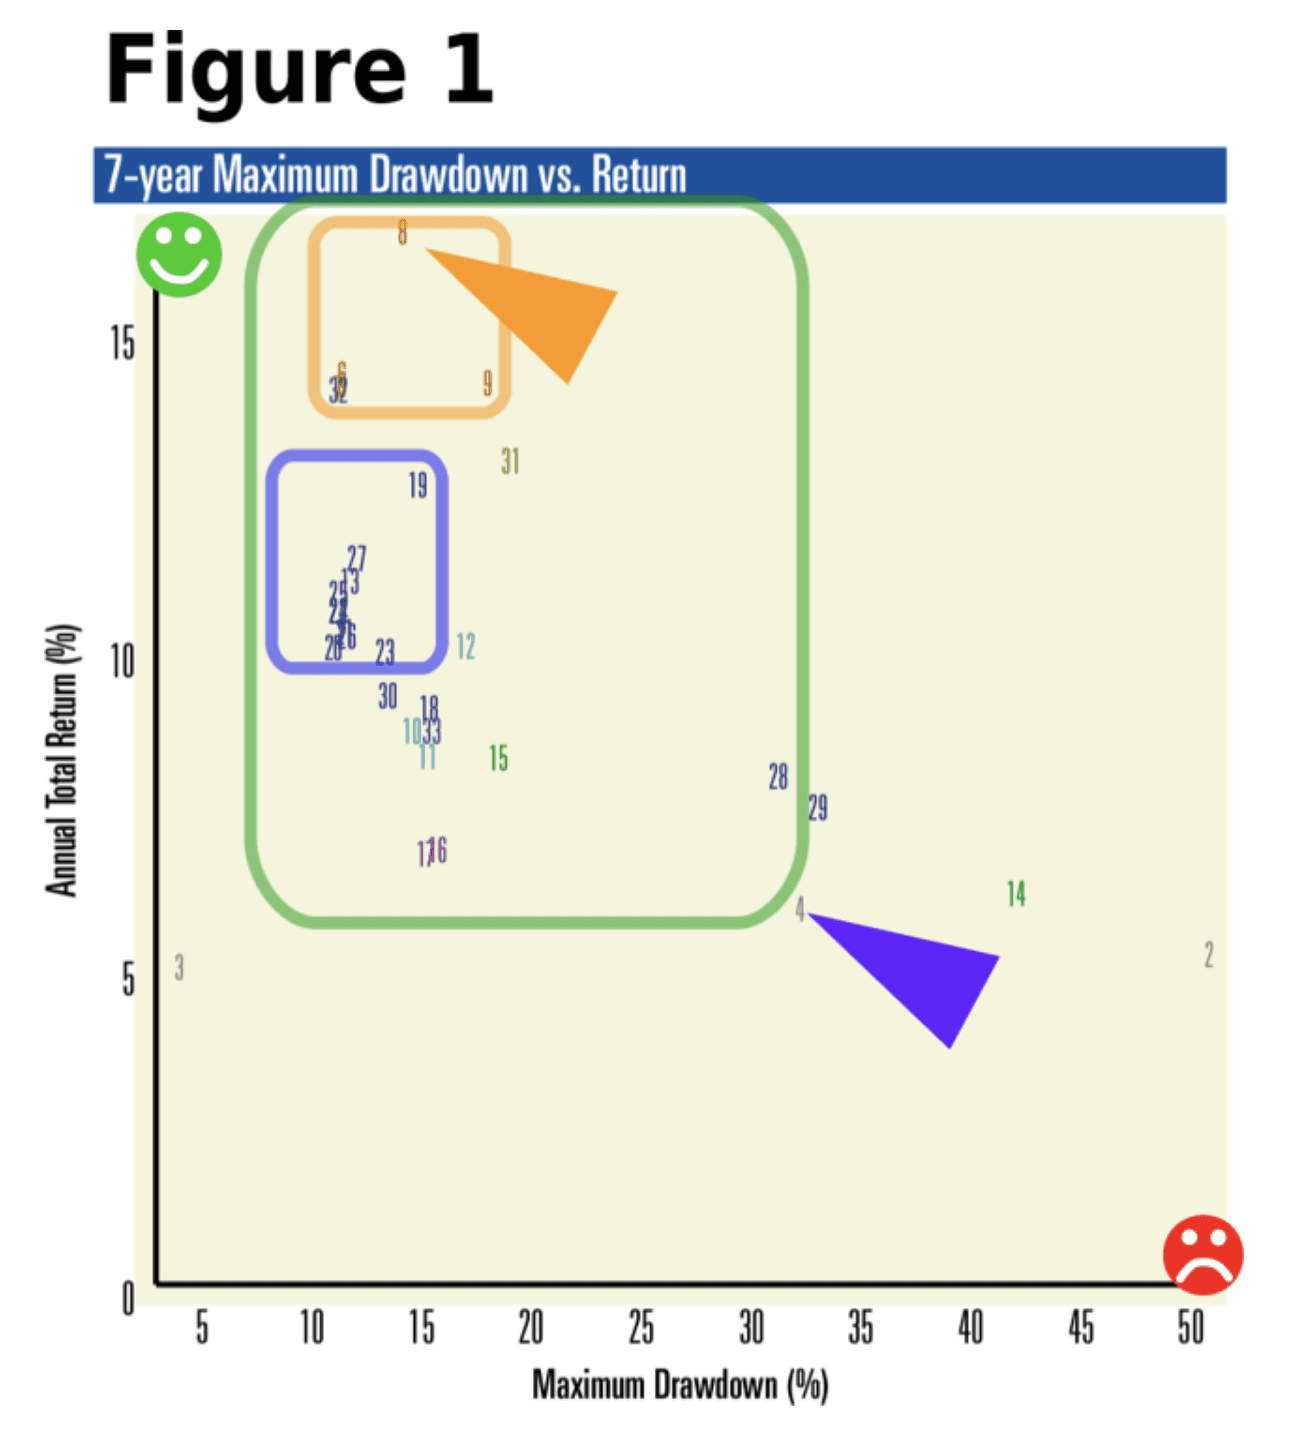
Figure 1 (below) plots the 29 portfolios plus the benchmarks on a risk vs. return scatterplot. The time period covered is Feb 2008 to Jan 2014. We believe using this 7-year period is important since it includes the drawdown in 2008-2009.
The risk metric we've chosen is maximum drawdown, which measures the worst peak-to-trough drop in total return over the 7-year period. This provides us a clear picture of how bad things got for each portfolio during the 2008 turbulence.
Here are some findings from Figure 1:
- One standout allocation (#8 in Figure 1, indicated by the orange arrow) has returned over 17% per year. This portfolio is based on an Adaptive Allocation approach, which combines risk and momentum metrics in its allocation algorithm.
- 27 of the 29 tactical portfolios have higher return and lower risk than the Balanced Portfolio (#4 in Figure 1, indicated by the purple arrow). These portfolios are shown in the green-bordered region in Figure 1.
- The Adaptive Portfolios (in the orange rectangle) have returned over 12% per year and offer the best risk-return tradeoff.
- Several portfolios using risk minimization tactics have returned over 10% annually with drawdown under 15% (#19 through #27 in the blue rectangle below).
Source: VizMetrics Report #vm22
For a PDF of this scatterplot with a complete list of all 29 portfolios, download VizMetrics Report #vm22, which is part of the VizMetrics Free subscription. This report also includes 1, 3, 5, and 10-year risk and return metrics.
Conclusion
The best tactical methodology over the past 7 years has been an adaptive portfolio (#8 in Figure 1, above) which produced a compounded annual return of 17.0% with a drawdown of 14.2%. This compares quite favorably to the S&P 500's annual return of 5.3% with 50.8% drawdown over the same period.
Nearly all of the tactical portfolios outperformed a Balanced Portfolio (#4 in Figure 1) and the S&P 500 (#2 in Figure 1). Several of these tactical portfolios produced returns above 10%. Despite the cost and effort to rebalance monthly, these portfolios could be worth a look for active investors and advisers.
as published on
Disclosure: I am/we are long EFA, IWM, GLD, TLT, QQQ, SPY, EEM. I wrote this article myself, and it expresses my own opinions. I am not receiving compensation for it. I have no business relationship with any company whose stock is mentioned in this article.