Article - The Permanent Portfolio During Rising Interest Rates: Here's What Happens
The Permanent Portfolio During Rising Interest Rates: Here's What Happens
Our recent article "3 Portfolios Inspired By Graham, Swensen, Browne" showed Harry Browne's Permanent Portfolio to be a solid performer, returning 6.6% over the past five years with less risk than an S&P 500 portfolio or a balanced portfolio (60% stocks / 40% bonds). But some unanswered questions emerged from that analysis.
The New Questions
- Over a longer time horizon, how has the Permanent Portfolio performed?
- During a period of rising interest rates, how has the Permanent Portfolio performed?
We intend to answer these questions in this article.
As a recap, the Permanent Portfolio can be constructed as follows:
- 25% Gold (using GLD)
- 25% Long-Term Treasuries (using VGLT or TLT or VUSTX)
- 25% Stocks (using SPY or VTI or VFINX)
- 25% Cash or Short-Term Treasuries (using SHV or VUSXX)
The Permanent Portfolio's design is intended to weather varied market conditions and provide a reasonable risk-adjusted return. Our model of the Permanent Portfolio rebalances yearly and we've used annual mutual fund returns as proxies for each portfolio component, plus historical indexes to complete the data series.
Looking at 39 years of history
Due to structural changes in the gold market from late 1971 through 1973, and due to the importance of gold in the Permanent Portfolio, we start our long-term analysis in 1974. So we are looking at the 39 years beginning with 1974 and ending with 2012.
Let's first compare the Permanent Portfolio to two benchmark portfolios for the 39-year period.
Return and Risk: 1974-2012
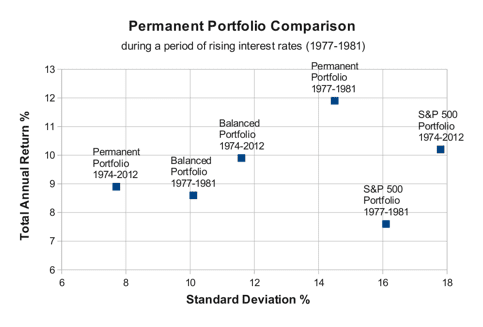
- Permanent Portfolio: Total return is 8.9%, Risk (as measured by standard deviation) is 7.7%
- S&P 500 Portfolio: Total return is 10.2%, Standard deviation is 17.8%
- 60/40 Balanced Portfolio: Total return is 9.9%, Standard deviation is 11.6%
Looking at a period of rising interest rates
Now let's focus on the period 1977-1981 when interest rates were rising. The Fed began raising the Fed Funds rate in February 1977, and this continued through 1981 under Paul Volcker. Since current rates have nowhere to go but up, we also wanted to look at this time span as a comparison.
Return and Risk: 1977-1981
- Permanent Portfolio: Total return is 11.9%, Standard deviation is 14.5%.
- S&P 500 Portfolio: Total return is 7.6%, Standard deviation is 16.1%.
- 60/40 Balanced Portfolio: Total return is 8.6%, Standard deviation is 10.1%.
Risk vs. Return Scatterplot
Below is a view of the three portfolios during both time spans. Looking at the two Permanent Portfolio data points, we see that its performance during the difficult 1977-1981 period exceeded its overall performance during the 39-year period. The two benchmark portfolios had a rougher time during the period of rising interest rates.

Conclusion
1. Over a longer time horizon, how has the Permanent Portfolio performed?
Over the 39-year period, the Permanent Portfolio has lagged the benchmark portfolios in total return, but the Permanent Portfolio has exhibited less risk.
2. During a period of rising interest rates, how has the Permanent Portfolio performed?
Over the rising interest rate period, the Permanent Portfolio outperformed the S&P 500 with less risk.
as published on
Disclosure: I am/we are long EFA, IWM, GLD, TLT, QQQ, SPY, EEM. I wrote this article myself, and it expresses my own opinions. I am not receiving compensation for it. I have no business relationship with any company whose stock is mentioned in this article.
