Article - Rob Arnott's 'Ultimate' Asset Allocation Portfolio
Rob Arnott's 'Ultimate' Asset Allocation Portfolio
In a recent Wall Street Journal article by Brett Arends, Rob Arnott of Research Affiliates suggested that an all-weather, universal, "ultimate" portfolio for asset allocation should consist of equal parts stocks, bonds, commodities, and real estate. Arnott added that this portfolio should also include global and emerging market stocks and bonds.
We're intrigued by this suggestion, but how could we implement this "ultimate portfolio" and how does it perform on a risk vs. return basis? This article answers these questions.
Our approach
To create and analyze this Arnott-inspired portfolio, we followed these steps:
- Allocate. Decide the asset allocation for the portfolio across various global asset classes.
- Choose funds. Pick funds to represent each asset class.
- Analyze. Backtest to generate total annual returns and risk metrics.
- Visualize. Create risk vs. return scatterplots showing the Arnott-inspired portfolio versus some benchmarks.
Step 1: Allocate
First we mapped Arnott's suggestions into percentage allocations across asset classes.
Mr. Arnott's suggested asset allocation is simply the following: 25% stocks, 25% bonds, 25% commodities, and 25% real estate.
However, his follow-up suggestion to allocate globally means we need to split the allocation among global asset classes. Accordingly, we split the stock and bond allocations into three pieces: U.S., international developed, and emerging markets. We split the real estate allocation evenly between U.S. and international. The overall allocation then looks like this:
- 25% stocks: 8.34% U.S., 8.33% International Developed, 8.33% Emerging Markets
- 25% bonds: 8.34% U.S., 8.33% International, 8.33% Emerging Markets
- 25% commodities
- 25% real estate: 12.5% U.S., 12.5% International
Step 2: Choose funds
Then we modeled the allocations using ETFs. We wanted to see the risk and return for these portfolios over the last 10 years, but some desirable ETFs don't have that much history. So we used closely matching mutual funds as a proxy for the newer ETFs. Then we switched to using the ETFs when they became available.
We decided to test 3 variations of the Arnott-inspired portfolios:
- Arnott-1: Simple version using 4 ETFs.
For comparison, we created a 4-ETF version of this portfolio. Funds used: 25% stocks (VTI), 25% bonds (BND), 25% commodities (DBC), 25% real estate (VNQ). To complete 10 years of history, we backfilled as needed with returns from an ETF's twin mutual fund, or in the case of DBC we used the corresponding index. - Arnott-2: Full version using 6 ETFs plus 3 mutual funds.
Using mutual funds allows us to have more history. This portfolio also includes international diversification. Funds used: 8.34% U.S. stocks , 8.33% International Developed stocks (EFA), 8.33% Emerging Markets stocks (EEM), 8.34% U.S. bonds , International bonds (RPIBX), emerging market bonds (PEMDX), 25% commodities , 12.5% U.S. real estate , 12.5% international real estate (TVRVX). - Arnott-3: Full version using 9 ETFs.
We use 3 mutual funds as proxies for IBND, EMB, and VNQI for the dates prior to those ETFs launching. Funds used: 8.34% U.S. stocks , 8.33% International Developed stocks , 8.33% Emerging Markets stocks , 8.34% U.S. bonds , International bonds (IBND and RPIBX), emerging market bonds (EMB and PEMDX), 25% commodities , 12.5% U.S. real estate , 12.5% international real estate (VNQI and TVRVX).
Step 3: Analyze
We crunched the performance numbers for the 3 portfolios. We used monthly data and we assumed monthly rebalancing.
For return metrics, we chose total annual return (i.e., compound annual growth rate) over the past 3, 7, and 10 years ending Dec 2013.
For risk metrics, we used downside deviation. We prefer this measure instead of standard deviation, since downside deviation looks only at the size of the negative returns and does not penalize a portfolio for the "good volatility" related to positive returns. We also looked at maximum drawdown over the past 7 years, which includes the market turbulence of 2008-2009.
Step 4: Visualize
We created three scatterplots to compare these Arnott-inspired static portfolios. We also added the following benchmarks for comparison:
- an active balanced portfolio, represented by Vanguard Wellesley Income Fund, VWINX
- a passive balanced portfolio, represented by 60% VTI and 40% BND
- an active global portfolio managed by Rob Arnott, the Pimco All-Asset All-Authority Fund, PAUIX
- the S&P 500, represented by SPY
Results
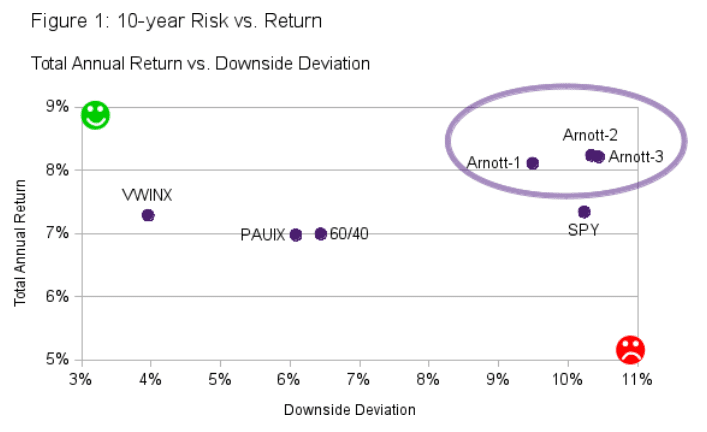
Over 10 years, the Arnott portfolios have outperformed SPY, with about the same level of risk. See the purple oval in Figure 1, below. The Arnott-1 portfolio has the least risk among the 3 variations. By comparison, the benchmark portfolios have lower returns, but with significantly less risk as measured by downside deviation.
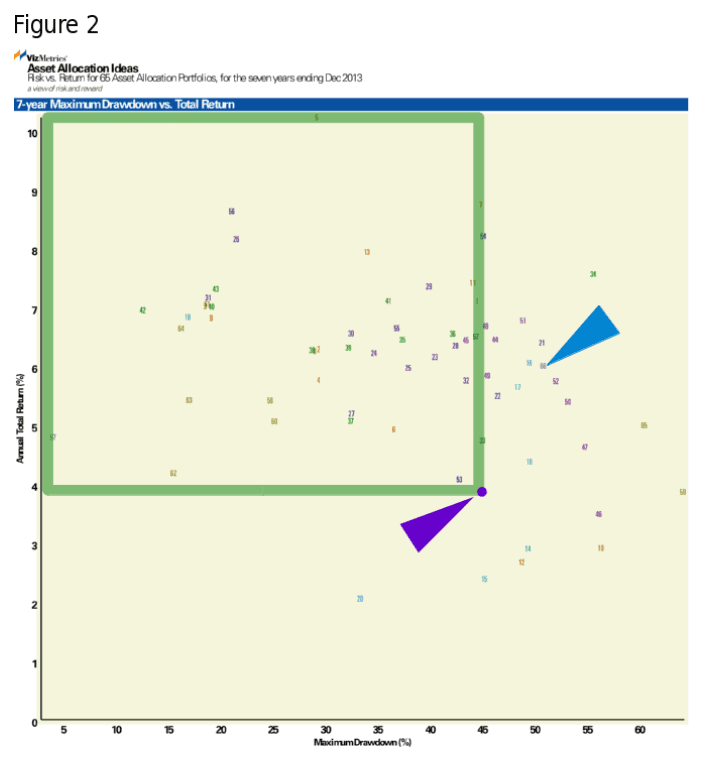
Over the past 7 years, the Arnott portfolios have underperformed, but they have also shown less risk than SPY. Figure 2, below, shows SPY (#66 indicated by the blue arrow), and the Arnott-3 portfolio (purple dot indicated by the purple arrow). Over this time period, many other portfolios have outperformed the Arnott portfolio. The green-bordered area in Figure 2 contains 43 portfolios with greater return and less risk.
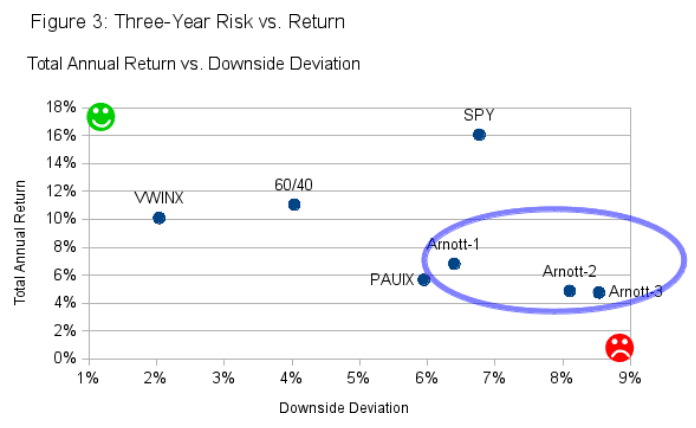
During the past 3 years, the Arnott portfolios look worse. See the blue oval in Figure 3, below. The Arnott portfolios are in the lower right corner, which indicates higher risk and lower return. This is partially attributable to the low equity exposure (only 25%) during the recent market rally.
Conclusion
Rob Arnott's suggested "ultimate" portfolio has returned 8.2% annually over the past 10 years, which is better than the S&P 500 with about the same level of risk.
But investing in this portfolio could require stamina and a decade-long time horizon. The portfolio had significant drawdown in 2009 (nearly 45%) and also lagged during the market rally of 2013. Investors with an appetite for less risk might consider Mr. Arnott's actively managed fund or other asset allocation ideas.
as published on
Disclosure: I am/we are long EFA, IWM, GLD, TLT, QQQ, SPY, EEM. I wrote this article myself, and it expresses my own opinions. I am not receiving compensation for it. I have no business relationship with any company whose stock is mentioned in this article.