Article - Permanent Portfolio Alternatives: Exploring 4 Low-Risk Options With Higher Annual Returns
Permanent Portfolio Alternatives: Exploring 4 Low-Risk Options With Higher Annual Returns
Summary
- The so-called “Permanent Portfolio” was designed in the 1980s to be safe and profitable in all economic conditions.
- We take a look at the ingredients and performance of the Permanent Portfolio by comparing different ways to invest using this approach.
- Then, we explore four alternatives with Portfolio Recipes that may be attractive to investors who want less risk, higher returns, or both.

What is the Permanent Portfolio – and Where Did it Come From?
Free-market investment analyst Harry Browne designed the Permanent Portfolio in the 1980s. Browne used a variation of efficient market indexing to construct a portfolio that he believed would be safe and profitable during economic downturns, inflationary periods, and slow-growing markets. He called this his “Permanent Portfolio,” composed of:
- 25% equities
- 25% precious metals
- 25% government bonds
- 25% cash (represented by Treasury bills)
In this allocation, Browne suggested using a basic S&P 500 index fund for stocks, and to focus on growth stocks to capture periods of economic expansion. He also noted that gold bullion coins were his choice of precious metal.
Creating a Permanent Portfolio Recipe
That said, there are various opinions on how to allocate each portion of Browne’s original portfolio, particularly equities.
Some may choose to put their equity allocation into a single large-cap ETF. Others may prefer to allocate some of the equity slice to international stocks, emerging markets, or small cap equities.
For our analysis in this article, we’ve chosen one ETF to represent each quarter of the Permanent Portfolio:
- IWF to represent equities. This ETF tracks the Russell 1000 Growth Index.
- GLD to represent gold.
- TLT to represent government bonds. This ETF tracks a U.S. Treasury 20+ Year Bond Index.
- SHY to represent cash. This ETF tracks a U.S. Treasury 1-3 Year Bond Index.
Exhibit A: Growth of $10,000 Investment in the Permanent Portfolio’s Four Ingredients Compared to a Traditional Permanent Portfolio
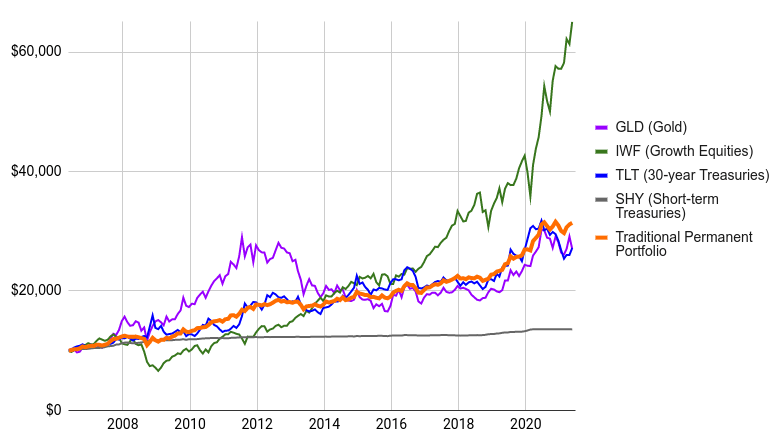
In particular, the green line (equities, represented by IWF) has done exceptionally well over the last few years. But take careful note of the 48% drawdown between 2008 and 2010, where the green line dips far below the others. This reminds us that the recent stellar returns do come with some risk.
The traditional Permanent Portfolio (orange line) smooths performance over time, with smaller drawdowns and steadier long-term performance.
Advantages of the Permanent Portfolio
In the 1980s, Browne argued that such a diversified portfolio mix could prove profitable in all economic situations. Growth stocks would prosper in expansionary periods, while precious metals would do well during higher inflation. Bonds and cash (Treasury bills) would be there to reduce drawdown during recessions and depressions, respectively.
This is the original purpose of the Permanent Portfolio: plausible diversification to produce returns in varying economic scenarios. Or, as Ray Dalio might say, the Permanent Portfolio is an “all weather” investment.
Additionally, Permanent Portfolios are simple to implement, just buy and hold securities, with an occasional rebalance to keep allocations at 25%. (Browne recommended doing so annually.) Modern fractional-share brokers like M1 Finance make this process even easier.
Lastly, Permanent Portfolios provide decent risk-adjusted performance in the long term. We’ll touch on this more in depth below.
How Do You Invest in the Permanent Portfolio?
The easiest way to invest in the Permanent Portfolio is to put 25% of your investment capital into each ETF listed above: IWF, GLD, TLT, and SHY.
There’s also a mutual fund available (PRPFX) that implements the Permanent Portfolio using its distinct collection of equities, bonds, and precious metals. However, this fund comes with an expense ratio of 0.83% that will affect your total return. Moreover, this mutual fund historically hasn’t performed as well as a do-it-yourself, traditional Permanent Portfolio using four ETFs.
In Exhibit B (below), we can see the 15-year performance of the Traditional Permanent Portfolio (solid line in the middle) versus the PRPFX mutual fund (dashed line on the bottom). We also threw our own variation of the Permanent Portfolio, the Permanent Plus Portfolio (abbreviated as “s.plus”), into the mix.
Exhibit B: Growth of $10,000 Initial Investment in Permanent Portfolios (Traditional, Permanent Plus, and PRPFX mutual fund) Over 15 Years
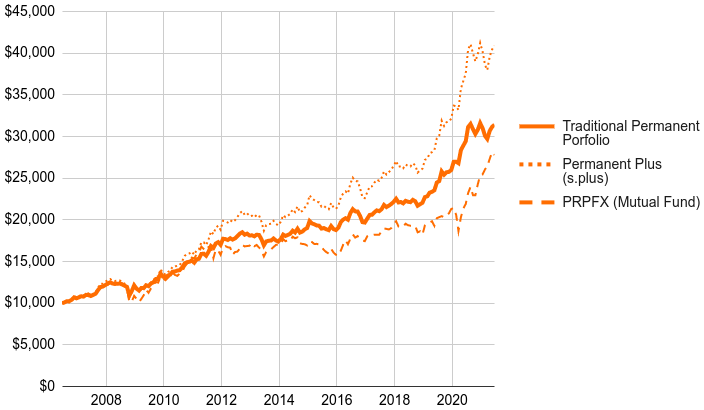
The difference between s.plus and other Permanent Portfolios is that s.plus removes the cash component, which results in an equal 33.3% blend of the three remaining ingredients (gold, long-term bonds, and equities) rather than 25% of the original four ingredients.
Of course, if cash is important to you, you can stick to the classic four-ingredient Permanent Portfolio. Still, our finding is that removing cash boosts returns significantly while only increasing risk slightly. More on that below.
How Has the Permanent Portfolio Performed?
Historically, the Permanent Portfolio and its variations have performed consistently in the long-term – and s.plus even outperforms a 60/40 Balanced Portfolio. While the Permanent Portfolio can reduce losses in market downturns, the structure also limits upside potential during periods of growth.
For instance, Exhibit C (below) shows the risk vs. return trade-off for dozens of individual, investable portfolios that we track at RecipeInvesting.com. The vertical axis measures the annual rate of return, and the horizontal axis shows downside deviation, a measure of risk. We like to use downside deviation Instead of using standard deviation to measure a portfolio's volatility. The downside deviation metric only considers the negative monthly returns and does not penalize a portfolio for its upward moves.
Each dot in Exhibit C’s scatterplot represents a different portfolio. The orange diamonds indicate the three Permanent Portfolios. We've also included two benchmarks: the SPDR S&P 500 ETF (SPY) is shown as the pink square, and a 60/40 Balanced Portfolio (composed of 60% VTI, 40% BND) is shown as the blue triangle.
The rest of our Portfolio Recipes (found at recipeinvesting.com) are represented by grey dots.
Exhibit C: Risk vs. Return for Permanent Portfolios (Traditional, s.plus Permanent Plus, and PRPFX mutual fund) Over 15 Years
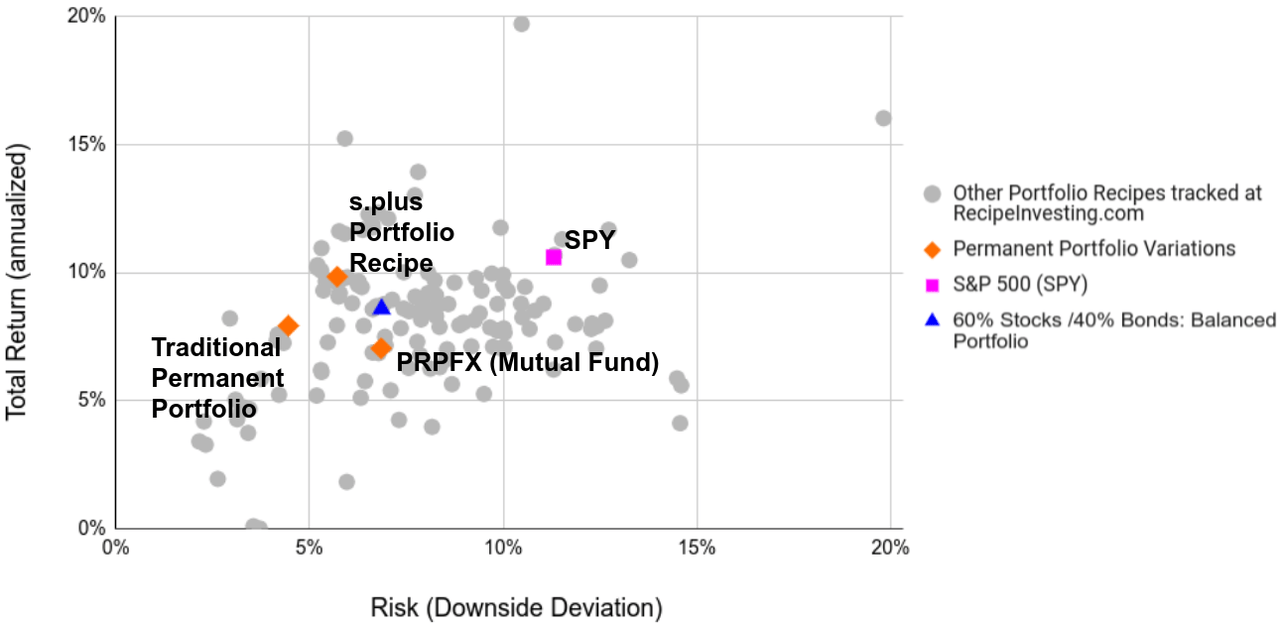
In this case, we’re most interested in portfolios in the northwesternmost corner (upper left), since those portfolios generate the highest return at the lowest risk.
We can see that the PRPFX mutual fund is below and to the right of the other two orange diamonds. In other words, PRPFX doesn't perform as well as the Traditional Permanent Portfolio or the s.plus variation.
SPY has generated 10.6% returns over the last 15 years – but it also has a much higher downside deviation at 11.3%.
Alternatives to the Traditional Permanent Portfolio
The Traditional Permanent Portfolio might suit your needs if you’re seeking moderate returns at minimal risk. But for those investors seeking more choices with less risk, higher returns, or both, we’ve compiled a list of viable alternatives.
1. s.plus: an alternative with one modification
As shown in the scatterplot above, the best-performing of the three Permanent Portfolio variations was the "Permanent Plus" Portfolio Recipe (s.plus), which generated 9.8% annual returns with a 5.7% downside deviation.
While this isn’t a “true” Permanent Portfolio, since it removes the cash component (represented by SHY), the results speak for themselves.
Exhibit C highlights how s.plus offers nearly the same annual return as SPY at almost half the risk. Moreover, compared to the Traditional Permanent Portfolio, s.plus generates a higher return with only slightly more downside deviation.
Not to mention, s.plus beat out the Permanent Portfolio mutual fund (PRPFX), which saw 7.0% annual growth with a 6.8% downside deviation. That said, the mutual fund may be more convenient to buy and hold, as they manage the periodic rebalancing.
2. A Mutual Fund option: Hundredfold Select Alternative Fund
But what if you want a similar rate of return as the Traditional Permanent Portfolio, but with even lower risk?
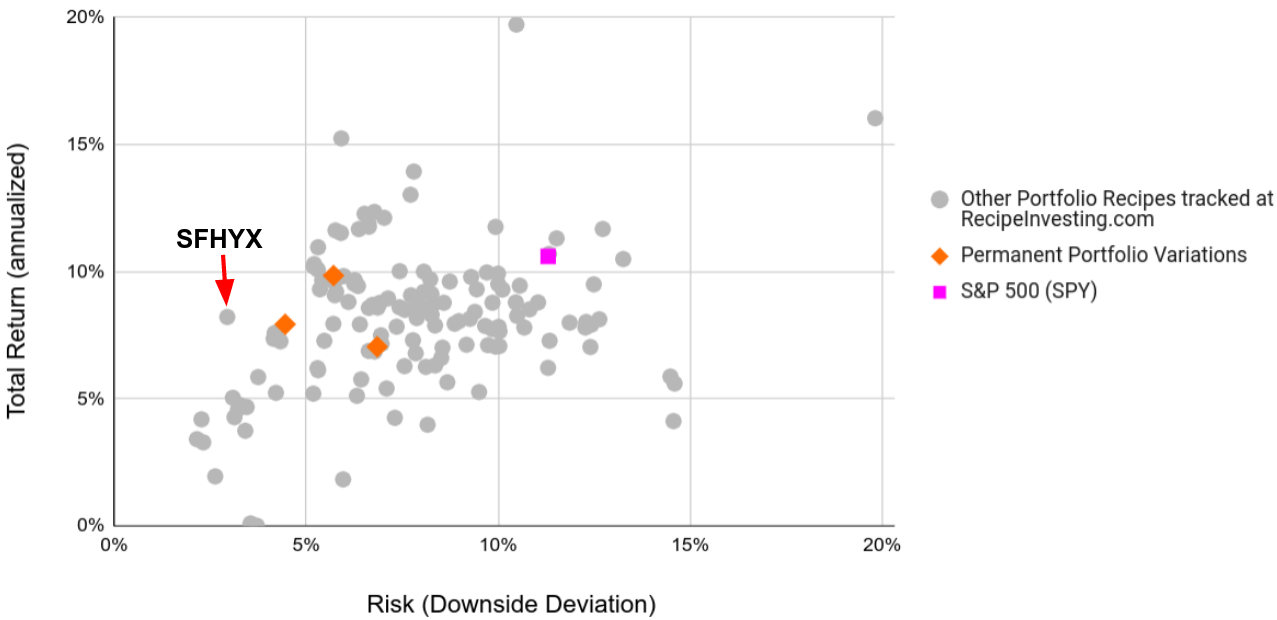
For those individuals, there is the Hundredfold Select Alternative Fund (SFHYX) or its sibling HFSAX. This tactical, non-diversified, blended mutual fund invests in equities and fixed income securities to seek moderate returns at marginal risk.
Exhibit D (below) shows that SFHYX has succeeded at its goal in the past 15 years, generating 8.2% returns with 2.9% downside deviation. This performance beats the Traditional Permanent Portfolio in both risk and return, though its reduced risk limits upside potential compared to the s.plus portfolio and SPY benchmark.
Exhibit D: SFHYX Total Risk-vs-Return Compared to Permanent Portfolio Variations
3. Low-Risk Tactical Options
For those investors seeking something better than s.plus, five tactical portfolios provide both lower risk and higher return. These recipes are circled in Exhibit E below, clumped together above and to the left of s.plus.
Exhibit E: Annual Total Return vs. Downside Deviation for Five Tactical Portfolios That Outperformed the s.plus Portfolio Recipe
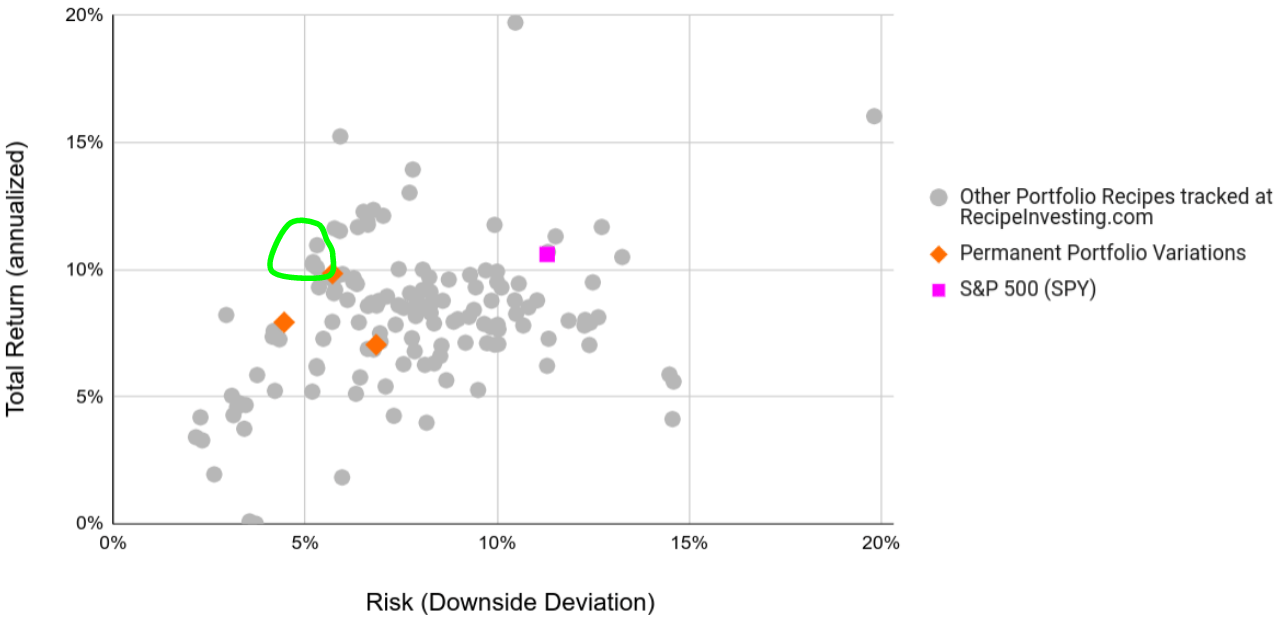
Exhibit E highlights these five Portfolio Recipes:
t.mva3 produced 11% returns at 5.3% downside deviation over the past 15 years. This dynamic Minimum Variance Portfolio uses an asset allocation algorithm to maximize risk-adjusted returns and minimize variance.
t.mvar generated 10.3% returns at 5.2% downside deviation. This dynamic Minimum Variance Portfolio uses an asset allocation algorithm to maximize risk-adjusted returns and minimize variance.
t.madm saw 10.2% returns at 5.2% downside deviation. This Minimum Mean Absolute Deviation (MAD) Portfolio uses an asset allocation algorithm to minimize MAD while maximizing total returns.
t.madd returned 10.2% at 5.2% downside deviation. This Minimum Downside Mean Absolute Deviation (MAD) Portfolio uses an asset allocation algorithm to minimize downside MAD while maximizing risk-adjusted returns.
t.risd gained 10.1% at 5.3% downside deviation. This Minimum Downside Deviation Portfolio uses an asset allocation algorithm to minimize downside deviation while maximizing risk-adjusted returns.
Each of these five tactical portfolios do require monthly updates, so they’re not as dead-simple to implement. That said, they invest in low-cost ETFs to cut out fees that would otherwise eat into your returns at comparatively improved long-term performance.
4. Higher-performing Portfolio Recipes
And for those investors who are willing to take on more risk for greater returns, we’ve found some alternatives for you, too.
In the green circle (well, oval) highlighted in Exhibit F, we can see the 11 Portfolio Recipes that produced returns greater than any of the Permanent Portfolios and SPY in the last 15 years. And while some of them entailed the same or greater risk than s.plus, all of them were less volatile than SPY’s 11.2% downside deviation.
Two of these recipes, in particular, are notable for their outstanding total returns: t.aaaf and t.pure. See the labeled points in Exhibit F below.
Exhibit F: 11 Portfolio Recipes that Generated Greater Returns at Additional Risk Compared to s.plus Over 15 Years
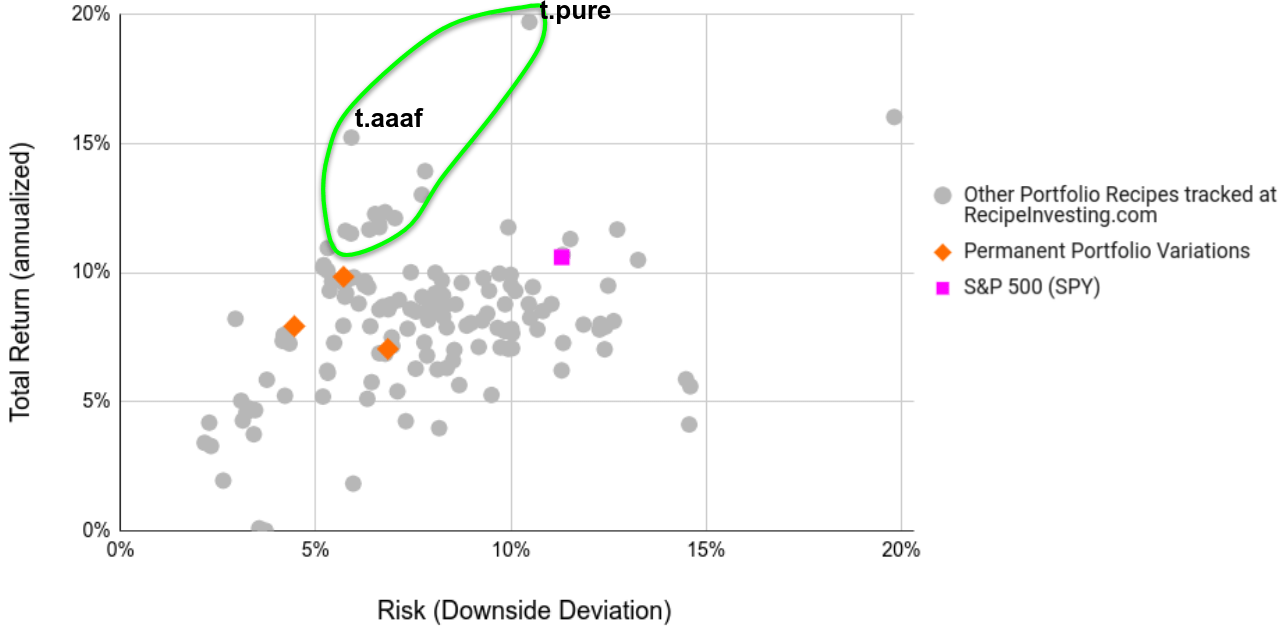
The VizMetrics Adaptive Allocation Portfolio F is marked as "t.aaaf". This tactical DIY recipe uses an adaptive asset allocation algorithm to invest in ETFs that strike a favorable balance between risk-adjusted returns and volatility (as measured by standard deviation). This Portfolio Recipe exhibits an advantageous risk-vs-return trade-off, generating 15.2% annual return with just 5.9% downside deviation.
But far and away, the best performance of all the Portfolio Recipes was t.pure, a tactical DIY recipe that ranks asset classes based on returns generated over the past 1, 2, and 3 months. This Pure Momentum Portfolio saw eye-watering annualized returns of 19.56% over the last 15 years at a reasonably low downside deviation of 10.5%. This could certainly be worth a closer look for those who don't mind holding a more concentrated position over a longer investing horizon.
5. Bonus: Better than the Permanent Portfolio Mutual Fund
We’ve looked at funds that have outperformed the Traditional Permanent Portfolio, as well s.plus. But what about the full set of Portfolio Recipes that have outcompeted the Permanent Portfolio Mutual Fund, PRPFX?
As it turns out, there are 34 investable portfolios on our ledger that beat PRPFX in terms of both risk and return (including those we’ve already covered). As a supplement to this article, we've prepared this full list of permanent portfolio alternatives.
Summary: The Permanent Portfolio is Top-Notch, But Not Necessarily Top-Tier
Given its simplicity and relatively low risk, the Traditional Permanent Portfolio may appeal to investors who prefer a largely “set it and forget it” approach that will perform in most economic situations.
That said, there are some other options that have historically offered better risk-adjusted performance. In particular, removing the cash ingredient from a recipe boosts returns while only slightly increasing risk, depending on the specific allocation of the portfolio.
as published on
Disclosure: I am/we are long EFA, IWM, GLD, TLT, QQQ, SPY, EEM. I wrote this article myself, and it expresses my own opinions. I am not receiving compensation for it. I have no business relationship with any company whose stock is mentioned in this article.