Article - How To Beat The S&P 500 Using Talmudic Wisdom
How To Beat The S&P 500 Using Talmudic Wisdom
- The Babylonian Talmud describes a portfolio recipe (i.e., an asset allocation model) that divides your wealth into three different types of assets.
- We use exchange-traded funds to create portfolio recipes based on this Talmudic investment strategy.
- The best portfolio recipe returned 8.4% annually over the past 10 years, which beats the S&P 500 and also outperforms a Blended Portfolio of 60% Stocks and 40% Bonds.
- The risk of each Talmud portfolio recipe is less than the S&P 500, based on maximum drawdown over the past 10 years.
VizMetrics tracks the ingredients and performance for over 250 dynamic and static portfolio recipes. We're always on the hunt for promising new recipes that could help investors outperform the market. When we find a new recipe, we analyze its risk and return and report the results at recipeinvesting.com. In this article we investigate several portfolios based on a passage from the Talmud, a collection of ancient wisdom literature. The passage reads as follows:
It is advisable for one that he should divide his money in three parts, one of which he shall invest in real estate, one of which in business, and the third part to remain always in his hands.
- (Babylonian Talmud, Bava Metzia section, p.42)
The Question
Can we create a high-performing portfolio based on this Talmud strategy?
Our Approach
To answer this question, we followed these steps:
- Step 1. Identify Portfolio Recipes that apply the Talmud Strategy
- Step 2. Use exchange-traded funds (ETFs) to create investable portfolio recipes
- Step 3. Analyze the performance of each portfolio recipe
- Step 4. Compare risk vs. return using scatterplots. We also compare these recipes to 130 other portfolio recipes tracked by VizMetrics at RecipeInvesting.com
The Process
Step 1. Identify Portfolio Recipes that apply the Talmud Strategy
The Talmud passage clearly identifies investing one-third of your wealth into each of three different assets: real estate, business, and cash-in-hand. However, there are different interpretations for how to invest in each type of asset in today's modern world. We identified five portfolio recipes that apply the Talmud Strategy. Three of these are based on articles and research papers and two others use gold as the proxy for cash-in-hand.
- Talmud Broad Market. This recipe is described in a September 2011 article "The Talmud Strategy" in Financial Planning magazine, and is based on the investment approach used by Roger Gibson. The three ingredients chosen for this recipe are U.S. Real Estate, U.S. Total Market Equities, and U.S. Total Bond Market.
- Talmud Small Cap Equity. This recipe is described in Daria Newfeld's August 2014 paper entitled "An investigation of 'true' Talmudic investing" as published in Research in Business and Economics Journal, Volume 9. This paper identifies several possible Talmud strategies, and we chose the portfolio recipe with the top return during the out-of-sample period (September 2007 to October 2013) which is described in the paper. The three ingredients chosen for this recipe are U.S. Real Estate, U.S. Small Cap Equities, and U.S. 1-3 Year Treasury Bonds.
- Talmud Blue Chip. This recipe is described by Joshua Kennon in his December 6, 2009 blog post "The Talmud Model: Three Asset Classes, Divided Equally." The three ingredients chosen for this recipe are U.S. Real Estate, U.S. Blue Chip Equities, and U.S. 3-7 Year Treasury Bonds.
- Talmud Dividend Equities. This recipe uses dividend-generating stocks for the "business" portion of the portfolio, and gold for the cash-in-hand portion of the portfolio. The three ingredients chosen for this recipes are U.S. Real Estate, U.S. Dividend Equities, and Gold.
- Talmud Equities and Gold. This recipe uses broad market U.S. stocks for the "business" portion of the portfolio, and gold for the cash-in-hand portion of the portfolio. The three ingredients chosen for this recipes are U.S. Real Estate, U.S. Total Market Equities, and Gold.
Step 2. Use exchange-traded funds (ETFs) to create investable portfolio recipes
- For the "one-third real estate" portion, we chose Vanguard U.S. Real Estate ETF (VNQ) for all the portfolio recipes.
- For the "one-third business" portion, the different recipes call for different types of assets. The chosen ETFs are VTI, IWM, DIA, and SDY.
- For the "one-third cash-in-hand" portion (referred to as "always in his hands" in the Talmud passage), the selected ETFs are BND, SHY, IEI, and GLD. SGOL could be another option instead of GLD.
Exhibit A shows the five portfolio recipes and the ingredients for each, along with a VizMetrics Portfolio ID that we use the track each portfolio's monthly performance at recipeinvesting.com.
Exhibit A: Ingredients of the Five Portfolio Recipes (featuring Exchange-Traded Funds)
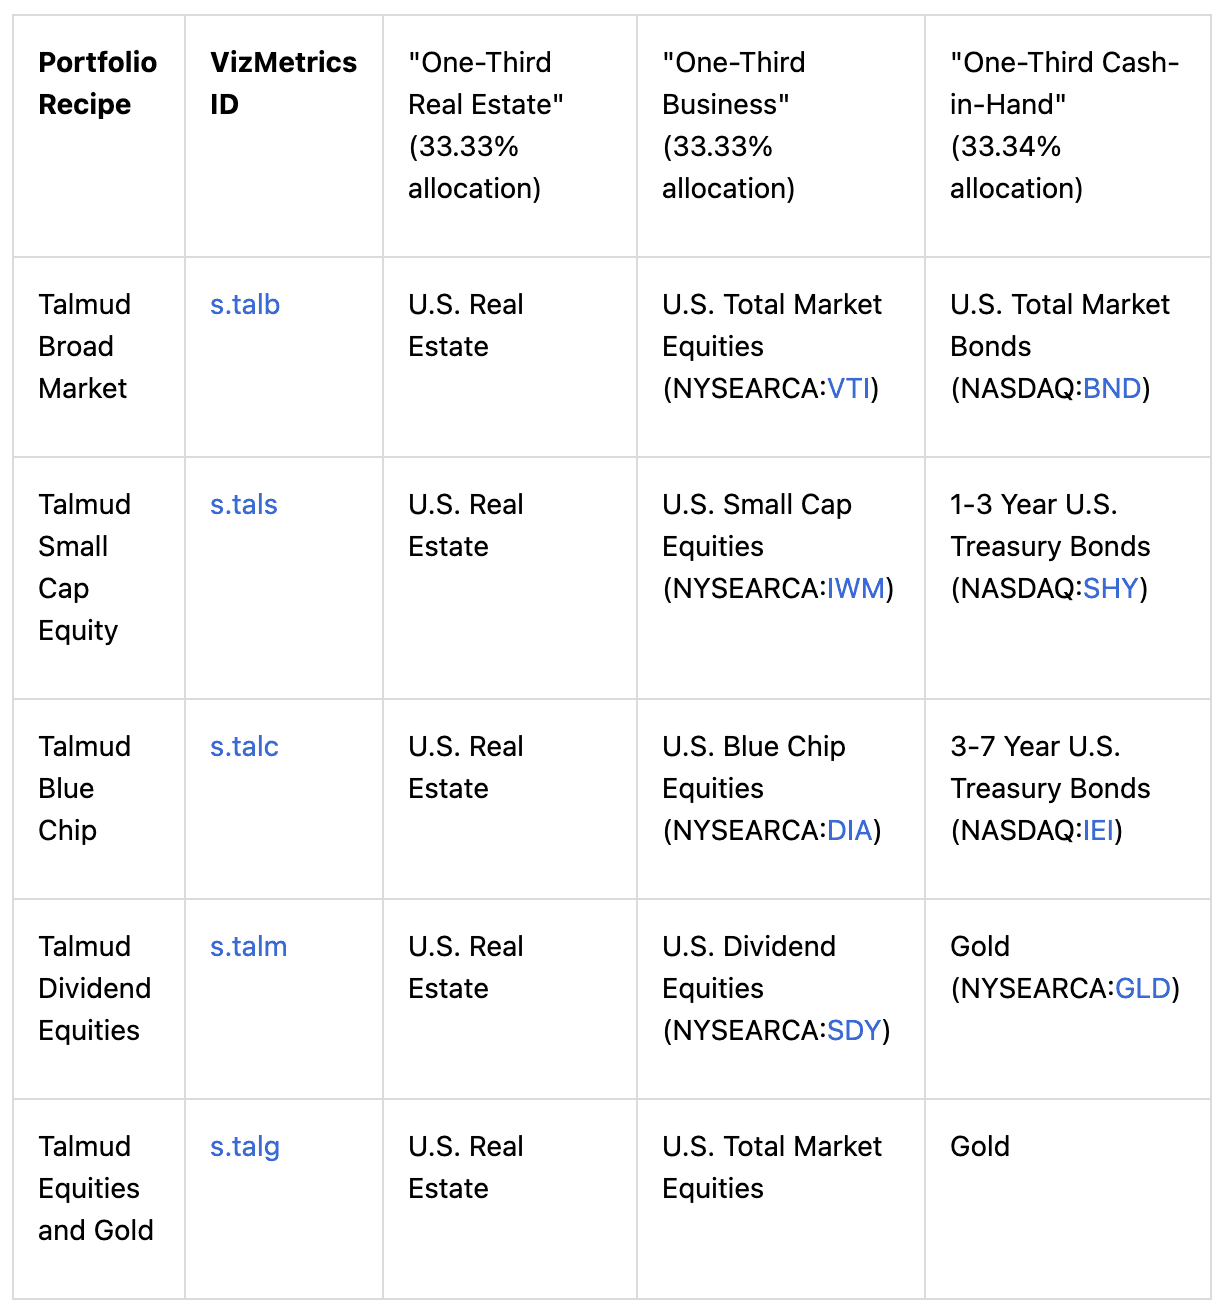
| Portfolio Recipe | VizMetrics ID | "One-Third Real Estate" (33.33% allocation) | "One-Third Business" (33.33% allocation) | "One-Third Cash-in-Hand" (33.34% allocation) |
| Talmud Broad Market | s.talb | U.S. Real Estate | U.S. Total Market Equities (VTI) | U.S. Total Market Bonds (BND) |
| Talmud Small Cap Equity | s.tals | U.S. Real Estate | U.S. Small Cap Equities (IWM) | 1-3 Year U.S. Treasury Bonds (SHY) |
| Talmud Blue Chip | s.talc | U.S. Real Estate | U.S. Blue Chip Equities (DIA) | 3-7 Year U.S. Treasury Bonds (IEI) |
| Talmud Dividend Equities | s.talm | U.S. Real Estate | U.S. Dividend Equities (SDY) | Gold (GLD) |
| Talmud Equities and Gold | s.talg | U.S. Real Estate | U.S. Total Market Equities | Gold |
Step 3. Analyze the performance of each Portfolio Recipe
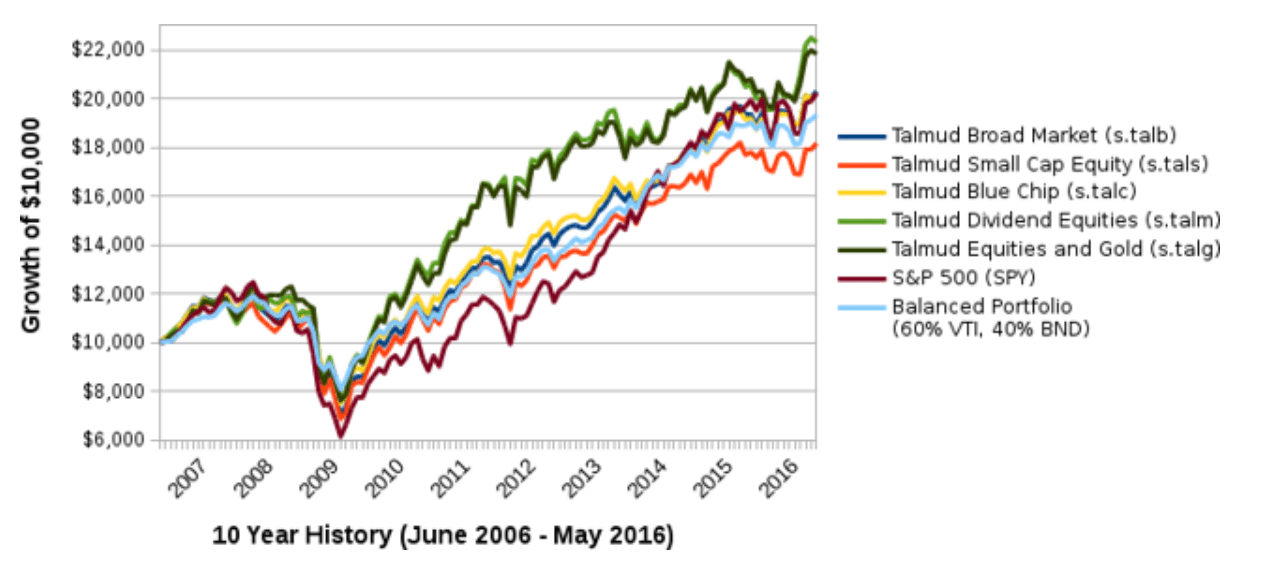
We looked at risk and return for each portfolio recipe. We examined the total annual return over the past 10 years, from June 2006 to May 2016. Exhibit B shows the growth of $10,000. Talmud Dividend Equities (s.talm) is the top performer, with Talmud Equities and Gold (s.talg) performing nearly as well.
Exhibit B: Growth of $10,000 using Talmud Portfolio Recipes (source: VizMetrics RecipeInvesting)
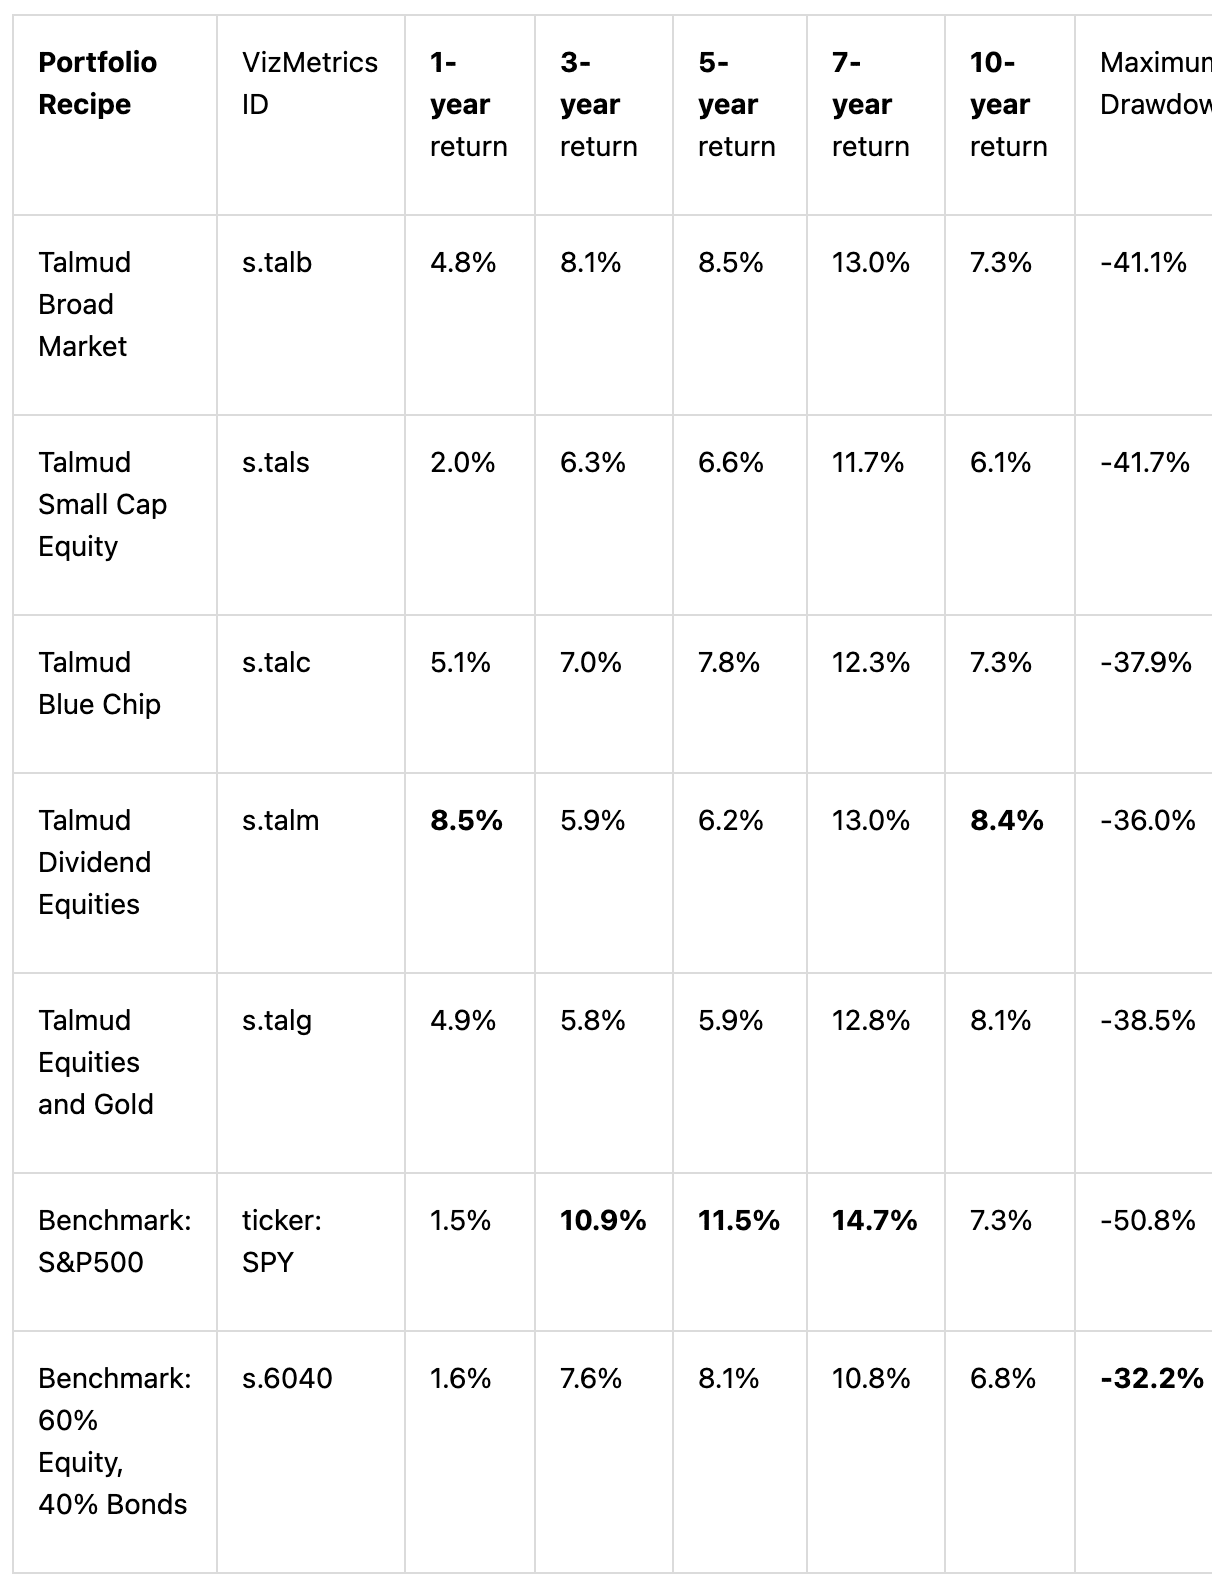
To examine risk, we calculated the maximum drawdown over the past 10 years. Looking back 10 years is helpful since this includes the volatile period of 2008-2009. Exhibit C shows the risk and return for each portfolio recipe. The best performer for each period is in bold.
Exhibit C: Risk and Return of Talmud Portfolio Recipes (10 years ending May 2016) (source: VizMetrics RecipeInvesting)
Step 4. Compare risk vs. return using scatterplots
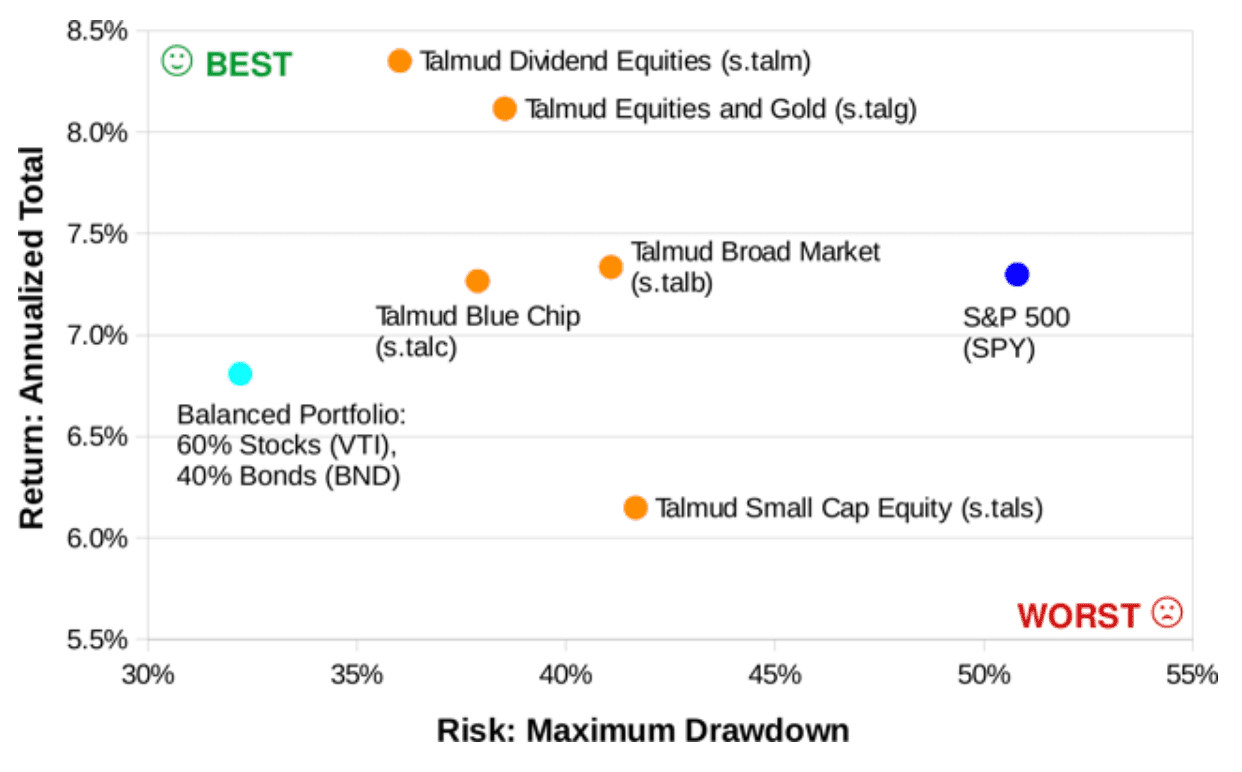
Now let's compare the five portfolio recipes to benchmarks. We used the S&P 500 Index (SPY) and a Balanced Portfolio of 60% stocks and 40% bonds. The scatterplots let us visualize risk and return measures simultaneously. The low-risk, high-return portfolios are closest to the top left. Exhibit D shows s.talm significantly outperforming both SPY and the Balanced Portfolio.
Exhibit D: Risk vs. Return for 5 Talmud Portfolio Recipes and 2 Benchmarks (10 years ending May 2016) (source: VizMetrics RecipeInvesting)
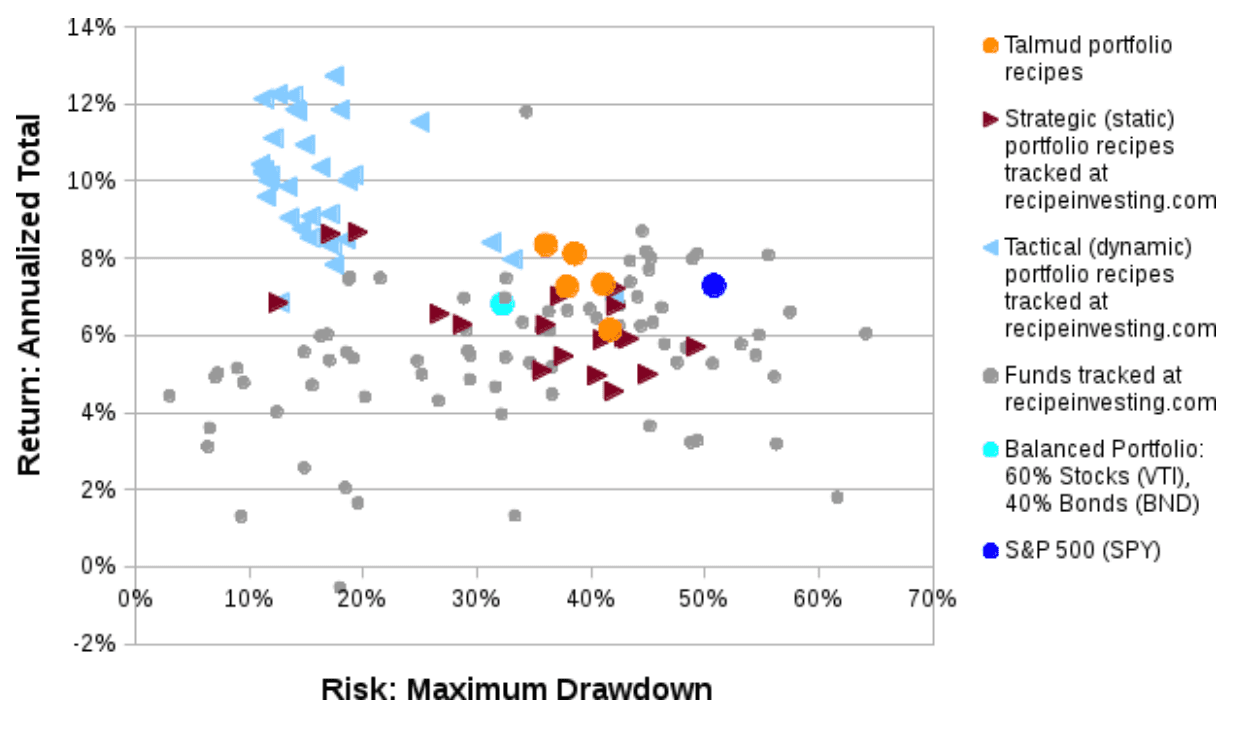
Now let's add more portfolios to the scatterplot to see how these Talmud recipes compare to a larger set of portfolio recipes. Exhibit E (below) shows the risk and return over the past 10 years, with the Talmud portfolio recipes indicated by orange dots. The benchmarks are shown as blue dots.
The light blue triangles at the top left of the scatterplot represent tactical (i.e., dynamic) portfolio recipes which VizMetrics publishes and tracks monthly. The gray dots show mutual funds and ETFs run by professional managers. The red triangles show strategic (i.e., static) portfolio recipes.
Since the Talmud portfolio recipes also use a strategic (i.e., static) approach, it's interesting to see how the orange dots compare to other easy-to-implement, static portfolio recipes (the red triangles). We see two red triangles above and to the left of the Talmud portfolio recipes. These represent low-equity portfolios (s.plus and s.noeq) that may deserve further investigation.
Exhibit E: Risk vs. Return for All Portfolio Recipes tracked by VizMetrics (10 years ending May 2016) (source: VizMetrics RecipeInvesting)
Conclusions
The five portfolio recipes based on the Talmud approach have similar results, but "Talmud Dividend Equities" (s.talm) has the best combination of risk and return.
Compared to the S&P 500 Index (represented by the exchange-traded fund SPY), s.talm has lower risk and higher return over the last 10 years.
Compared to the Balanced Portfolio (s.6040), s.talm has higher return with more risk. However, the added return is greater than the added risk on a relative basis. The 10-year maximum drawdown for s.6040 is -32.2% and the maximum drawdown for s.talm is -36.0%.
But the annual return for s.talm is 8.4% which outshines the Balanced Portfolio's 6.8% return.
as published on
Disclosure: I am/we are long EFA, IWM, GLD, TLT, QQQ, SPY, EEM. I wrote this article myself, and it expresses my own opinions. I am not receiving compensation for it. I have no business relationship with any company whose stock is mentioned in this article.