Article - Finding Tactical Portfolios That Outperform Warren Buffett's Berkshire Hathaway
Finding Tactical Portfolios That Outperform Warren Buffett's Berkshire Hathaway
- Warren Buffett's Berkshire Hathaway has performed well over the the past 15 years.
- We searched for portfolio recipes (i.e., tactical models) that offered lower risk and higher return.
- We found some tactical portfolio recipes with algorithms and asset allocation methodologies that can offer greater return with less risk.
- These tactical portfolio recipes apply a few different approaches: adaptive asset allocation, momentum-based investing, and variance minimization.
Background
American Investor Warren Buffett, the "Oracle of Omaha," is considered one of the most successful investors globally and currently ranks #4 on the Forbes billionaire list. His multinational conglomerate, Berkshire Hathaway (BRK.A) (BRK.B), has averaged annual growth of 19.0% to its shareholders since 1965 while employing large amounts of capital and incurring minimal debt.
The Question to Answer
But we wanted to know: can a tactical ETF portfolio beat the formidable Buffett?
To answer this, we compared the performance of Berkshire Hathaway to over 250 other asset allocation portfolio recipes that we track at RecipeInvesting.com. We compared BRK.A to both tactical portfolio recipes (which are dynamically reallocated monthly) and strategic portfolio recipes (which have a fixed allocation and are rebalanced monthly).
Four portfolio recipes emerged as winners that consistently beat the Berkshire Hathaway Portfolio (BRK.A) during the analysis. The four winners have a higher return and lower risk when compared with BRK.A over the most recent 1-, 3-, 10-, and 15-year time periods. Two of these portfolios also beat BRK.A over the 5- and 7-year time periods.
Our Approach
To answer the question and find the portfolios that outperform BRK.A, we needed to analyze and compare BRK.A to our collection of leading asset allocation portfolios. Here's what we did:
- Rank all the asset allocation portfolios in our collection by total return.
- Identify the portfolios that beat BRK.A based on total return.
- Add an additional risk filter to see which portfolios still beat BRK.A.
We created a scatterplot with risk on the Y-axis and return on the X-axis to visualize the risk and return for all the different portfolios simultaneously.
Each colored square on Exhibit A (see below) is a distinct, investable asset allocation portfolio (what we call a "portfolio recipe"). The gray dots also show some asset allocation mutual funds. The vertical axis shows total return and the horizontal axis show the risk measure (Downside Deviation).
Exhibit A: Risk vs. Return Scatterplot for Portfolio Recipes over the past 15 years.
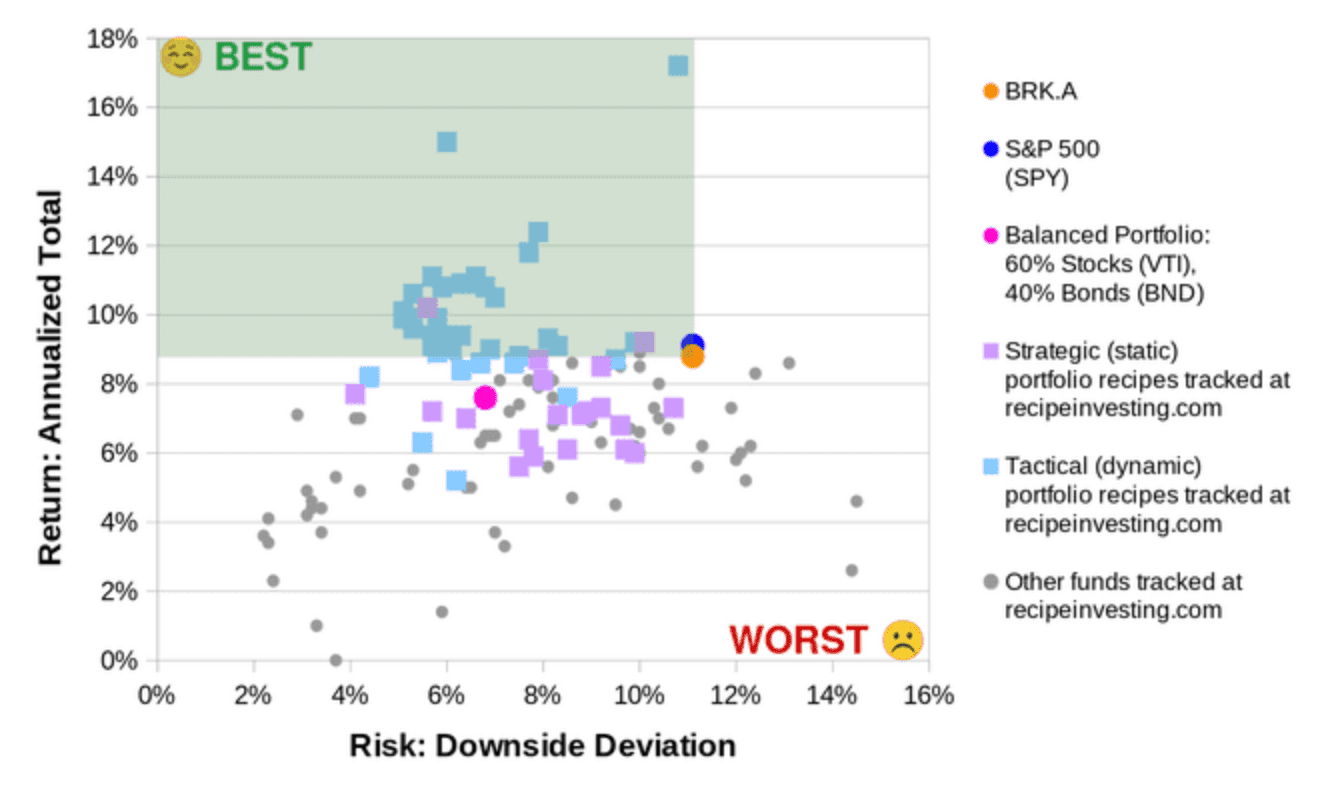
BRK.A appears as an orange dot. The scatterplot allows us to quickly identify the portfolios with greater return and lower risk compared to BRK.A. Those portfolios appear as dots in the green shaded area which is "northwest" of BRK.A. We have also plotted the risk and return for two benchmarks:
- The S&P 500 Equity Index using SPY as a proxy. This is the blue dot that is just above (and behind) the orange dot. It's interesting to note that the risk-return performance of BRK.A is similar to SPY when looking at this entire 15-year period.
- A Balanced Portfolio using 60% U.S. Equity (VTI) and 40% U.S. Total Bond Market (BND). This portfolio is the magenta dot. This portfolio has provided a lower total return than BRK.A or SPY, but with significantly less risk.
Now let's look at the results from each step in more detail and investigate the winning portfolio recipes.
Step 1: Rank the Asset Allocation Portfolios by total return
We ranked total returns over six different time periods (1, 3, 5, 7, 10, and 15 years) using data through October 2020 from RecipeInvesting.com. We compared more than 250 asset allocation portfolios that we track at RecipeInvesting.com to BRK.A. For evaluating total return, we included reinvestment of dividends and distributions.
Step 2: Identify Portfolios that beat BRK.A in terms of total return
Next we counted the Portfolio Recipes that outperformed BRK.A's total return. Exhibit B lists the portfolio counts over each time period.
Exhibit B: Number of Portfolio Recipes Outperforming BRK.A based on Total Return.
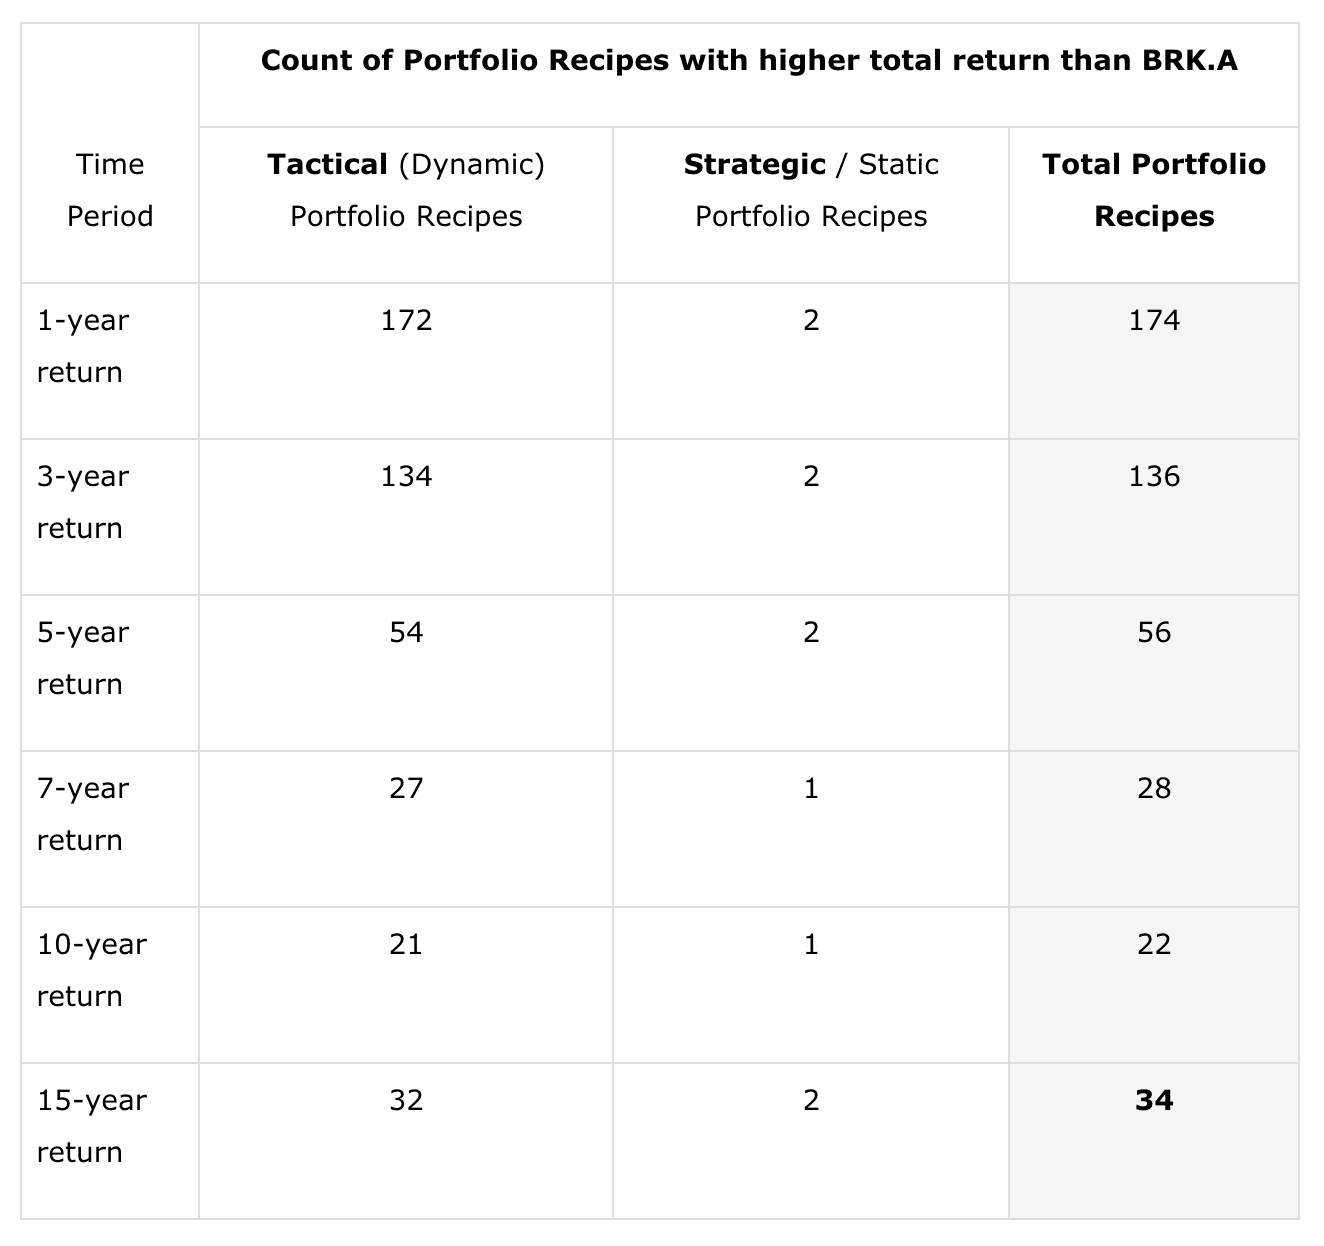
Over the past 15 years, 34 portfolios beat BRK.A in terms of total return. The full list of these Portfolio Recipes is available on the page "34 Portfolios with Greater Annual Return than Warren Buffett over the Last 15 Years." You may also access the complete list of risk metrics for BRK.A.
Step 3: Identify Portfolios that beat BRK.A in terms of both Return and Risk
Now that we have found the Portfolio Recipes that beat BRK.A based on Total Annual Return, we need to apply the Risk filter. For evaluating Risk, we have a several options for choosing a metric, including the following:
- Maximum Drawdown. This is useful because it gives us the greatest percentage loss for the portfolio over a given period, based on month-end closing values. However, this tends to measure the single greatest downward variation, not the average variation. If the period used for calculating Maximum Drawdown is too short then this metric will not capture large market drops, such as the 2008 meltdown.
- Standard Deviation. This widely used metric gauges the "average variation" by calculating the average difference of the monthly returns compared to the mean (average) return. However, this metric does not distinguish between upside variation (which we enjoy) and downside variation (which we don't like).
- Downside Deviation. This is useful because it's similar to standard deviation but only considers the downside (bad) deviation and does not penalize portfolios that may have significant upside deviation.
Due to its advantages, we chose to use Downside Deviation as the risk filter in our analysis.
Starting with the 34 portfolio recipes that have a higher Total Return and a lower Downside Deviation than BRK.A over the 15-year period, we can now further refine those using Downside Deviation as a risk metric.
After applying the additional risk filter, we found that four Portfolio Recipes beat BRK.A over the 1-, 3-, 10-, and 15-year periods in terms of both risk and return. Of those, two Portfolio Recipes also beat BRK.A over the 5- and 7- year periods.
The four Portfolio Recipes that beat BRK.A are as follows:
- Adaptive Allocation 'F' Portfolio (t.aaaf). This portfolio recipe ranks 9 ETFs (DBC, EFA, EEM, GLD, TLT, SPY, QQQ, IYR, IWM) based on total return over the past 180 trading days. Then the algorithm picks the top 5 ETFs. Then it chooses a weight (percentage allocation) for each of the five chosen ETFs in such a way that the overall portfolio's volatility is minimized using a minimum variance algorithm looking back over the last month.
Pure Momentum Portfolio (t.pure). This portfolio recipe ranks a set of 6 asset class ETFs (SPY, TLT, QQQ, MDY, IWM, EEM) based on a weighted moving average of returns over the past 3 months. Then the algorithm chooses the top-ranked ETF and applies a 100% allocation to that ETF for the upcoming month.
Minimum CDaR Portfolio (t.cdar). This portfolio recipe chooses an allocation from a set of 8 asset class ETFs (EFA, EEM, GLD, TLT, SPY, QQQ, IYR, IWM) based on the combination that will minimize the portfolio's Conditional Drawdown at Risk (CdaR) over the past few months.
Minimum Variance 'A' Portfolio (t.mvar). This portfolio recipe creates a covariance matrix that includes the covariance of each possible pair of assets from a set of 8 asset class ETFs (EFA, EEM, GLD, TLT, SPY, QQQ, IYR, IWM). The lookback period for calculating the covariance is 80 trading days. t.mvar then solves to find the combination of asset weights (i.e., percentage allocations) that gives the portfolio the lowest overall covariance.
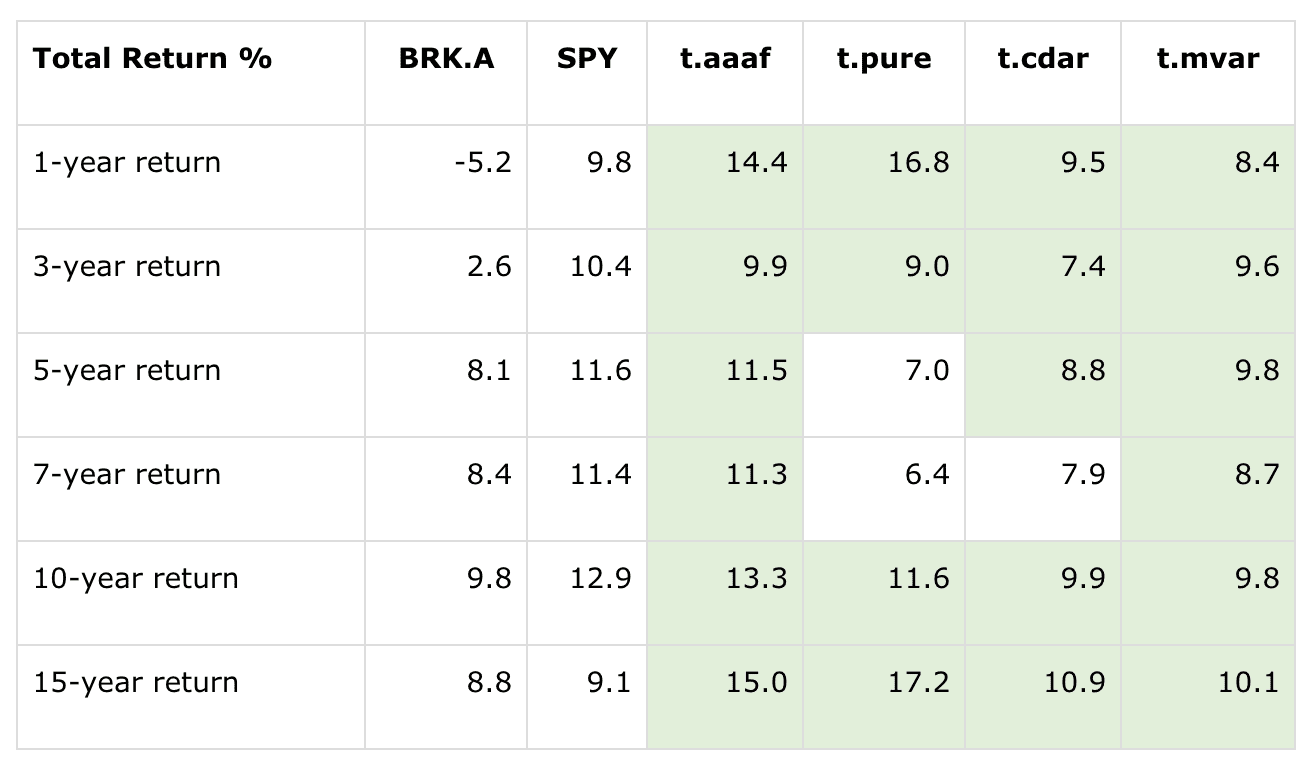
Exhibit C (below) shows the total annualized return for BRK.A, the S&P 500 (again using SPY as a proxy), and the four tactical portfolio recipes. The green cells show the data points that beat BRK.A by having a greater total return. We can see the following:
- t.pure has the highest 15-year total return at 17.2%, but has lagged behind BRK.A in the 5-year and 7-year time periods
- t.cdar fell behind BRK.A in the 7-year period.
- t.aaaf and t.mvar have beaten BRK.A over all six time periods.
Exhibit C: Comparing Total Return of BRK.A vs. Four Tactical Portfolios
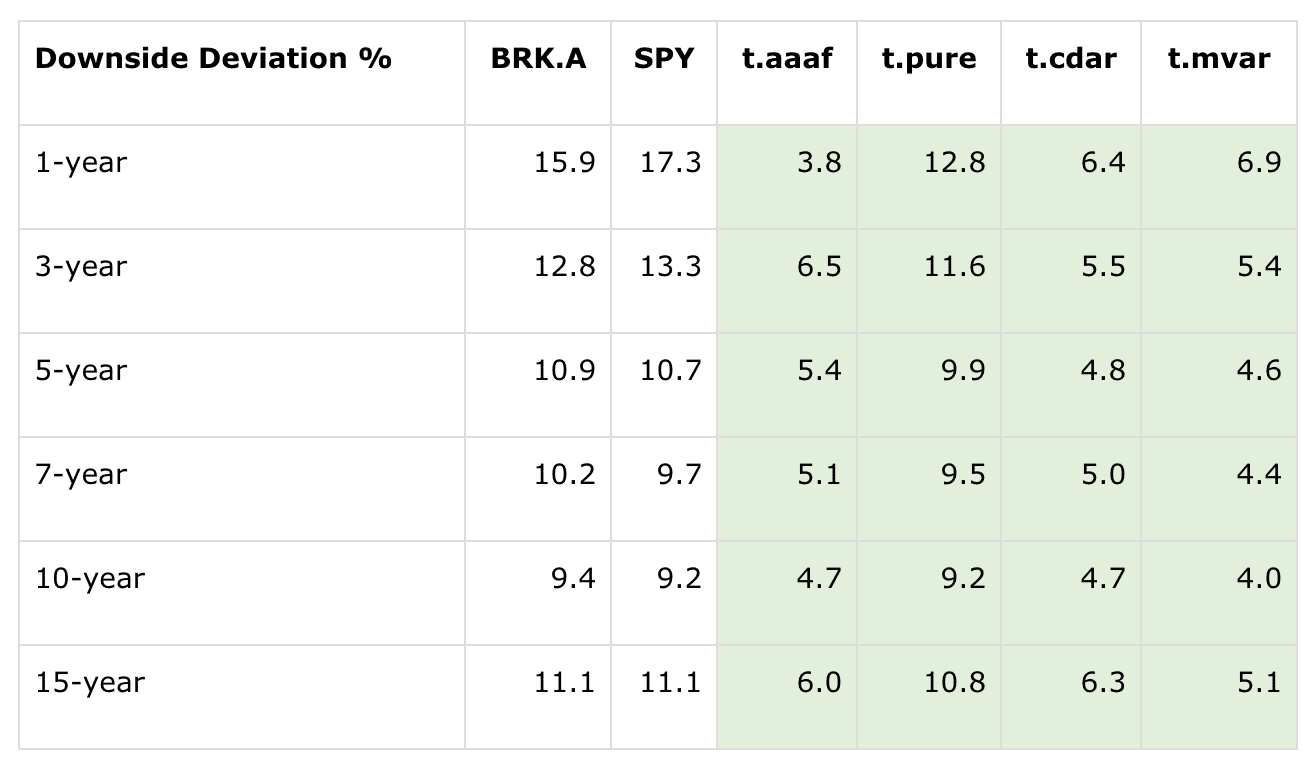
Now let's look at the risk numbers. Exhibit D (below) shows the Downside Deviation for BRK.A, SPY, and the four tactical portfolio recipes over the six different periods. The green cells show the data points that beat BRK.A by having less risk. All four of the tactical portfolio recipes exhibited less risk (as measured by Downside Deviation) over all six time periods.
Exhibit D: Comparing Downside Deviation of BRK.A vs. Four Tactical Portfolios
Growth of $10,000 invested
Let's also look at the results of having invested a theoretical $10,000 in these portfolios 15 years ago. This calculation reinvests the returns and doesn't consider trading fees and taxes.
- $10,000 invested in BRK.A grew to $35,435
- $10,000 invested in SPY grew to $36,929
- $10,000 invested in t.aaaf grew to $81,371
- $10,000 invested in t.pure grew to $108,122
- $10,000 invested in t.cdar grew to $47,203
- $10,000 invested in t.mvar grew to $42,346
Conclusion
There is no question that Warren Buffett is an astute investor, and the overall performance (even including risk considerations) of Berkshire Hathaway over the past decades has demonstrated that. However, tactical portfolio recipes with algorithms and asset allocation methodologies can offer greater return with less risk. These tactical portfolio recipes apply a few different approaches: adaptive asset allocation, momentum-based investing, and variance minimization.
as published on
Disclosure: I am/we are long EFA, IWM, GLD, TLT, QQQ, SPY, EEM. I wrote this article myself, and it expresses my own opinions. I am not receiving compensation for it. I have no business relationship with any company whose stock is mentioned in this article.