Article - Closed End Gold Funds Vs. The #1 Gold ETF
Closed End Gold Funds Vs. The #1 Gold ETF
What's better for owning gold... a closed-end fund or the popular ETF GLD?
To answer this we compared GLD, the SPDR Gold Trust ETF, to three closed-end funds:
We're aware of structural differences between these closed-end funds and GLD: tax considerations, fees, premium vs. NAV, spreads, country of origin (U.S. or Canada), and trading volume. Some of these differences might pique our interest in the closed-end funds. But what about returns, correlation, and risk? Does choosing a closed-end fund sacrifice returns or increase risk?
Let's take a quantitative look at the risk and return differences between these products.
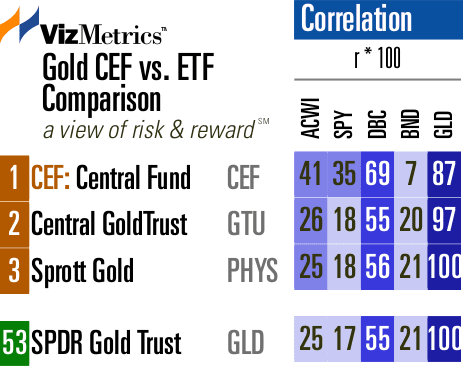
Correlation to GLD
First, how well do the closed-end funds correlate with GLD?
- PHYS has a perfect 1.00 coefficient of correlation with GLD. This is based on monthly total return figures over the past three years. The chart below shows the coefficient of correlation (R) multiplied by 100.
- GTU has a very strong correlation of 0.97.
- CEF has a 0.87 correlation, which is still strong, but is not as tight as the others due to CEF's silver exposure which makes up a significant portion of this fund.
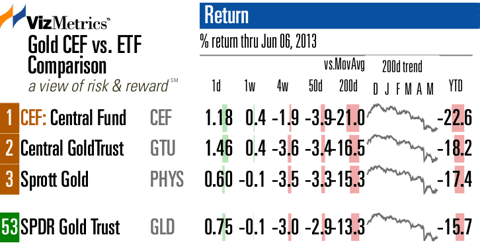
Recent returns
On a day-to-day basis, returns vary considerably as seen in the 1-day (1d) column in the chart below. Even over a recent 4-week period, returns vary from -1.9% for CEF to -3.6% for GTU. The year-to-date returns are also not as tightly clustered as we expected, ranging from -17.4% to -22.6% .
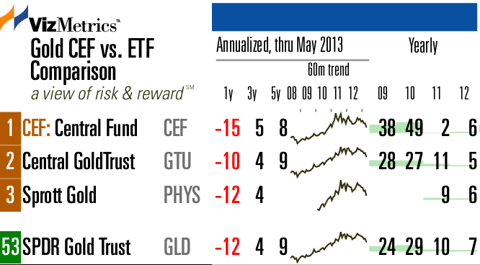
Annual Returns
Now let's take a step back and look at the 1-year and 5-year returns.
For the 12 months ending May 31, GTU lost the least with a return of -10% compared to GLD's -12%.
For the 60 months ending May 31, the ranking is as follows:
- GTU +9.21% over the 5 years
- GLD +8.91%
- CEF +7.64%.
Note that PHYS isn't old enough to have 5-year returns.
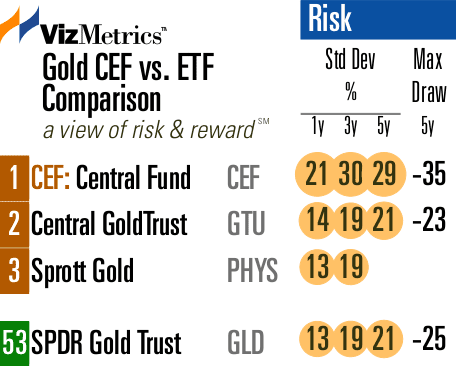
Risk Differences
The standard deviations for GTU, PHYS, and GLD have been in lockstep over the past three years. But CEF shows higher variability with a significantly higher standard deviation over the 1-year, 3-year, and 5-year timeframes. Interestingly, GTU has a slightly better maximum drawdown over the past 60 months (-23%) compared to GLD's maximum drawdown of -25%. CEF, with its silver exposure, had the largest drawdown.
For a chart with more risk measures for these funds (including Beta, R-squared, Modigliani, and Alpha) see our Gold Funds: Risk Analysis.
To review risk vs. return scatterplots of GLD and the three closed-end funds (on a 1-year, 3-year, and 5-year basis) see our Gold Funds: Risk vs. Return Scatterplots.
Conclusion
GTU is worth a look as a complement or replacement for GLD. It compares favorably to GLD over the 5-year period with a slightly better return, lower drawdown, and similar standard deviation. PHYS has a shorter track record and has performed worse than GLD over the past three years. CEF is more volatile than GLD since it is not a pure gold fund, but includes silver exposure.
as published on
Disclosure: I am/we are long EFA, IWM, GLD, TLT, QQQ, SPY, EEM. I wrote this article myself, and it expresses my own opinions. I am not receiving compensation for it. I have no business relationship with any company whose stock is mentioned in this article.