Article - 8 Portfolio Recipes That Beat The Permanent Portfolio
8 Portfolio Recipes That Beat The Permanent Portfolio
- The Permanent Portfolio is an approach to creating a diversified portfolio using a static asset allocation.
- This approach to investing has been implemented by a mutual fund and an exchange-traded fund.
- We examine risks and benefits of this approach and evaluate other asset allocation methods that produce better results with less risk.
- We identify 8 portfolio recipes which outperform the Permanent Portfolio on the basis of both lower risk and higher return.
- These include 3 tactical ETF portfolios, 2 static ETF portfolios, and 3 mutual funds.
"It's not how much money you make, but how much money you keep, how hard it works for you, and how many generations you keep it for."
- Robert Kiyosaki
The idea of a "Permanent Portfolio" may tempt some investors. The premise is simple: invest in a carefully chosen collection of non-correlated assets and occasionally rebalance. It's easy, but how does it perform? And what are the risks?
One implementation of this approach is the Permanent Portfolio mutual fund (MUTF:PRPFX). This fund opened in 1982 and invests in a diversified (but static) mix of conventional and alternative assets. This gives investors access to a reduced equity portfolio that uses a "permanent," fixed allocation designed to weather a variety of market conditions.
This fund has a target allocation of gold (20%), silver (5%), Swiss Francs (10%), real estate and natural resource stocks (15%), aggressive growth stocks (15%), and dollar assets (35%). The actual portfolio allocation may vary slightly over time, but it maintains its target allocation as a basis of investing. A similar approach is available in an ETF: the Global X Permanent ETF (NYSEARCA:PERM).
Questions to Answer
In this article we'll answer the following questions:
- What are some of the advantages of the Permanent Portfolio?
- How is it correlated with other asset classes?
- What other portfolios beat the Permanent Portfolio in terms of both risk and return?
Question 1. What are some of the advantages of the Permanent Portfolio?
Firstly, we can note that the Permanent Portfolio is not setting any records for total return. Exhibit A (below) shows a modest annual 2.0% return over the last five years. The fund's stated objected is to "preserve and increase the purchasing power value of its shares over the long term." Over the last decade, this chart points more to "preserve" rather than "increase."
Exhibit A: Total Return over the past 5 years
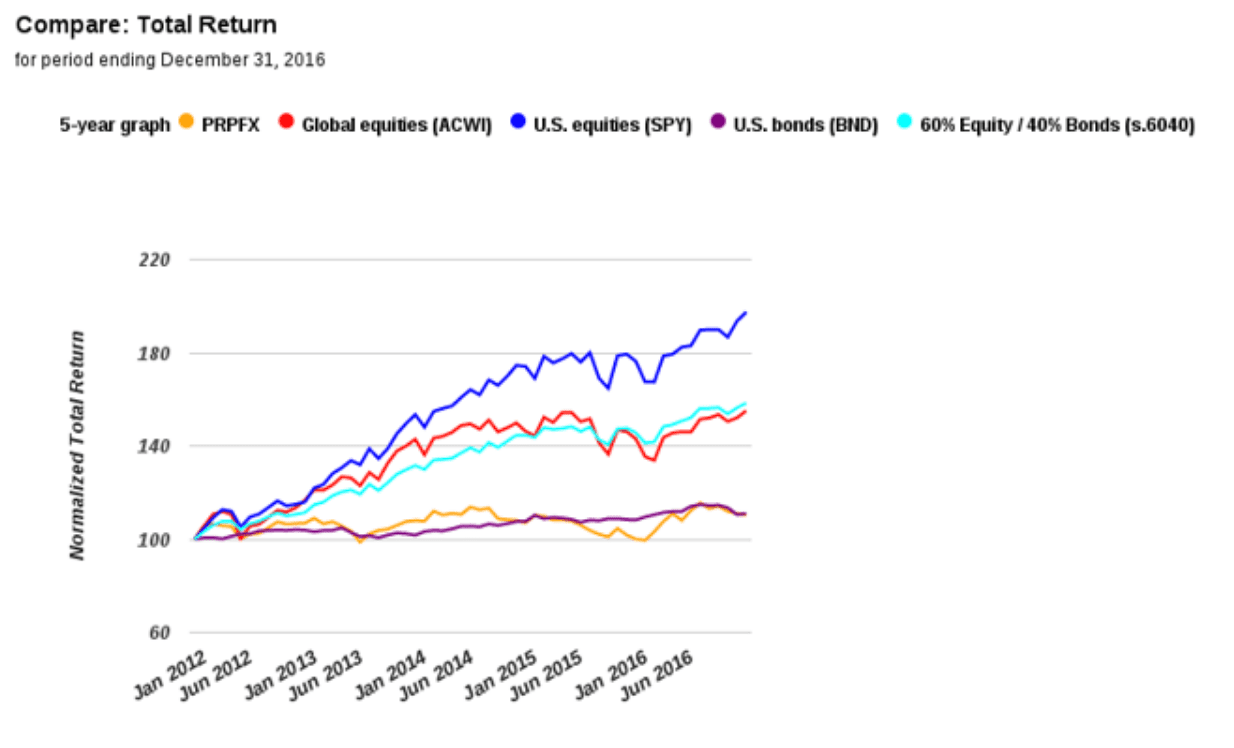
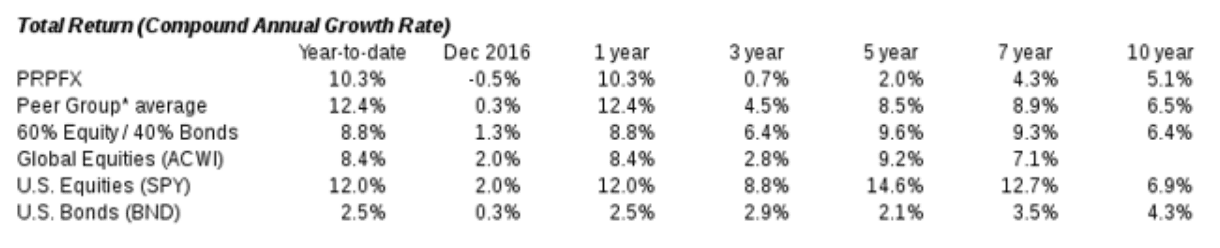
Exhibit B (below) adds the 10-year return and we start to see a bit more benefit. In the far right column, PRPFX has an 5.1% annual return over the past 10 years, compared to SPY's 6.9% return.
Exhibit B: Total Return over the past 10 years
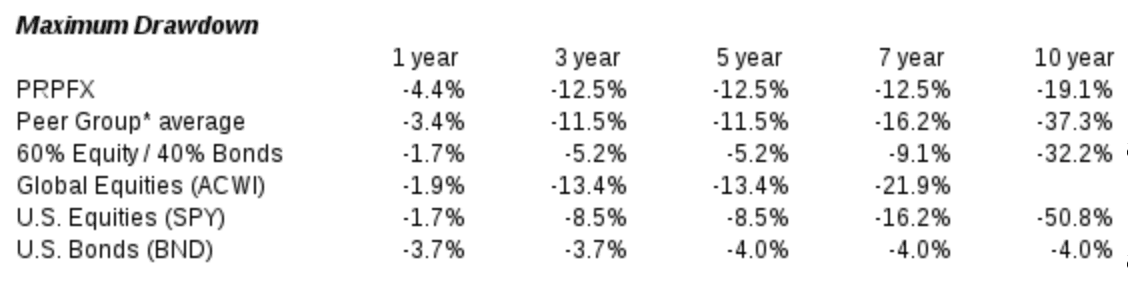
However, PRPFX offers considerably less drawdown over the past 10 years when compared to SPY.
Exhibit C (below) shows Maximum Drawdown (the peak-to-trough change in portfolio value, based on total return) for PRPFX vs. a few benchmarks. The 19.1% maximum drawdown is considerably less than SPY's 50.8% drawdown.
Exhibit C: Maximum Drawdown over the past 10 years
PRPFX also has a lower correlation to some asset classes, which we will investigate next.
Question 2. How is the Permanent Portfolio correlated with other asset classes?
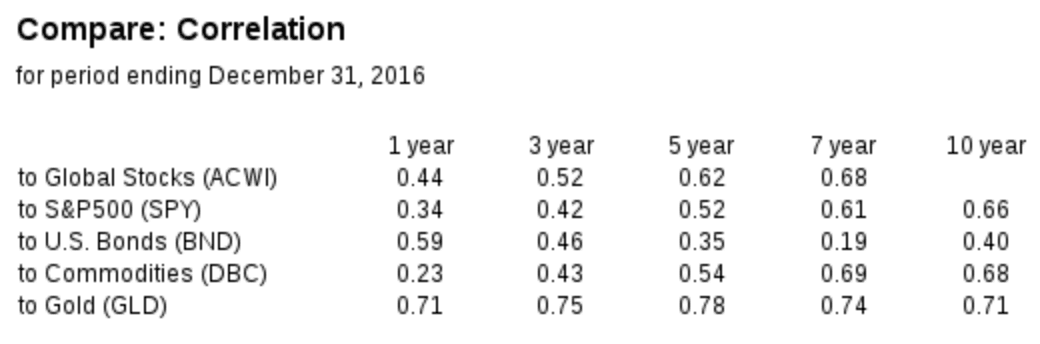
Exhibit D (below) shows the correlation of PRPFX to benchmarks. The Permanent Portfolio has a positive, but moderate, correlation to bonds (NYSEARCA:BND) and stocks (NYSEARCA:SPY). The correlation to gold (NYSEARCA:GLD) remains strong at 0.71 or higher for all periods.
Exhibit D: Correlation of the Permanent Portfolio to Benchmarks
Question 3. What other portfolios beat the Permanent Portfolio in terms of both risk and return?
Let's look for asset allocation approaches (or "Portfolio Recipes" as we call them) that outperform PRPFX on the basis of both risk and return. At Recipeinvesting.com, we track over 200 portfolio recipes in three main categories: a) tactical, do-it-yourself ETF Portfolio Recipes, b) static, do-it-yourself ETF Portfolio Recipes, and c) professionally managed funds. The portfolios we're interested in appear in the green-shaded region in the Exhibit E scatterplot (below).
Exhibit E: Risk vs. Return for Various Portfolio Recipes
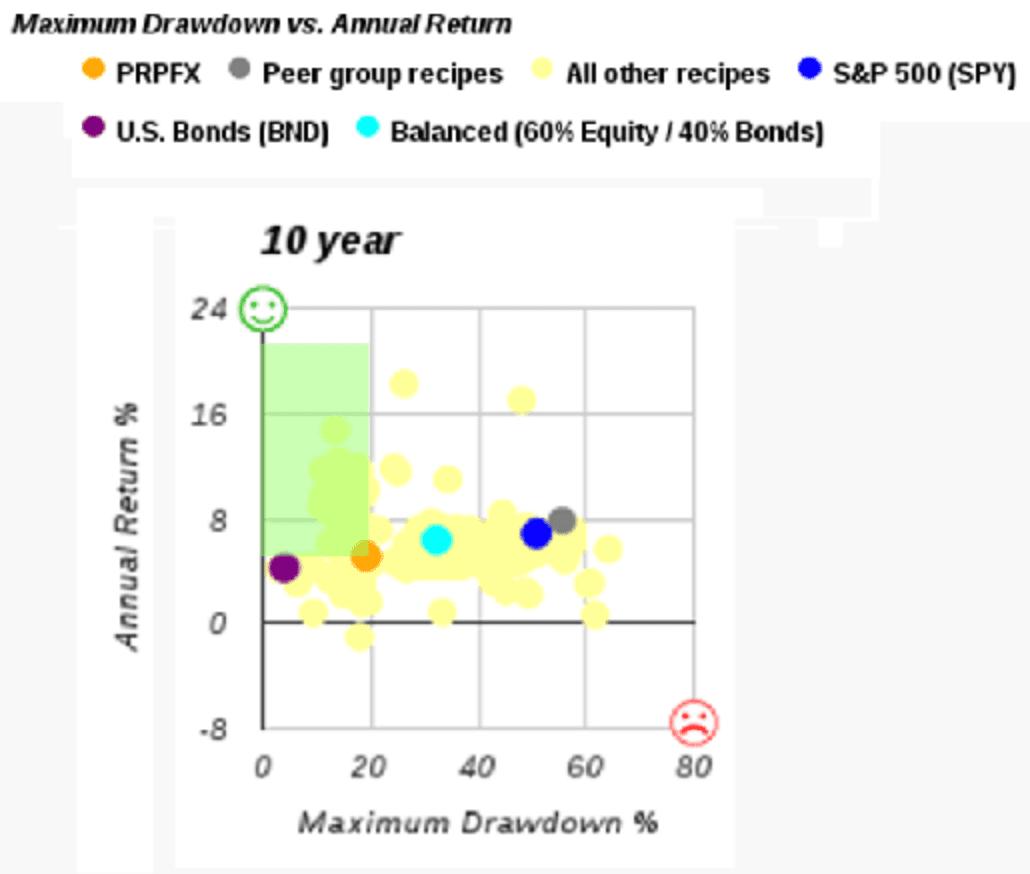
The yellow dots in the scatterplot represent the Portfolios Recipes we track at Recipeinvesting.com. We can see several in the green-shaded area that outperform the Permanent Portfolio. The orange dot represents the Permanent Portfolio: over the past 10 years (through December 31, 2016), the Permanent Portfolio has an annual return of 5.1% with a maximum drawdown of 19.1%.
Let's look at specific portfolios in the green-shaded area that outperform the Permanent Portfolio.
a. Tactical Portfolio Recipes using ETFs
These are ETF model portfolios that are updated monthly based on an underlying algorithm. There are 30 tactical portfolios in the green-shaded region which outperform the Permanent Portfolio, but we will highlight only three here.
- Adaptive Allocation F Portfolio (t.aaaf) has an annual return of 14.7% over the past 10 years with maximum drawdown of 13.4%. The current asset allocation for this Portfolio recipe is DBC=42.01%, EEM=0.02%, IWM=0.03%, QQQ=4.51%, SPY="53.43%." This portfolio's algorithm ranks 9 asset class ETFs and picks the top 5 ETFs based on total return over the past 180 trading days. Then it chooses a weight (percentage allocation) for each of the 5 chosen ETFs in such a way that the overall portfolio's volatility is minimized using a minimum variance algorithm. The minimum variance algorithm uses standard deviation with a lookback period of 20 trading days.
- Minimum Mean Absolute Deviation Portfolio (t.madm) has an annual return of 9.6% over the past 10 years with maximum drawdown of 11.2%. The current asset allocation for this portfolio recipe is GLD="28.47%," SPY="56.46%," TLT="15.07%." This portfolio's algorithm chooses an allocation from a set of 8 asset class ETFs which minimizes the mean absolute deviation. The algorithm uses a lookback period of 80 trading days.
- Minimum Variance Portfolio A (t.mvar) has an annual return of 9.5% over the past 10 years with maximum drawdown of 11.2%. The current asset allocation for this portfolio recipe is GLD="25.43%," SPY="52.31%," TLT="22.26%." This portfolio's algorithm creates a covariance matrix that includes the covariance of each possible pair of assets from a set of 8 asset class ETFs. The lookback period for calculating the covariance is 80 trading days. The algorithm then solves to find the combination of asset weights (i.e., percentage allocations) that gives the portfolio the lowest overall covariance.
b. Strategic Portfolio Recipes using ETFs
These are static ETF model portfolios with ingredients that do not change month-to-month but are rebalanced monthly to match the target allocation. Two strategic portfolios outperformed the Permanent Portfolio.
- Harry Browne-Inspired Portfolio (s.brow) has an annual return of 6.2% over the past 10 years with maximum drawdown of 12.6%. This portfolio allocates equally to stocks using the Vanguard Total Stock Market ETF (NYSEARCA:VTI), the long-term U.S. Treasury index using the iShares 20+ Year Treasury Bond ETF (NYSEARCA:TLT), cash (represented by the iShares 1-3 Year Treasury Bond ETF (NYSEARCA:SHY), and gold .
- Permanent Plus Portfolio (s.plus) has an annual return of 7.8% over the past 10 years with maximum drawdown of 17.1%. This portfolio starts with Harry Browne's 4-part portfolio, but then removes the cash component to increase the portfolio's total return. The recipe allocates one-third each to VTI, TLT, and GLD. Once cash is not a part of the portfolio the risk increases somewhat but the annual return improves.
Active Managers
These are actively managed funds with professional managers.
- Vanguard Wellesley Investor (MUTF:VWINX) has an annual return of 6.8% over the past 10 years with maximum drawdown of 18.8%.
- Hundredfold Select (MUTF:SFHYX) has an annual return of 5.8% over the past 10 years with maximum drawdown of 16.8%.
- Fidelity Strategic Income (MUTF:FSICX) has an annual return of 5.7% over the past 10 years with maximum drawdown of 16.2%.
Conclusion
While the Permanent Portfolio does offer simplicity, there a better investment alternatives to the Permanent Portfolio, based on our research at RecipeInvesting.com
- For "set it and forget it" investors, three mutual funds offer professional management without needing to rebalance.
- For investors looking for an easy-to-maintain ETF portfolio, s.brow and s.plus offer a similar approach to PRPFX, but with better results.
- For investors or advisors willing to rebalance monthly, the Portfolio Recipes t.aaaf and t.mvar offer the prospect of much higher return with less risk.
as published on
Disclosure: I am/we are long EFA, IWM, GLD, TLT, QQQ, SPY, EEM. I wrote this article myself, and it expresses my own opinions. I am not receiving compensation for it. I have no business relationship with any company whose stock is mentioned in this article.