Article - 6 More Portfolio Recipes That Beat The "Lazy Portfolios"
6 More Portfolio Recipes That Beat The "Lazy Portfolios"
Summary
- Six years after our original article, we reinvestigate Paul Ferrell’s 8 “Lazy Portfolios” – and analyze the ever-evolving investment landscape for new higher-return, lower-risk alternatives.
- 3 of our 4 original alternatives still beat all the Lazy Portfolios in every metric.
- Since 2015, we’ve found 40 new portfolio recipes that outperform the Lazy Portfolios over the last 15 years.
- Of these 40, six portfolio recipes stand out due to their superior performance or simplicity.

Six years ago, we took it upon ourselves to investigate four portfolio recipes that consistently beat Paul B. Farrell’s eight “Lazy Portfolios” in terms of both risk and return. Now that plenty of time has passed – and the events of the past year have unfolded upon the market – we thought we’d revisit the question… and ask a couple more.
Lazy Portfolios: Then and Now
When we talk about “Lazy Portfolios,” we’re referring to a fixed asset allocation that undergoes periodic rebalancing. At RecipeInvesting, we call this a “strategic portfolio recipe,” but you may know it as a buy-and-hold portfolio, static portfolio, or passive allocation. In contrast, a tactical (or dynamic) portfolio changes its allocation over time.
Each of the Lazy Portfolios in question follows an internal theme. While we’re focusing on performance over origin stories, it’s worth noting that these portfolios aren’t a haphazard by-product of some college intern’s investment dreams. Typically, they’re modeled after other standing asset allocations, such as Ted Aronson’s family portfolio. But following a prestigious pedigree doesn’t mean other portfolios can’t (or don’t) perform better.
In this article, we’ll take a look at how each of these Lazy Portfolios performed then against our top picks at the time – and how things have changed in the years since.
The Original Lazy Eight
When we wrote our original article, we examined the following eight Lazy Portfolios tracked by Paul Farrell, each holding between 3 and 11 Vanguard mutual funds. For ease of reference, we have assigned a RecipeInvesting ID to each portfolio (shown in parentheses).
Lazy Portfolio: Aronson Family Taxable (s.aron)
- 5% each: VEURX, VWEHX, VISGX, VISVX, VTSMX
- 10% each: VEIEX, VEXMX, VUSTX
- 15% each: VIPSX, VPACX, VFINX
Lazy Portfolio: Fundadvice Ultimate Buy & Hold (s.buyh)
- 6% each: VFINX, VEIEX, VGSIX, NAESX, VISVX, VIVAX
- 8%: VIPSX
- 12% each: VFISX, VTMGX, VTMGX
- 20%: VFITX Lazy
Portfolio: Coffeehouse (s.coff)
- 10% each: VFINX, VGSIX, NAESX, VISVX, VIVAX, VGTSX
- 40%: VBMFX
Lazy Portfolio: Margaritaville (s.marg)
- 33% each: VIPSX, VGTSX
- 34%: VTSMX
Lazy Portfolio: Dr. Bernstein's No Brainer (s.nobr)
- 25% each: VFINX, VEURX, NAESX, VBMFX
Lazy Portfolio: Second Grader's Starter (s.seco)
- 10%: VBMFX
- 30%: VGTSX
- 60%: VTSMX
Lazy Portfolio: Dr. Bernstein's Smart Money (s.smar)
- 5% each: VEIEX, VEURX, VPACX, VGSIX, NAESX
- 10% each: VISVX, VIVAX
- 15%: VTSMX
- 40%: VFSTX
Lazy Portfolio: Yale U's Unconventional (s.yale)
- 5%: VEIEX
- 15% each: VTMGX, VIPSX, VUSTX
- 20%: VGSIX
- 30%: VTSMX
The goal of our analysis was to see how the Lazy Portfolio compared to our set of 200+ strategic and tactical portfolio recipes. We analyzed them using the following steps.
1. Create the Lazy Portfolios
We started by recreating the exact allocations using Vanguard mutual funds according to Farrell’s specifications. Then, we backtested performance using total monthly returns and rebalancing over a period of 10 years.
2. Run Risk and Return Analysis
Then, we looked at both risk and return over 1- and 10-year spans. We used maximum drawdown (the maximum percentage each portfolio lost in value) as our measure of risk. Total annual return (assuming reinvested distributions) served as our return measure.
Our analysis found that:
- Each Lazy Portfolio had a maximum drawdown exceeding -35% over the past ten years
- Some of the worst Lazy Portfolios exceeded -40% in the same time frame
- The best-performing Lazy Portfolio (s.yale) hit 6.5% return over 10 years, with a 1-year annual return of 0.9%
- By comparison, the SPDR S&P 500 Trust ETF (SPY) experienced a maximum drawdown of -50.8% with ten-year returns of 6.7%
3. Filter the Results
From our analysis and risk versus return scatterplots, we found several portfolio recipes that outperformed all of the Lazy Portfolios.
We also noted that the U.S. equity market – represented by our SPY benchmark – generated higher returns with higher volatility. By contrast, the Lazy Portfolios provided moderate fixed income exposure to reduce risks of profit loss against the broader market.
4. Identify the Winners
All eight Lazy Portfolios provided middle-of-the-pack performance and moderate diversification, but there were four winners that outperformed all eight Lazy Portfolios: two mutual funds and two tactical portfolios.
- Vanguard Wellesley (VWINX), an income-oriented balanced fund comprising 1/3 stocks and 2/3 bonds. The fund focuses on companies that historically pay higher-than-average dividends.
- Vanguard Balanced (VBIAX), a more traditional 60-40 split stock-bond fund that tracks two indexes representing the broader U.S. equities and taxable bond markets. VBIAX aims for broad diversification to provide moderate growth and income for long-term investors.
- Minimum Conditional Value-at-Risk Portfolio (t.cvar) is a dynamic ETF portfolio that is rebalanced monthly. It uses a dynamic asset allocation algorithm to minimize conditional value at risk (CVaR) while maximizing returns.
- Minimum Drawdown Portfolio (t.loss) is a dynamic ETF portfolio that is rebalanced monthly. It uses a dynamic asset allocation algorithm that responds to market conditions to maximize risk-adjusted returns and minimize drawdown.
Of the four, VWINX or VBIAX were better choices for those seeking lazy portfolios – in fact, because you don’t have to rebalance the recipes yourself, they’re lazier than the Lazy Eight! By contrast, tactical portfolios t.cvar and t.loss provided higher returns for those willing to rebalance their recipes monthly.
How Have the Original Four Fared?
But if there’s one thing even the greenest investor understands, it’s that markets are volatile, and clear winners in 2015 can draw the short straw in 2021. To that end, we thought we’d re-evaluate our original “winners” now that we have fifteen years of data (and a pandemic) behind us – and see if any other portfolio recipes have come close to outperforming them in the years since.
Using the same analysis process outlined above, we compared the results in Exhibit A below. Here, you can see how the “winners” (blue squares) fared against the original Lazy Portfolios (yellow diamonds). Once again SPY (purple circle) serves as our benchmark indicator.
Exhibit A: Lazy Portfolios Compared to Prior Winners (15-year Risk vs Return)
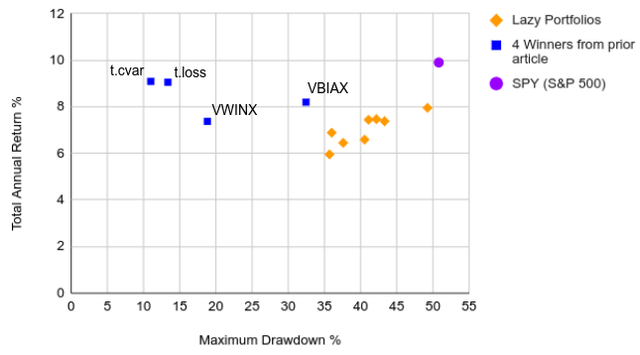
As you can see, three of the four winners still beat every Lazy Portfolio in terms of risk and return, with:
- The top two winners (t.cvar and t.loss) returning over 9% in the last 15 years at less than 14% maximum drawdown
- VBIAX hitting nearly 8.2% returns over 15 years at a higher max drawdown of -32.5%
- All Lazy Portfolio maximum drawdowns exceeding -35%
- The poorest performing winner (MUTF:VWINX) returning only 7% less than the top Lazy Portfolios (at lower risk)
You’ll also note that SPY outperformed all of our portfolios in total. However, SPY’s 10% annual return comes at a much higher risk than almost every other recipe in our analysis. Only one Lazy Portfolio, Second Grader’s Starter, approaches SPY’s brutal 50% drawdown (which occurred during 2008).
Have Any Other Portfolio Recipes Outperformed the Lazy Portfolios?
Armed with a fresh batch of data, we thought we’d explore a second question: have any portfolio recipes have outperformed the Lazy Portfolios in the last 15 years?
The short answer: yes.
We found 40 additional Portfolio Recipes that generated higher return and lower risk than all eight Lazy Portfolios over the past 15 years. These outperformers are highlighted in Exhibit B, below, as green dots. And in fact, many of these recipes outperformed our four winners (blue squares) from last time, too – as well as the S&P 500 (purple circle).
Exhibit B: Lazy Portfolios vs. Other Portfolios with Lower Risk and Higher Return Over 15 Years
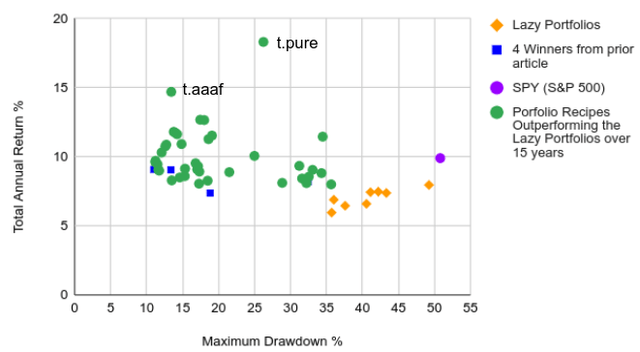
Based on our most recent data, we’re going to highlight six in particular that have performed particularly well.
Numbers 1 and 2: The Tactical Outliers
As you can see in Exhibit B, two portfolios, in particular, blew past the others to excellent returns at surprisingly moderate risk over the past fifteen years. These two tactical portfolios are far from lazy – but their performance is no joke.
The first, Adaptive Allocation F (t.aaaf), is a tactical, DIY portfolio that aims to maximize risk-adjusted returns by responding to market conditions and minimizing volatility. In the past fifteen years, it saw an annualized total return of 14.7% and a maximum drawdown of -13.4%.
The second, Pure Momentum (t.pure), is a tactical, DIY portfolio that seeks returns with an asset allocation algorithm based on recent performance. This portfolio saw an annualized total return of 18.3% and a maximum drawdown of -26.2% over the last fifteen years.
Numbers 3-5: The Managed Portfolios
Neither of the above portfolios is “lazy” in any sense of the word. On the contrary: they actively exhibit the potential benefits of monthly rebalancing and a risk-adjusted approach. But for investors seeking a hands-off approach, the following managed Portfolio Recipes are the polar opposite.
The first, Janus Balanced D (JANBX), is a mutual fund that seeks long-term capital growth by investing up to 65% of its assets in equities and the remaining in fixed-income securities and cash equivalents. Over the last fifteen years, JANBX reached 8.9% returns with a maximum drawdown of -21.5%.
The second is the Boston Partners Long/Short Equity Fund Institutional Class (BPLSX). This mutual fund seeks long-term capital appreciation and returns that top the S&P 500 Index by taking long positions in undervalued stocks and short positions in overvalued stocks, with 80% of its net assets in equities. While BPLSX proved one of the riskiest portfolios in our analysis with a maximum drawdown of -34.3% in the last fifteen years, it also hit 8.8% returns.
The third managed fund, FPA Crescent (FPACX), is a risk-driven, tactical mutual fund that strives for a targeted risk level and long-term growth by investing in a variety of securities. Over the last fifteen years, FPACX earned 8.1% in returns with a maximum drawdown of -28.8%.
Number 6: The Strategic Portfolio Recipe
In addition to the above five tactical portfolios and managed funds, one strategic Portfolio Recipe also beat the original eight Lazy Portfolios in both risk and return: the VizMetrics Permanent Plus Portfolio (s.plus).
This static, DIY portfolio invests 33.3% each in three ETFs representing the three major asset classes: U.S. Large Cap Growth Equity, U.S. Long Term Treasury Bonds, and Gold. In the last fifteen years, Permanent Plus returned 9.3% at a maximum drawdown of -17.1%.
Key Takeaways and Actionable Investing Ideas
As we discovered last time, each of the Lazy Eight portfolios provides moderate diversification and middle-of-the-road performance. But there are plenty of options for investors who want greater returns and lower risk.
All told, we found 32 tactical Portfolio Recipes, 6 managed Portfolio Recipes, and 2 strategic/static Portfolio Recipes that provided over 8% annual returns with less risk than the Lazy Portfolios. We've also provided the full list of 40 Portfolio Recipes.
- For investors seeking managed portfolios with better performance than the Lazy Eight, either JANBX or FPACX may be just what you’re looking for.
- Those who want a super-simple static portfolio should consider the Permanent Plus Portfolio (s.plus).
- But for the best performance, a tactical, hands-on portfolio, such as t.aaaf or t.pure, provides the highest returns with considerably lower risk.
as published on
Disclosure: I am/we are long EFA, IWM, GLD, TLT, QQQ, SPY, EEM. I wrote this article myself, and it expresses my own opinions. I am not receiving compensation for it. I have no business relationship with any company whose stock is mentioned in this article.