Article - 5 Types Of Portfolios With High Alpha Over The Past Decade
5 Types Of Portfolios With High Alpha Over The Past Decade
- To find investing themes based on high-alpha portfolios, we analyzed more than 150 approaches: tactical (active), strategic (passive), and professionally managed funds.
- We used alpha as a filtering mechanism over 5 different time periods: 1, 3, 5, 7, and 10 years.
- Portfolios were selected only if they beat the alpha of SPY (the S&P 500 ETF) by 2 percentage points over all five time periods.
- We identify and discuss 5 investing themes that have generated high alpha over the past decade.
Alpha is a powerful measure of risk-adjusted return. But can it point us to some specific investing themes and ideas?
This article will answer "Which portfolio recipes (i.e., asset allocation approaches) have beaten the S&P 500 over the past 10 years, and what investing themes are revealed?"
We will analyze a group of more than 150 portfolio recipes and investing algorithms, including both tactical (dynamic) and strategic (passive) approaches.
First let's quickly review the alpha metric and assess its strengths and weaknesses.
Alpha is a measure of risk-adjusted return. The higher the alpha, the better. Alpha measures a portfolio's excess return compared to a market benchmark. In this case, our benchmark will be the S&P 500 stock index, represented by the SPY exchange-traded fund. Alpha shows, as a percentage, a portfolio's excess return above the expected return given the portfolio's volatility as measured by beta.
Let's look at an example of alpha using a popular mutual fund from Vanguard.
- First look at returns: the Vanguard Wellesley mutual fund has a 9.3% annual return over the past 5 years, compared to SPY's 13.5% annual return.
- Then look at risk: VIBAX has a lower annual return than SPY, but what happens when we adjust for risk? SPY, by definition, has a beta of 1.00. VBIAX has a beta of 0.60, which means that VBIAX is theoretically 40% less volatile than the market as represented by SPY.
- Then find the alpha: Based on beta we could expect VBIAX's return to be 8.1%, which is 40% less than SPY's 13.5% return. But VBIAX actually has a return of 9.3%, which is better than its beta would have predicted. The amount of this "better than expected" return is called alpha. In this case, the alpha is around 1.2 percentage points, which is the actual 9.3% return minus the expected 8.1%. This is a slight simplification of the alpha calculation since alpha also adjusts for the risk-free rate of return.
A clear strength of using alpha as a measure of risk-adjusted return is its simplicity: It's a single percentage; the higher the better. Other measures, like the Sharpe ratio or the Sortino ratio, are unitless, so it can be more difficult to understand the scale and statistical distribution of those ratios.
A weakness of using alpha is that high volatility portfolios can sometimes outperform the market by chance, rather than by the uniqueness of the algorithm or manager. So in some cases a portfolio could have a winning alpha, but its outperformance is not statistically valid.
Now let's return to our analysis.
We'll use five different time periods to search for high-alpha investing themes: the past 1, 3, 5, 7, and 10 years. This analysis should reveal some portfolios that have performed well over the past decade, and have held up more recently, too.
Step 1. Set the selection criteria
First we remind ourselves of the alpha to beat. By definition, the alpha for SPY is 0%, since we have defined SPY as "the market". So we are looking for portfolio recipes with a positive alpha, the larger the better.
Step 2. Find 10-year winners
Next we identified portfolio recipes at RecipeInvesting.com that have at least 10 years of history and sorted them by 10-year alpha. 114 different portfolio recipes have alpha greater than 0% over the past 10 years. This means that 114 portfolio recipes have outperformed SPY, on a risk-adjusted basis, over the past decade.
Step 3. Find winners for the other time periods
Then we applied the "alpha must be greater than 0%" filter to this list of 114 portfolio recipes, but for the other time periods. Here's how the list winnowed down:
- 88 portfolio recipes had positive alpha over both the past 7-year and 10-year periods.
- 72 portfolio recipes had positive alpha over the past 5, 7, and 10 years.
- 68 portfolio recipes had positive alpha over the past 3, 5, 7, and 10 years.
- 40 portfolio recipes had positive alpha over the past 1, 3, 5, 7, and 10 years.
Step 4. Apply a tighter filter of 2 percentage points of alpha or greater
Since a list of 40 portfolio recipes is still a bit lengthy, let's apply a tighter criterion: each portfolio recipe must beat SPY's alpha by at least 2 percentage points over each time period (1, 3, 5, 7, 10 years).
That brings the list down to 12 portfolio recipes, as follows
- 4 adaptive, tactical ETF portfolios: t.aaaf, t.aaab, t.aaac, t.aaaa
- 1 risk-driven, tactical ETF portfolio: t.cdar
- 1 multi-strategy income mutual fund: PONDX
- 4 tax-exempt income mutual funds: FLAAX, VWLTX, PRINX, FHIGX
- 2 income mutual funds focusing on preferred shares: PPSIX, NPSRX
Exhibit A (below) shows the cumulative return for the 12 selected portfolio recipes.
Exhibit A: Cumulative, 10-year Return for 12 Portfolio Recipes with Alpha Greater Than 2 Percentage Points
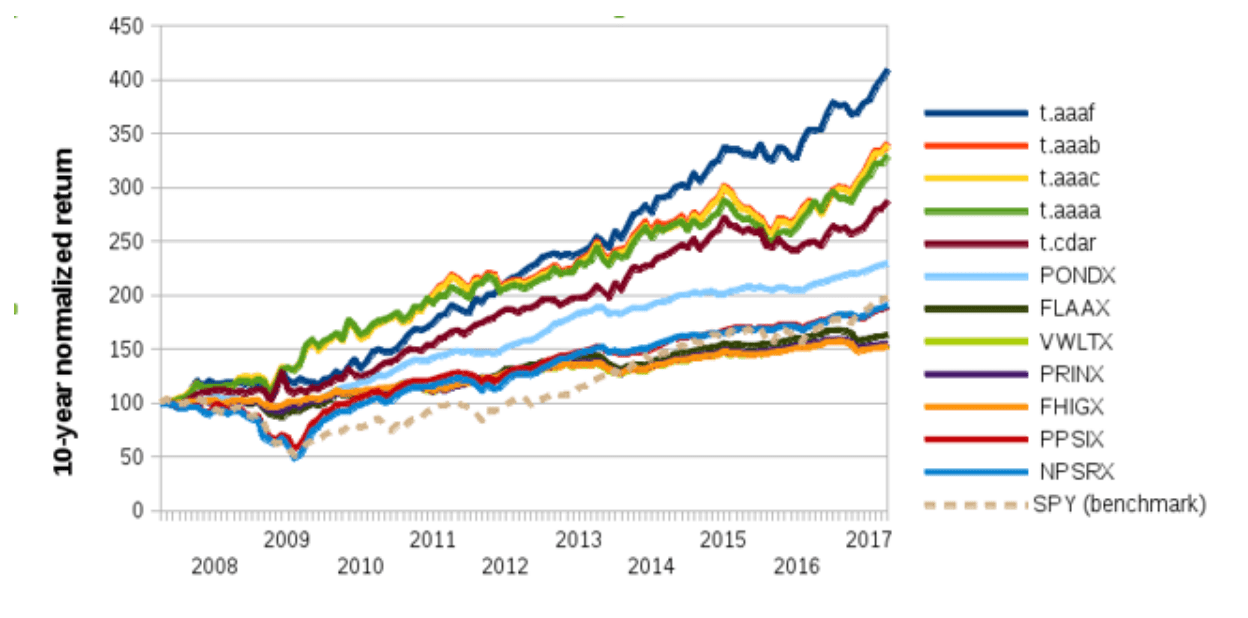
Exhibit B (below) shows three key statistics for the 12 portfolio recipes, including maximum drawdown.
Exhibit B: 12 portfolio recipes with alpha that beats the S&P 500 by 2 percentage points or more
| Portfolio Recipe ID or ticker | Description | Alpha % (10 years) | Annual return % (10 years) | Maximum Drawdown (10 years) |
| t.aaaf | Adaptive Allocation F | 12.3% | 15.1% | -13.4% |
| t.aaab | Adaptive Allocation B | 10.2% | 13.1% | -14.0% |
| t.aaac | Adaptive Allocation C | 10.1% | 13.0% | -14.2% |
| t.aaaa | Adaptive Allocation A | 9.8% | 12.7% | -13.8% |
| t.cdar | Minimum CdaR | 8.9% | 11.1% | -14.8% |
| PONDX | Pimco Income D | 7.0% | 8.7% | -10.7% |
| FLAAX | Nuveen Amer Muni | 4.0% | 5.0% | -14.8% |
| VWLTX | Vanguard LT Tax-Exempt | 3.7% | 4.4% | -7.2% |
| PRINX | T. Rowe Summit Muni | 3.7% | 4.5% | -8.9% |
| FHIGX | Fidelity Muni | 3.6% | 4.3% | -7.0% |
| PPSIX | Principal Preferred | 2.7% | 6.6% | -42.1% |
| NPSRX | Nuveen Preferred I | 2.1% | 6.7% | -50.6% |
| SPY | S&P 500 (benchmark) | 0% | 7.1% | -50.8% |
Step 5. Review the results.
Let's now take a closer look at the categories of portfolios that have been identified so that we can understand the investing themes that have emerged from the analysis. 12 portfolio recipes passed the test, and they fall into five distinct categories (a through e, below) that we can use for our analysis.
a. Adaptive asset allocation algorithm: ETF portfolios
These portfolios are tactical portfolios created from ETFs using variations of an Adaptive Asset Allocation algorithm. This approach has been described by a trio of financial advisers in Canada (Adam Butler, Michael Philbrick, and Rodrigo Gordillo). A Seeking Alpha article by Brenda Jubin describes their recent book on Adaptive Asset Allocation. The portfolio t.aaaf is one implementation of this approach which combines two different tactical approaches: minimize volatility (as measured by standard deviation) and also maximize total return. The adaptive asset allocation portfolios are rebalanced monthly.
b. Risk-driven algorithm: ETF portfolio
This portfolio (t.cdar) uses a strict, tactical algorithm to minimize the conditional drawdown at risk (CDaR) while also maximizing total return. While similar in some ways to the Adaptive Asset Allocation (above), this portfolio recipe uses a different risk measure for minimization. The core idea is finding a portfolio that simultaneously satisfies two objectives: a risk constraint using a particular risk function and also a return target that is subject to the risk constraint. If you're interested in finding additional applications of this approach, you can use different risk measures, return targets, and lookback periods to create a suite of investment algorithms.
c. Multi-strategy income: mutual funds
PONDX, managed by PIMCO, gives investors access to a multi-strategy, income portfolio that uses a variety of fixed income securities. Despite being focused on fixed income assets, PIMCO applies an active "go anywhere" approach with this fund. This flexibility may be useful in an environment of increasing interest rates and high volatility. The PONDX fund managers can "bob and weave" to avoid certain asset classes, unlike indexed funds.
d. Municipal bond income: mutual funds
These are mutual funds with a municipal bond focus. Although this asset class has performed well over the last decade, there could be present and future dangers that an investor needs to be aware of. This is explained in the Seeking Alpha article, "The Hidden Risk in the Muni Bond Market."
e. Preferred shares income funds: mutual funds
These mutual funds focus on preferred shares. Note the large drawdown for these two funds. The Nuveen Preferred fund has a drawdown nearly as large as SPY itself. Although these funds bounced back over time, a drawdown of that magnitude should cause an investor to proceed with extra caution.
Conclusion
We found portfolios recipes with five different investing themes that beat the market (based on alpha) over past 10 years. Analyzing these underlying themes gives us several ideas for possible investments. However, we should assess the go-forward viability of each of these themes based on the current market conditions.
as published on
Disclosure: I am/we are long EFA, IWM, GLD, TLT, QQQ, SPY, EEM. I wrote this article myself, and it expresses my own opinions. I am not receiving compensation for it. I have no business relationship with any company whose stock is mentioned in this article.