Article - 43 Tactical Portfolio Algorithms That Outperform The Top Macro Fund
43 Tactical Portfolio Algorithms That Outperform The Top Macro Fund
- A recent article extolling the benefits of go-anywhere, macros funds piqued our interest.
- We researched over 150 asset allocation strategies to find Portfolio Recipes using ETFs that would beat the leading macro mutual fund.
- We found 43 Portfolio Recipes that beat the top macro fund with both lower risk and higher return.
A recent article in Barron's, "The Case for Macro Funds" (published February 20, 2017, subscription required) got us thinking about "go anywhere" macro funds that allocate assets globally based on market conditions.
The Barron's article makes the case that owning macro funds could insulate your portfolio during the next bear market.
Macro fund managers use a top-down approach and look at broad macro-economic factors to make their investment choices. In contrast, other active managers may use a bottom-up approach and pick stocks by filtering and analyzing hundreds of opportunities to find the best buys.
The Barron's article mentions the following three funds:
- Eaton Vance Richard Bernstein All Asset Strategy Fund Class A (MUTF:EARAX)
- Dreyfus Global Real Return Fund Class A (MUTF:DRRAX)
- William Blair Macro Allocation Fund Class N (MUTF:WMCNX)
But how well have these funds actually performed?
When considering fund performance, we want to look at both total return and risk. But a problem is that all three of these funds have less than 10 years of history. In other words, none of these funds were around during the last major market downturn in 2008. So we can't see how they performed during that stressful market cycle.
The Macro Fund to Beat
So is there a macro fund that would be suitable? For our analysis, let's find a Global Macro fund that has at least 10 years of history. Morningstar does not have a specific category for Macro funds, but Thomson Reuters Lipper does have a category called "Alternative Global Macro Funds." This should work for our investigation.
The Lipper 2016 Trophy Winner for Alternative Global Macro Funds with 10 years of history was WYASX, Waddell & Reed Advisor Asset Strategy Fund Class Y.
The 2015 winner in this same Lipper category was UNASX, which is the "A" share class of this same fund, so we know Lipper definitely likes this fund.
So let's use WYASX as our "macro fund to beat." This fund holds a mix of U.S. and international stocks and bonds. According to the prospectus, this fund "may invest its assets in any market that the fund's investment manager believes can offer a high probability of return or, alternatively, can provide a high degree of relative safety in uncertain times." So this is a go-anywhere, actively managed fund.
Note that WYASX is sold only through advisors and it's not available for direct purchase by retail investors. But we can still use it as the one to beat, since we're using it as a benchmark and we're probably not planning on buying WYASX. We will look for tactical Portfolio Recipes that beat WYASX using a set of ETFs. The ETF portfolios that we're looking for will be 100% investable by individual investors.
The Performance of WYASX
Exhibit A (below) shows the 10-year performance of WYASX, SPY (as a proxy for the S&P 500 index), and VBIAX (Vanguard Balanced Index Fund)
Exhibit A: 10-year Performance of WYASX, SPY, and VBIAX (source: Morningstar)
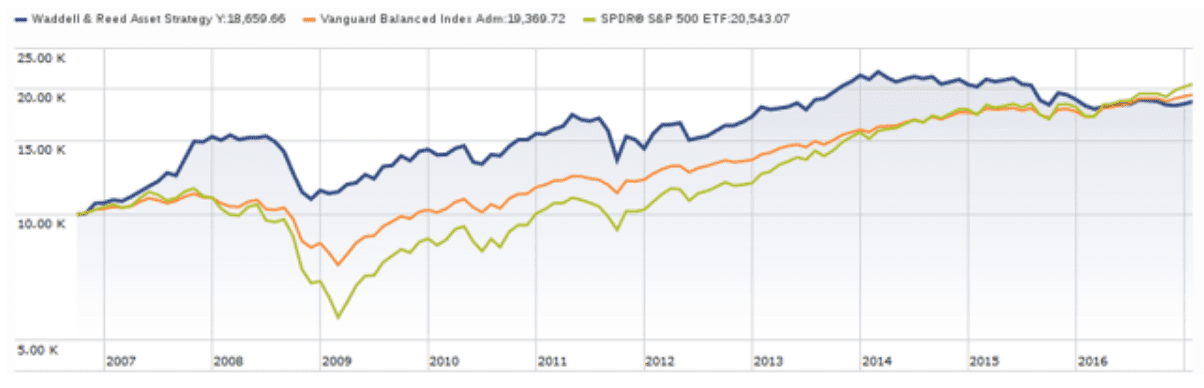
For the 10 years ending January 31, 2017, WYASX (the blue line in Exhibit A) generated a total annual return of 5.7%. This percentage return could be good or bad, depending on the level of risk. We need more context to examine the risk.
As a measure of risk, we like to use Maximum Drawdown, which is the peak-to-valley drop in value for the portfolio over a given period. We like to look at maximum drawdown over the past 10 years since that includes the last major market downturn. In our view, looking at Maximum Drawdown over only the past 5 or 7 years is not meaningful since it excludes 2008.
Looking at the past 10 years, WYASX has a maximum drawdown 29.8%.
For comparison, Exhibit B (below) shows the 10-year total return and maximum drawdown for WYASX, SPY (the S&P 500 ETF), and a Balanced Portfolio Recipe that is 60% stocks and 40% bonds (nicknamed s.6040).
Exhibit B: Risk and Return for WYASX vs. Benchmarks
| Portfolio description | 10-year total return | 10-year maximum drawdown |
| Waddell & Reed Advisor Asset Strategy Fund Class Y (MUTF:WYASX) | 5.7% | 29.8% |
| S&P 500 Index Fund (NYSEARCA:SPY) | 6.9% | 50.8% |
| s.6040: 60% Stocks (NYSEARCA:VTI), 40% Bonds (NYSEARCA:BND) | 6.4% | 32.2% |
We can see that WYASX underperforms both SPY and s.6040 in terms of total return, but WYASX has less drawdown. So with this small comparison set, WYASX loses in terms of return, but wins in terms of drawdown.
Hunting for a Portfolio Recipe Algorithm that beats WYASX
Now let's look at a larger set of investing algorithms, which we call "Portfolio Recipes." We can take WYASX's 10-year total return and its 10-year maximum drawdown, then look for Portfolio Recipes that beat WYASX in terms of both risk and return. In other words we want to find lower risk, higher return portfolios.
Exhibit C (below) plots the results for over 150 different Portfolio Recipes that we track at recipeinvesting.com. Each dot represents one Portfolio Recipe: the total return is plotted on the vertical axis and risk is plotted on the horizontal axis. WYASX is shown as an orange dot. The time period for the chart is 10 years ending January 31, 2017.
So any Portfolio Recipes above and to the left of the orange dot (in the green shaded region) will have both higher return and lower risk compared to WYASX.
Exhibit C: Risk vs. Return Scatterplot for 150 Portfolio Recipes (source: recipeinvesting.com)
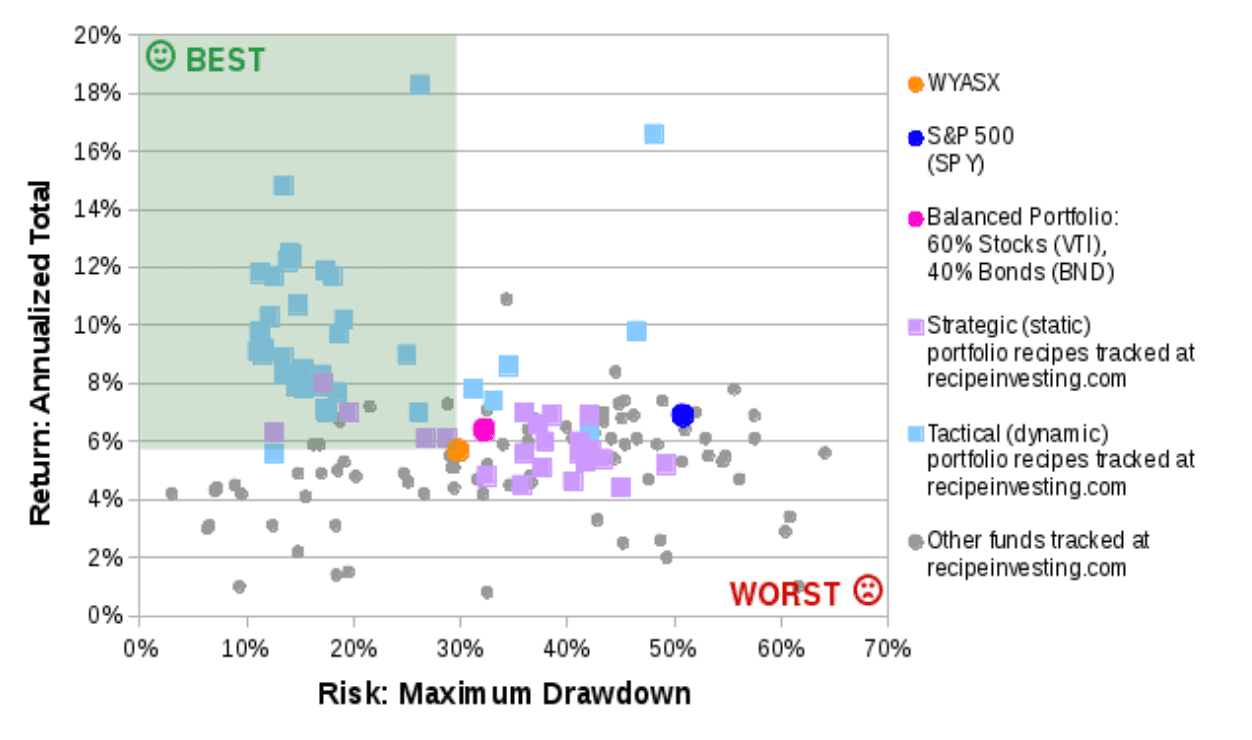
There are 43 Portfolio Recipes in the green shaded region. We can see that SPY (the dark blue dot) and the 60/40 portfolio (the bright pink dot) fall outside the green region.
The Winning Algorithms
Exhibit D (below) lists the Top 3 Portfolio Recipe algorithms, ranked by highest annual return. All of these beat WYASX in terms of both risk and return. These are tactical ETF portfolios that are updated monthly based on the underlying algorithm. These are the three Portfolio Recipes closest to the top of the green-shaded box shown in Exhibit C.
The current asset allocation for each Portfolio Recipe is also shown, but this can change from month-to-month since these are tactical portfolios that are rebalanced at the beginning of each month.
Exhibit D: Top 3 Portfolio Recipes (based on Total Return) that Beat WYASX, the Top Macro Fund
Pure Momentum Portfolio (ID = t.pure)
|
Adaptive Allocation Portfolio F (ID = t.aaaf)
|
Adaptive Allocation Portfolio B (ID = t.aaab)
|
For a slightly different take, let's look at the winning Portfolio Recipes with the lowest risk. These are shown as dots closest to the left edge of the green box in Exhibit C.
We can see in Exhibit E (below) the Top 3 Portfolio Recipe algorithms, ranked by lowest Maximum Drawdown. All of these beat WYASX in terms of both risk and return. These are tactical ETF portfolios that are updated monthly based on the underlying algorithm.
Exhibit E: Top 3 Portfolio Recipes (based on Risk ) that Beat WYASX, the Top Macro Fund
Minimum CVaR (Conditional Value at Risk) Portfolio (t.cvar)
|
Target 12% Return Portfolio using Standard Deviation (t.tret)
|
Minimum MAD (Mean Absolute Deviation) Portfolio (t.madm)
|
Conclusion
The actively managed "macro" fund WYASX has a compounded annual growth rate of 5.7% per year over the past 10 years, with a 29.8% drawdown. But we found 43 Portfolio Recipe algorithms using recipeinvesting.com that have outperformed this macro fund in terms of both lower risk and higher return.
Creating a tactical portfolio using ETFs can potentially offer some of the benefits of a macro-style fund. An ETF Portfolio Recipe can offer global, tactical asset allocation without the disadvantages shown by WYASX such as limited retail availability, higher cost, higher risk, and underperformance.
as published on
Disclosure: I am/we are long EFA, IWM, GLD, TLT, QQQ, SPY, EEM. I wrote this article myself, and it expresses my own opinions. I am not receiving compensation for it. I have no business relationship with any company whose stock is mentioned in this article.