Article - 43 Country ETFs Compared During The Recent Market Turbulence
43 Country ETFs Compared During The Recent Market Turbulence
Related to our ongoing comparison of asset allocation strategies, we regularly compare the risks and returns of the global asset classes underlying the allocations. With the recent turbulence in global equity markets, we analyzed the performance of 43 countries and regions.
Here are two questions we wanted to answer:
- What countries had the best and worst equity performance over the past month?
- How did these compare on a risk-adjusted basis over the recent 1-year and 7-year periods?
Our Approach
To answer these questions, we followed these steps:
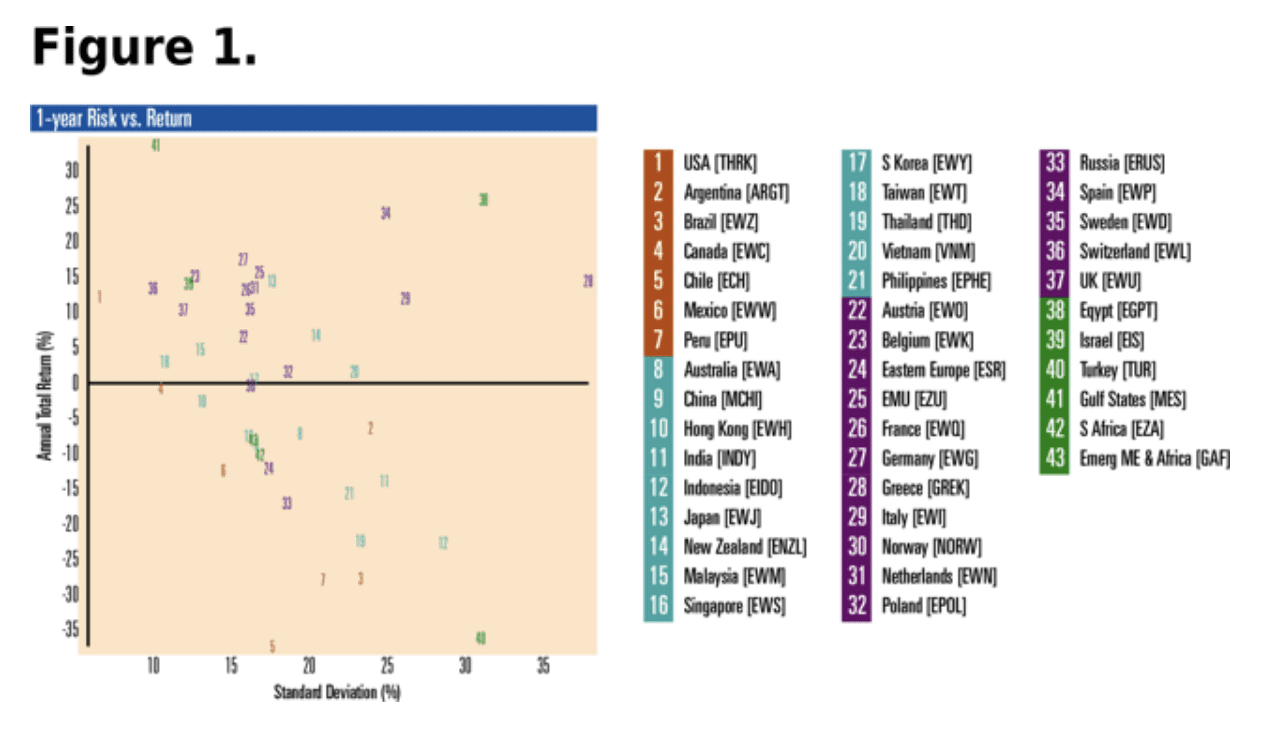
- Choose equity ETFs to serve as a proxy for each country. We created a list of 43 country ETFs. See Figure 1 (below) for a list of tickers. This list includes some regions with multiple countries such as Eastern Europe, Gulf States, Emerging Middle East & Africa. If we have omitted one of your favorites, please let us know in the comments below.
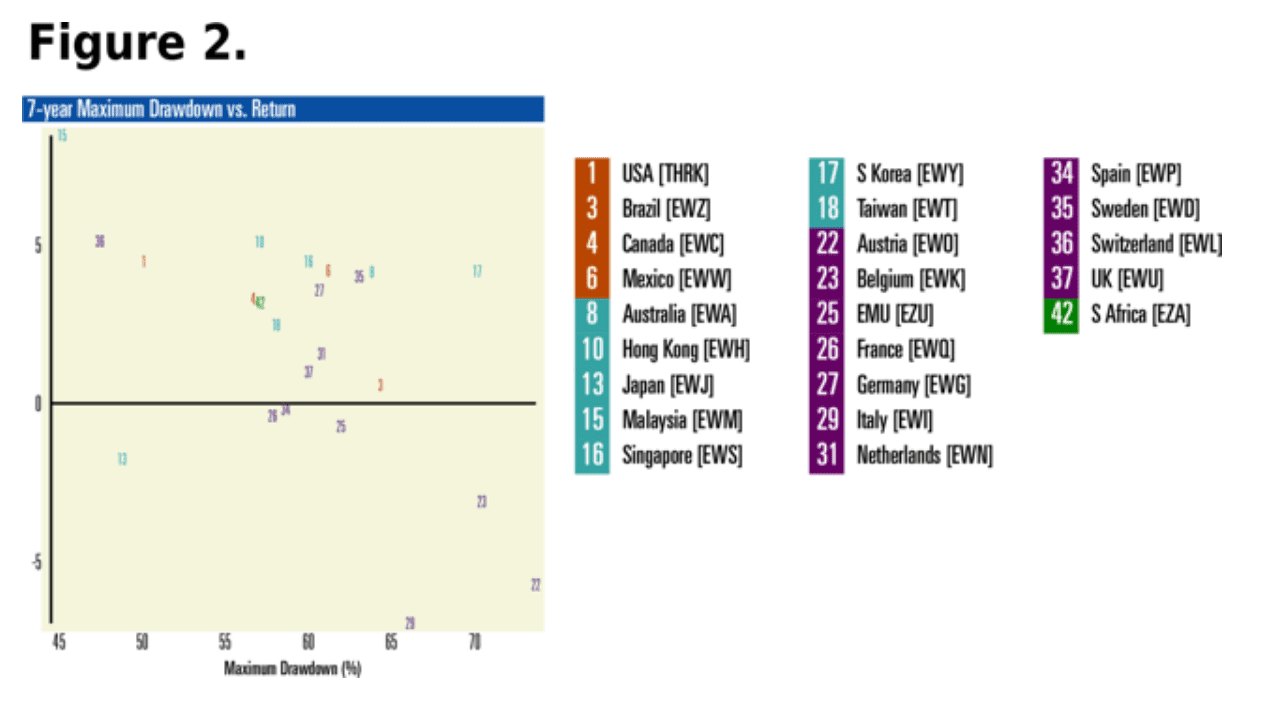
- Calculate risk and return metrics. We calculated the total return and standard deviation over the past 12 months. For a longer time horizon, we also calculated total return and maximum drawdown over the past 7 years.
- Create ranking and risk vs. return scatterplots. We ranked the countries based on total return in January 2014 and created a Top 5 and Bottom 5 list. We also created risk vs. return scatterplots for all ETFs.
Results
1-Month Results (Jan 2014)
Despite the negative news from global markets, some countries and regions actually managed to stay in the black during January.
Top 5 Countries for Jan 2014
- Egypt (NYSEARCA:EGPT), +15.2% return
- Vietnam (BATS:VNM), +12.1% return
- Gulf States (NYSEARCA:MES), +6.5% return
- Indonesia (NYSEARCA:EIDO), +1.6% return
- New Zealand (NASDAQ:ENZL), +0.9% return
Egypt has recently benefited from a more stable political environment. Vietnam enjoys annual GDP growth over 5% and is implementing market reforms. In the Gulf States, Qatar and UAE are now considered "emerging" markets instead of "frontier" so they can expect additional capital inflows.
Bottom 5 Countries for Jan 2014
- Chile (BATS:ECH), -14.5% return
- Turkey (NASDAQ:TUR), -12.8% return
- Brazil (NYSEARCA:EWZ), -12.2% return
- Argentina (NYSEARCA:ARGT), -11.1% return
- Russia (NYSEARCA:ERUS), -11.0% return
From these laggards, we can see the effects of currency devaluation in Argentina, which also drags down neighbors Brazil and Chile. Turkey suffers from political unrest and corruption. Russian economic growth slowed to 1.5% last year as the benefits from privatization wane, while bureaucracy increases.
1-Year Results (Feb 2013 to Jan 2014)
Looking at risk vs. return for the past 12 months (Figure 1, below), we see that the Gulf States ETF (MES, indicated as #41) has performed well not just in January, but also during the past 12 months. This fund appears in the top left corner of Figure 1 and is the clear winner on a risk-adjusted basis. Western European countries (shown as purple numbers on Figure 1) had positive returns, but Eastern Europe (#24) and Russia (#33) lagged.

Source: VizMetrics Report #vm45
For a higher-level view of 31 global equity asset classes including emerging markets (NYSEARCA:EEM), developed markets (NYSEARCA:EFA), and frontier markets (NYSEARCA:FRN), see VizMetrics Report #vm23. This also compares global asset classes across other factors such as size and growth/value.
7-Year Results (Feb 2008 to Jan 2014)
Figure 2 (below) plots risk vs. return for the countries over a longer period that includes the 2008-2009 market drop. The risk measure for this chart is maximum drawdown. The top performers are Malaysia (indicated by #15), Switzerland (#36), and the U.S. (#1). The universe of ETFs is smaller for this 7-year period, since several funds are too new to be included.

Source: VizMetrics Report #vm45
Conclusion
Even at its best, single-country equity investing is risky. The maximum drawdown for these ETFs ranges from 45% to 75% during the last 7 years. The U.S., Switzerland, and Malaysia have demonstrated less risk over this period. Over the shorter term, structural differences and political factors result in a wide range of equity market returns between countries. This leaves room for the tactical asset allocator to find opportunities.
as published on
Disclosure: I am/we are long EFA, IWM, GLD, TLT, QQQ, SPY, EEM. I wrote this article myself, and it expresses my own opinions. I am not receiving compensation for it. I have no business relationship with any company whose stock is mentioned in this article.
