Article - 4 Portfolio Recipes That Consistently Beat The 'Lazy Portfolios'
4 Portfolio Recipes That Consistently Beat The 'Lazy Portfolios'
- We analyzed several Lazy Portfolios (e.g., static asset allocation portfolios) by running a full set of risk and return metrics.
- We compared these Lazy Portfolios to over 250 other asset allocation portfolio recipes, both tactical (with dynamic reallocation) and strategic (with a fixed allocation).
- Four portfolio recipes emerged as winners that consistently beat the Lazy Portfolios. These winners have lower risk and higher return over both the 1-year and 10-year time periods.
We recently received a question about the performance of the 8 "Lazy Portfolios" tracked by investment columnist Paul B. Farrell. The term "Lazy Portfolio" refers to a fixed asset allocation that is periodically rebalanced. We like to call this a "strategic portfolio recipe," but a fixed asset allocation like this can also go by several other names, such as buy-and-hold portfolio, static portfolio, or passive allocation. A strategic portfolio with a fixed allocation can be contrasted with a tactical/dynamic portfolio that changes its allocation over time.
Each of the Lazy Portfolios has a backstory or underlying theme, such as modeling the Yale endowment's asset allocation or copying Ted Aronson's family portfolio. This article will focus on the overall performance of the 8 portfolios, not their origin stories.
Since VizMetrics already tracks over 250 portfolio recipes, we decided to add these 8 Lazy Portfolio recipes to the list of portfolios that we analyze monthly. We were eager to see how these compared to our entire set of strategic and tactical portfolio recipes.
The Analysis Process
We followed four steps to analyze the risk and return of the Lazy Portfolios and then search for portfolios that outperform the 8 Lazy Portfolios.
- Create the Lazy Portfolios. We used the exact Vanguard mutual funds and allocations specified for each Lazy Portfolio, and then we backtested their performance using monthly total returns and monthly rebalancing. Our data covered the 10 years ending September 30, 2015.
- Run the analysis. Then we compared risk and return over the past 1 year and over the past 10 years. We like using the 1-year period since we've seen some market turbulence recently, and we like looking at the last 10 years since that period includes the downturn of 2008-2009. If you look at risk vs. return for only a short, upward period, then you can overlook the true risk of the portfolio since the evaluation period doesn't include much downside variation.
- Create scatterplots. We plotted risk vs. return for the Lazy Portfolios and all the other portfolios that we track.
- Filter the results. We found portfolios that beat the Lazy Portfolios, based on both risk and return.
- Identify the winners. We identified 4 portfolios that beat every Lazy Portfolio over both the 1-year and 10-year periods. The winners included two mutual funds, and two tactical portfolio recipes.
Step 1: Create the Lazy Portfolios
We created the Lazy Portfolios using Vanguard mutual funds, matching Farrell's allocations. ETFs could be used instead of mutual funds, but we wanted to remain true to the original portfolio recipes.
The Lazy Portfolios are constructed as follows:
| Lazy Portfolio Name | Lazy Portfolio Recipe (ingredients and percentages) |
| Lazy Portfolio: Aronson Family Taxable | VEURX=5%, VIPSX=15%, VPACX=15%, VWEHX=5%, VISGX=5%, VISVX=5%, VTSMX=5%, VEIEX=10%, VEXMX=10%, VUSTX=10%, VFINX=15% |
| Lazy Portfolio: Fundadvice Ultimate Buy & Hold | VFINX=6%, VFISX=12%, VFITX=20%, VEIEX=6%, VGSIX=6%, NAESX=6%, VISVX=6%, VIVAX=6%, VIPSX=8%, VTMGX=12%, VTRIX=12% |
| Lazy Portfolio: Coffeehouse | VFINX=10%, VGSIX=10%, NAESX=10%, VISVX=10%, VIVAX=10%, VGTSX=10%, VBMFX=40% |
| Lazy Portfolio: Margaritaville | VIPSX=33%, VGTSX=33%, VTSMX=34% |
| Lazy Portfolio: Dr. Bernstein's No Brainer | VFINX=25%, VEURX=25%, NAESX=25%, VBMFX=25% |
| Lazy Portfolio: Second Grader's Starter | VBMFX=10%, VGTSX=30%, VTSMX=60% |
| Lazy Portfolio: Dr. Bernstein's Smart Money | VEIEX=5%, VEURX=5%, VPACX=5%, VGSIX=5%, NAESX=5%, VISVX=10%, VIVAX=10%, VTSMX=15%, VFSTX=40% |
| Lazy Portfolio: Yale U's Unconventional | VEIEX=5%, VTMGX=15%, VIPSX=15%, VUSTX=15%, VGSIX=20%, VTSMX=30% |
Step 2: Run the analysis
Next we calculated the risk and return metrics for each of the 8 Lazy Portfolios. For the risk measure, we used Maximum Drawdown, which is the maximum percentage that each portfolio lost in value during the period, as measured at the end of each month. We like Maximum Drawdown for measuring risk since it captures quantitatively the "ouch!" that we feel when our portfolio hits the bottom. For the return measure, we used total annual return, which assumes that distributions are reinvested during the period.
The Lazy Portfolios showed the following risk and return characteristics, for the period ending September 30, 2015:
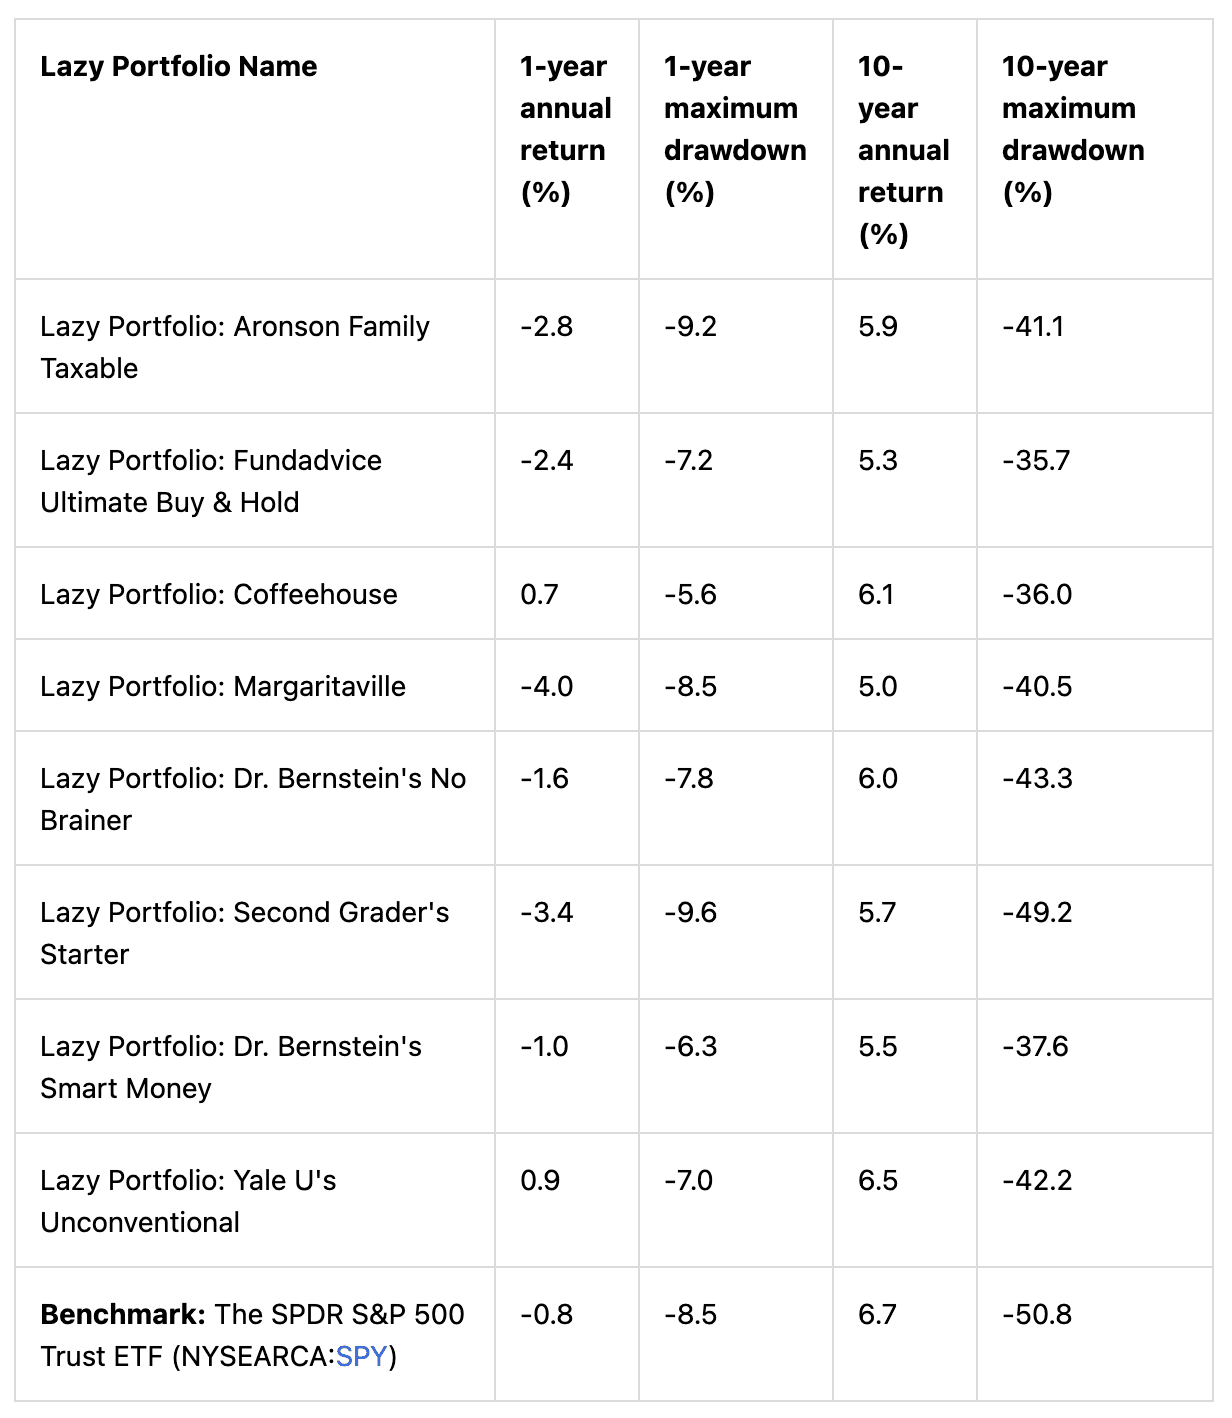
| Lazy Portfolio Name | 1-year annual return (%) | 1-year maximum drawdown (%) | 10-year annual return (%) | 10-year maximum drawdown (%) |
| Lazy Portfolio: Aronson Family Taxable | -2.8 | -9.2 | 5.9 | -41.1 |
| Lazy Portfolio: Fundadvice Ultimate Buy & Hold | -2.4 | -7.2 | 5.3 | -35.7 |
| Lazy Portfolio: Coffeehouse | 0.7 | -5.6 | 6.1 | -36.0 |
| Lazy Portfolio: Margaritaville | -4.0 | -8.5 | 5.0 | -40.5 |
| Lazy Portfolio: Dr. Bernstein's No Brainer | -1.6 | -7.8 | 6.0 | -43.3 |
| Lazy Portfolio: Second Grader's Starter | -3.4 | -9.6 | 5.7 | -49.2 |
| Lazy Portfolio: Dr. Bernstein's Smart Money | -1.0 | -6.3 | 5.5 | -37.6 |
| Lazy Portfolio: Yale U's Unconventional | 0.9 | -7.0 | 6.5 | -42.2 |
| Benchmark: The SPDR S&P 500 Trust ETF (SPY) | -0.8 | -8.5 | 6.7 | -50.8 |
Note that all the Lazy Portfolios had a maximum drawdown exceeding -35% over the past 10 years, with most worse than -40%. By comparison, the SPDR S&P 500 Trust ETF had a maximum drawdown of -50.8% with a 10-year return of 6.7%.
Step 3: Create the scatterplots
Now let's separate the wheat from the chaff using a risk vs. return scatterplot. We plotted the performance of all the Lazy Portfolios along with all the other portfolio recipes in one view. This allows us to visualize two important metrics (risk and return) at the same time.
With risk and return shown on the scatterplots below, the best portfolios (with the highest return and lowest risk) appear at the top left. In the plots below, the orange diamonds are the Lazy Portfolios. The blue squares are the portfolio recipes that showed both higher return and lower risk compared to the Lazy Portfolios. The yellow triangles are the additional portfolio recipes tracked by VizMetrics. For a benchmark comparison, we've also added SPY, shown as the purple circle.
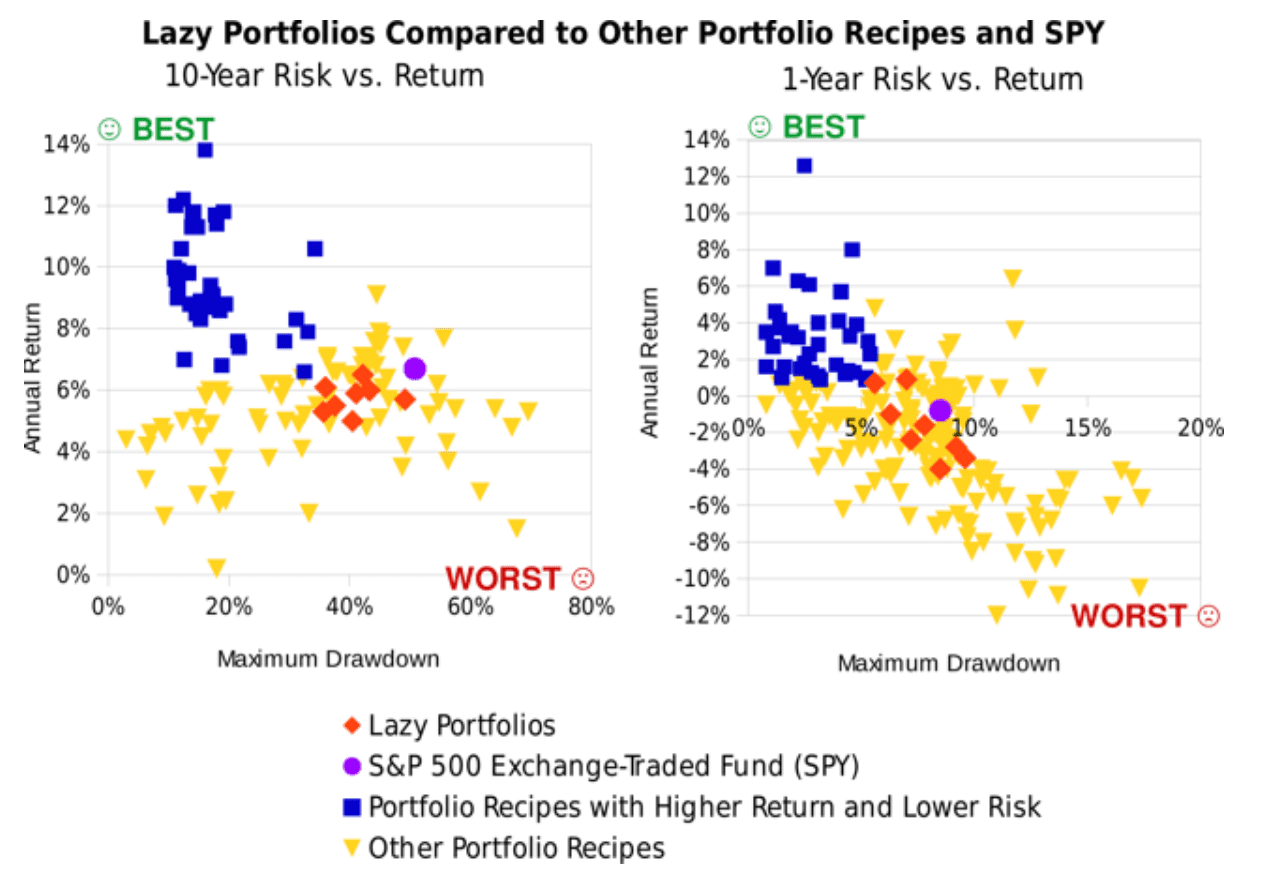
The 10-year scatterplot covers the period October 2004 to September 2015. The 1-year scatterplot covers the period October 2014 to September 2015.
Step 4: Filter the results
You can see that several blue squares are "northwest" (above and to the left) of all the orange Lazy Portfolios. Each blue square represents a portfolio with higher return and lower risk than every one of the Lazy Portfolios. In the 1-year scatterplot, there are 36 blue squares that beat all the Lazy Portfolios. In the 10-year scatterplot, there are 38 blue squares that beat all the Lazy Portfolios.
Over the past 10 years, the broad U.S. equity market (represented by an exchange-traded fund, SPY) has generated a higher return than each of the Lazy Portfolios. But this higher return is accompanied by higher volatility. The Lazy Portfolios each have some fixed income exposure and this offers a lower-risk alternative to SPY that some investors may prefer.
If we consider both the 1-year and 10-year time period, we find that the following four portfolios beat every Lazy Portfolio based on risk and return:
| The Four Winners (that outperform all of the Lazy Portfolios) | 1-year annual return (%) | 1-year maximum drawdown (%) | 10-year annual return (%) | 10-year maximum drawdown (%) |
| Vanguard Wellesley (VWINX) | 0.9 | -3.2 | 6.8 | -18.8 |
| Vanguard Balanced (VBIAX) | 1.0 | -5.2 | 6.6 | -32.5 |
| Minimum Conditional Value-at-Risk Portfolio (t.cvar) | 4.1 | -4.0 | 10.0 | -11.0 |
| Minimum Drawdown Portfolio (t.loss) | 8.0 | -4.6 | 9.8 | -13.4 |
| Benchmark: S&P 500 ETF | -0.8 | -8.5 | 6.7 | -50.8 |
Another portfolio, the "Strategic 60-40 Portfolio" (s.6040) nearly beats all of the Lazy Portfolios, too. This portfolio beats 7 of the 8 Lazy Portfolios (all except "Yale U's Unconventional") over the 1-year and 10 year periods. The Strategic 60-40 Portfolio returned 6.4% over 10 years, and "Yale U's Unconventional" returned 6.5%.
Conclusions
The 8 Lazy Portfolios do provide some diversification and have shown middle-of-the-pack performance. But there are better choices for investors.
If you want a lazy, easy-to-maintain portfolio then either of the Vanguard funds, VWINX or VBIAX, are a better choice. These funds are even lazier than the 8 Lazy Portfolios, since you don't have to buy and rebalance the ingredients yourself. Importantly, these Vanguard funds also provide better performance with lower risk. That's a true "no brainer."
Or if you seek higher returns, and if you're willing to rebalance monthly, you can look at tactical portfolio recipes, such as t.cvar and t.loss.
To view the full set of risk and return scatterplots for over 250 portfolio recipes, sign up for a free trial of the VizMetrics Investor subscription. This also includes risk and return analytics for the 1-, 3-, 5-, 7-, and 10-year periods.
as published on
Disclosure: I am/we are long EFA, IWM, GLD, TLT, QQQ, SPY, EEM. I wrote this article myself, and it expresses my own opinions. I am not receiving compensation for it. I have no business relationship with any company whose stock is mentioned in this article.