Article-2024-03
March 2024 Recipe Investing - Commentary
Topics this month
- Identifying High-Performing ETFs Over 1 and 20 Years
- Assessing a Potentially Unstable Mutual Fund: Absolute Strategies I (ASFIX)
- Investigating the Outsized Returns for the Quartile Sector Rotation Portfolio Recipe
- Faber Relative Strength Top 2: A tactical Portfolio Recipe with SPY-like return
Welcome to the March 2024 commentary from recipeinvesting.com. We track investable portfolio recipes that allow investors and advisors to build portfolios that minimize risk and maximize return. We reallocate and rebalance monthly, so we have plenty of new material to cover for our comparisons this month.
It's important to note the presence of both recipes and what we call portfolio ingredients on this platform. Portfolio ingredients are essentially the underlying exchange-traded funds that make up the collection of events referred to as recipes. When visiting the portfolio recipes page, investors will find a list of various metrics that have been recently updated within the past month or two. This allows for easy viewing and comparison of the key ingredients or exchange-traded funds across different groups and categories. If investors wish to delve deeper into the comparison based on metrics such as M-squared, Sharpe, Sortino, or Standard Deviation, they can select these options from the page, which will then direct them to a detailed analysis page.
Identifying High-Performing ETFs Over 1 and 20 Years
We also have the ingredient summary page that displays the total return across various periods, spanning from one month to 20 years. Now, let's dive in and examine recent developments in the ingredient space. Here, we're referring to the fundamental underlying asset classes. By doing so, we can filter by one year and observe the recent trends.
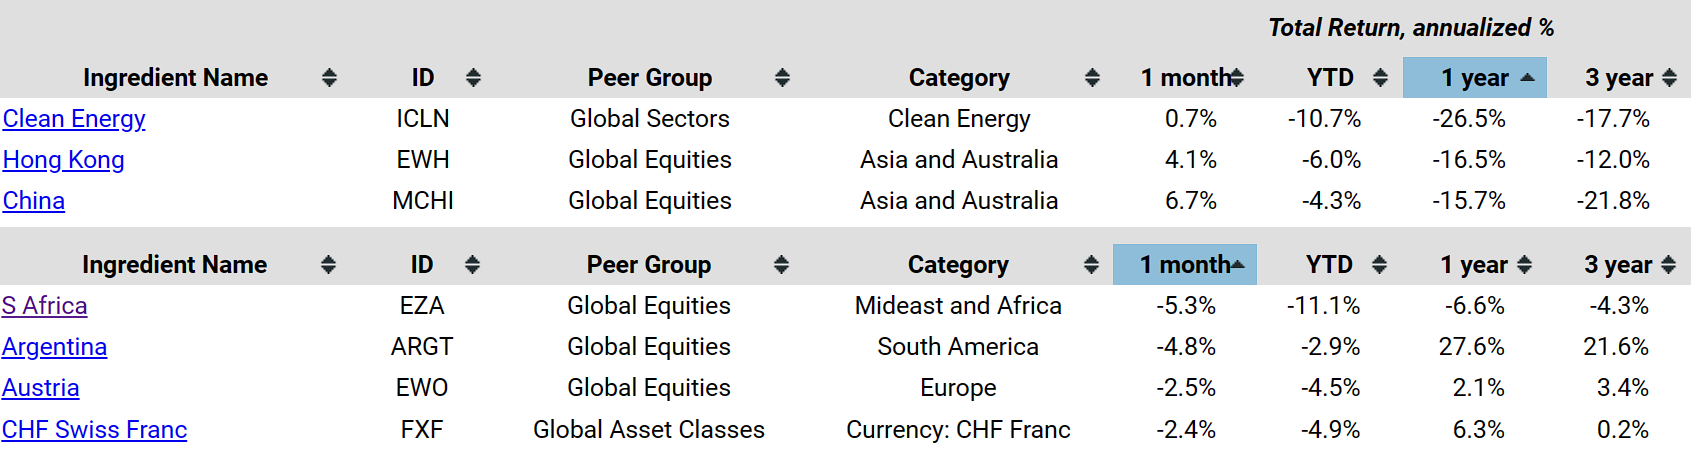
If we take a look at the downside, we can observe that Clean Energy (ICLN), Hong Kong (EWH), China (MCHI), and several others have experienced significant declines over the past year. Additionally, when examining the one-month period, we notice that certain country funds, including the CHF Swiss Franc (FXF), haven't performed particularly well either.
Now, shifting our focus to the positive side over the past year, we notice some country funds along with PowerShares QQQ (QQQ), a technology-focused exchange-traded fund, have performed exceptionally well, yielding returns exceeding 50% over the last 12 months. This presents an intriguing array of exchange-traded funds that have outperformed the S&P 500, which we've included here as a useful benchmark.
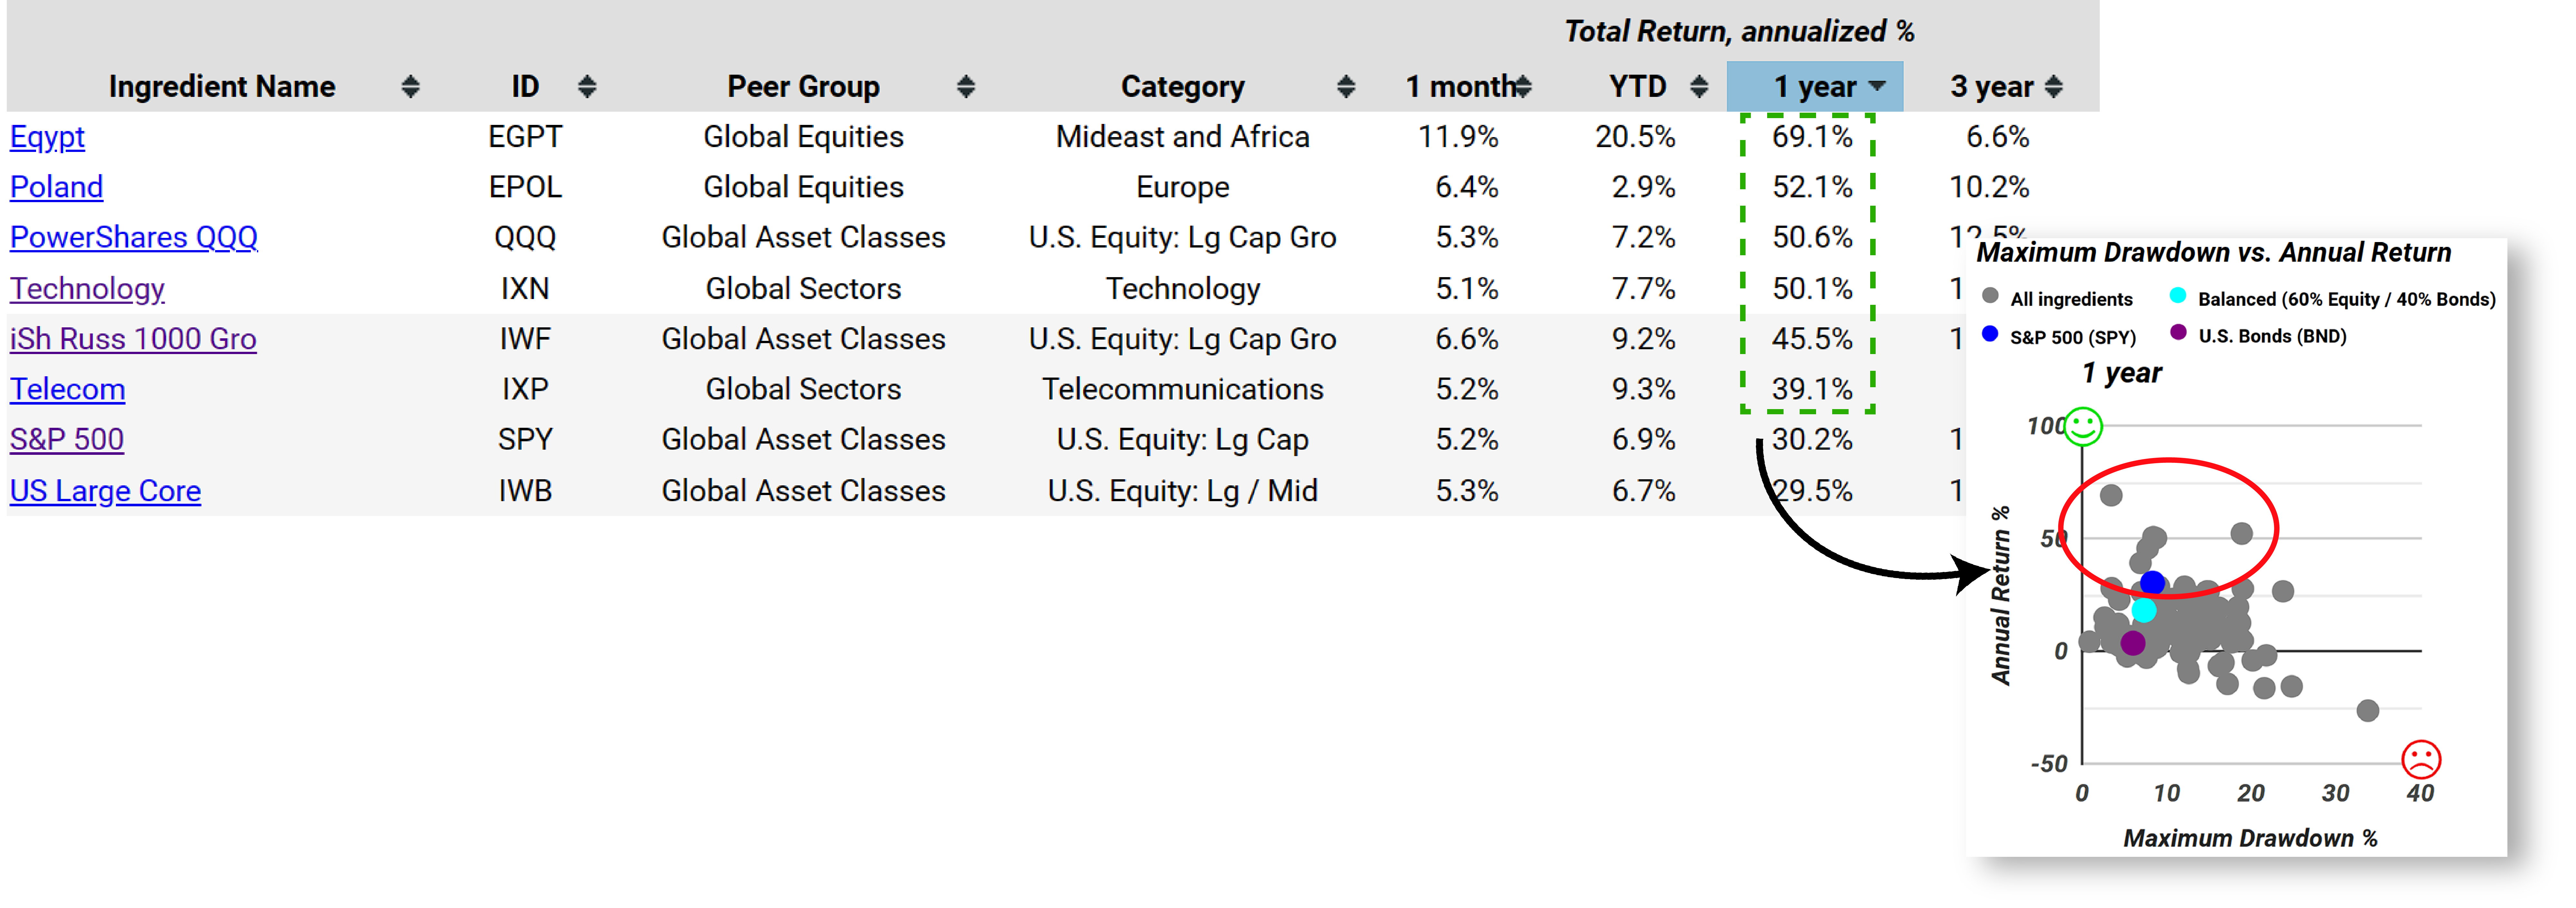
Drawing a comparison, only six of these have outperformed the S&P 500 in terms of return over the past year. It's worth noting that the S&P 500 has been performing exceptionally well lately. Investors can easily identify these six by referring to the list provided. Alternatively, investors can visually identify them on the scatterplots. The dots representing these six funds will appear above the blue dot, which represents the S&P 500, on the scatterplot. When we examine the 20-year data and sort it in descending order, we notice several exchange-traded funds that have performed admirably over the last two decades. Once more, a common theme emerges, with a focus on technology. Notably, the PowerShares QQQ and the iShares Russell 1000 Growth ETF (IWF) stand out. Once again, we have a limited set of six exchange-traded funds that have outperformed Spy over the past 20 years.
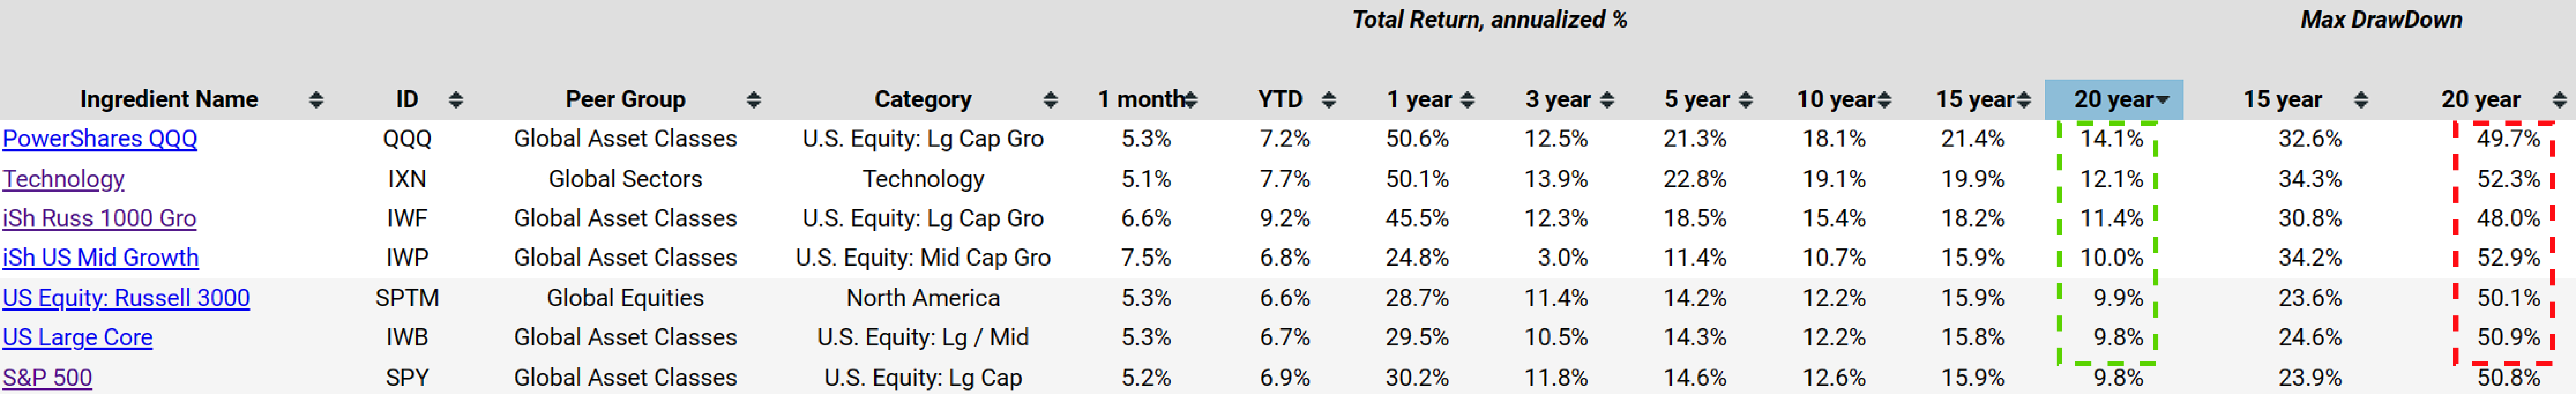
It's crucial to note that all these options come with significant risk. Considering the maximum drawdown, while not the sole measure of risk, provides a quick reference point. During the 2008 financial crisis, which falls within this 20-year period we've analyzed, all of these options experienced drawdowns in the range of 50%. This underscores the importance of diversification. Despite the potential for attractive returns from individual ingredients or asset class exchange-traded funds, diversification remains a valuable strategy to mitigate risk.
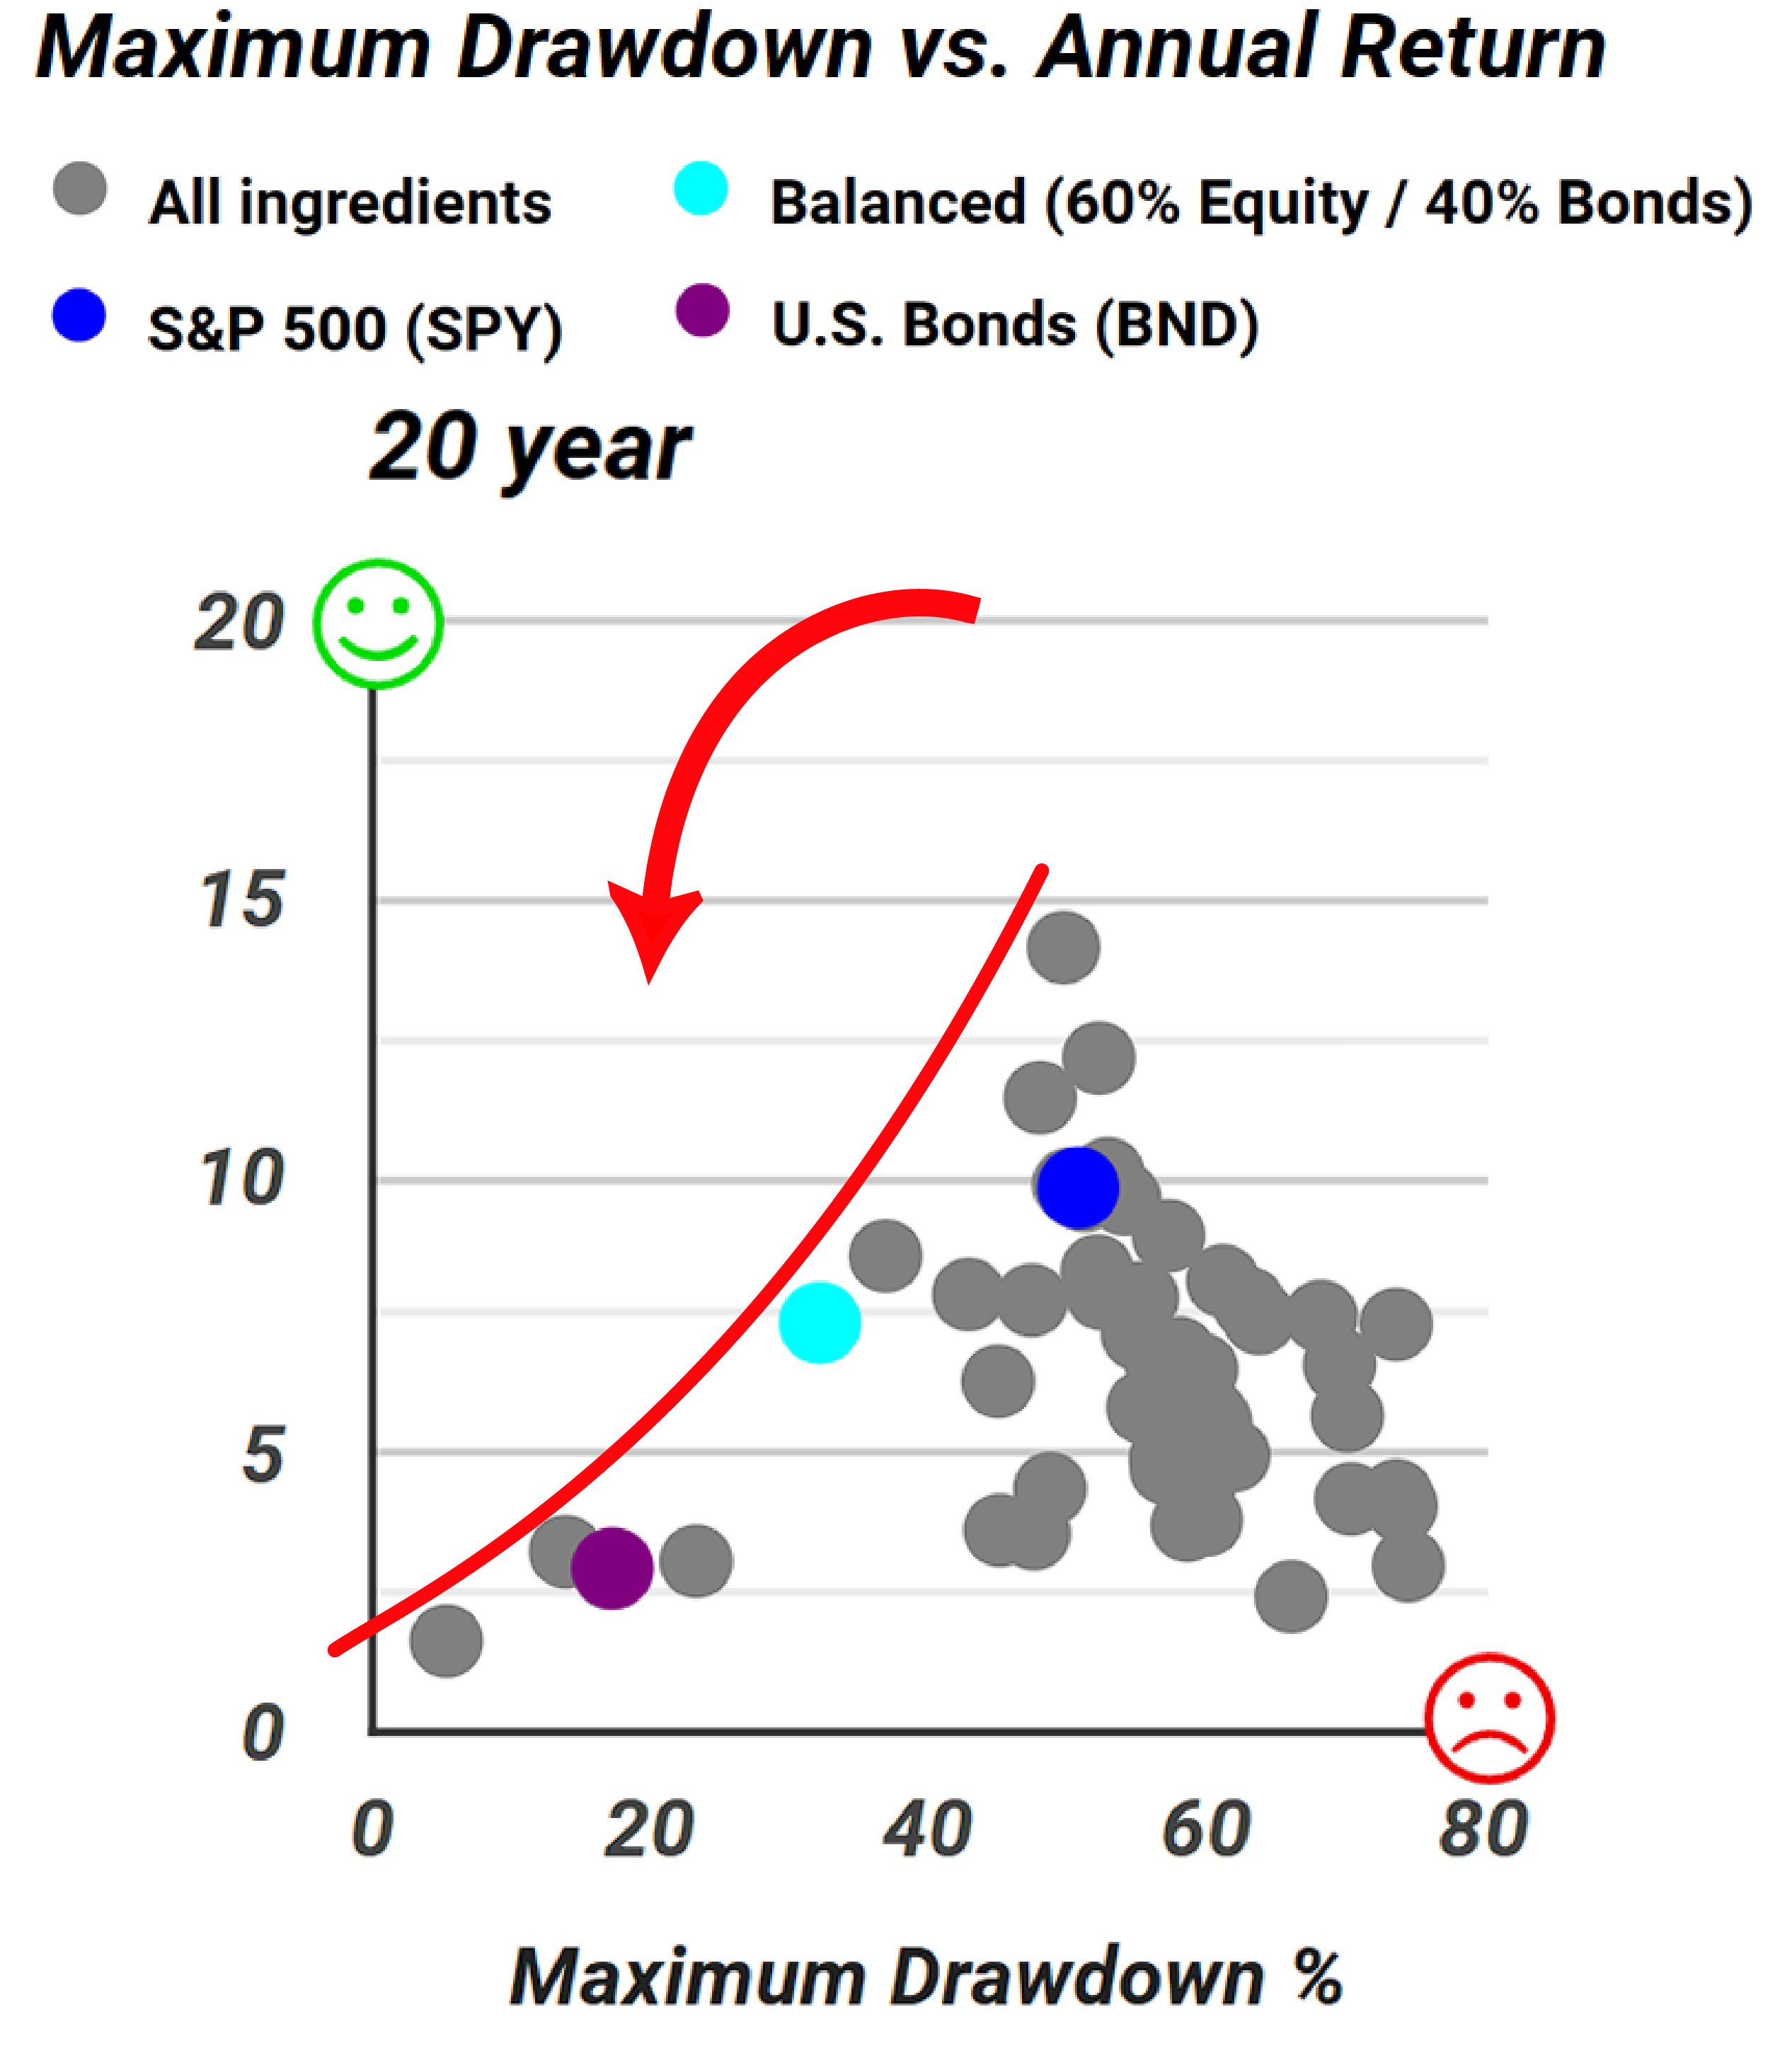
When aiming for high returns with low risk, we encounter a strict 20-year frontier. Unsurprisingly, it follows the principle that higher returns come with higher risks. However, as we shift our focus to recipes, which are algorithmic combinations of these traded funds, we observe a slight shift. By combining some of these funds into model portfolios or allocations, known as portfolio recipes, we can position ourselves closer to the top left area, which is favorable. This allows us to achieve a balance between returns and risk, moving beyond individual funds to create more efficient portfolios.
Now, let's switch to the recipe summary page, where instead of the underlying ingredient exchange-traded funds, we'll encounter a different set of portfolios listed in the peer group and category columns. Each of these portfolios will have an ID, either the ticker if it's an exchange-traded fund or a mutual fund, or internally, we use "T." to refer to tactical portfolios or recipes. Additionally, "S." stands for static or strategic, indicating that the allocations of these portfolios won't change, although we do track their performance month to month. On the other hand, tactical portfolios denoted by "T." typically have allocations that change every month. This flexibility allows us to adjust positions as needed, potentially resulting in improved performance in many cases.
Assessing a Potentially Unstable Mutual Fund
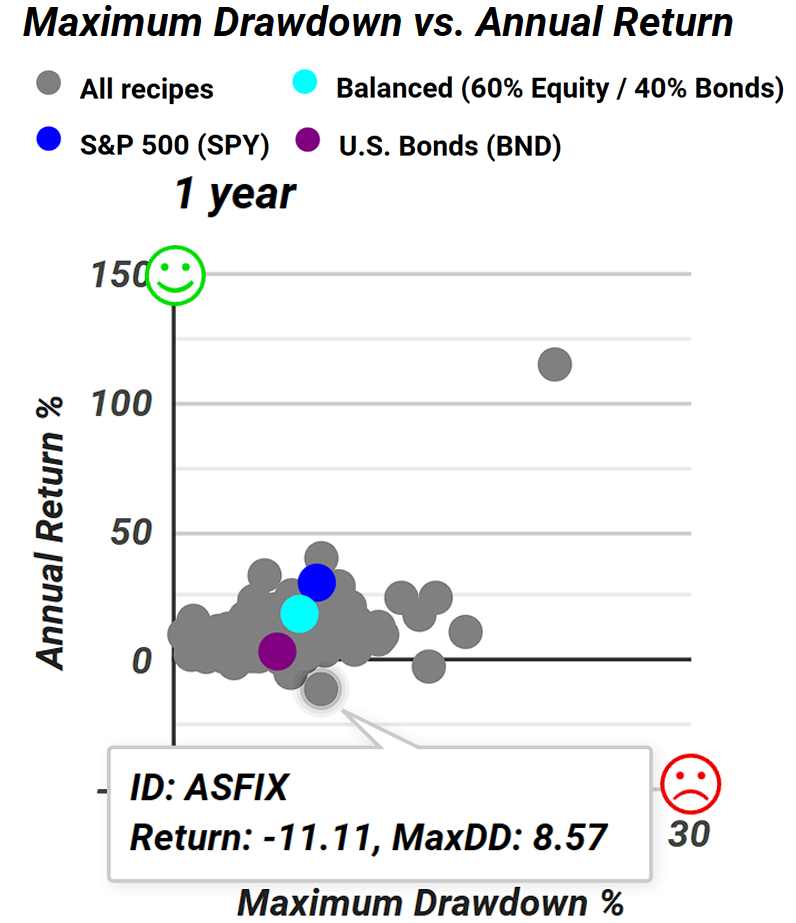
Let's take a look at the one-year scatterplot. At the bottom end, we have Absolute Strategies I (ASFIX). Sorting by one year, in ascending order, reveals the worst-performing portfolio over the past year. While some other recipes have demonstrated exceptional performance, ASFIX has actually experienced a decline of 11.1% over the past year. Upon closer examination, Morningstar echoes the poor performance by awarding it a one-star rating. Additionally, the fund carries a remarkably high expense ratio of 2.25%, which is staggering. It's worth noting that this fund is tailored for institutional investors with a minimum investment of $25,000, yet it only manages less than $20 Million in assets. Given these circumstances, it's doubtful that this fund will endure in the long run, especially considering its downward trajectory over the past few years.
Investigating the Outsized Returns for the Quartile Sector Rotation
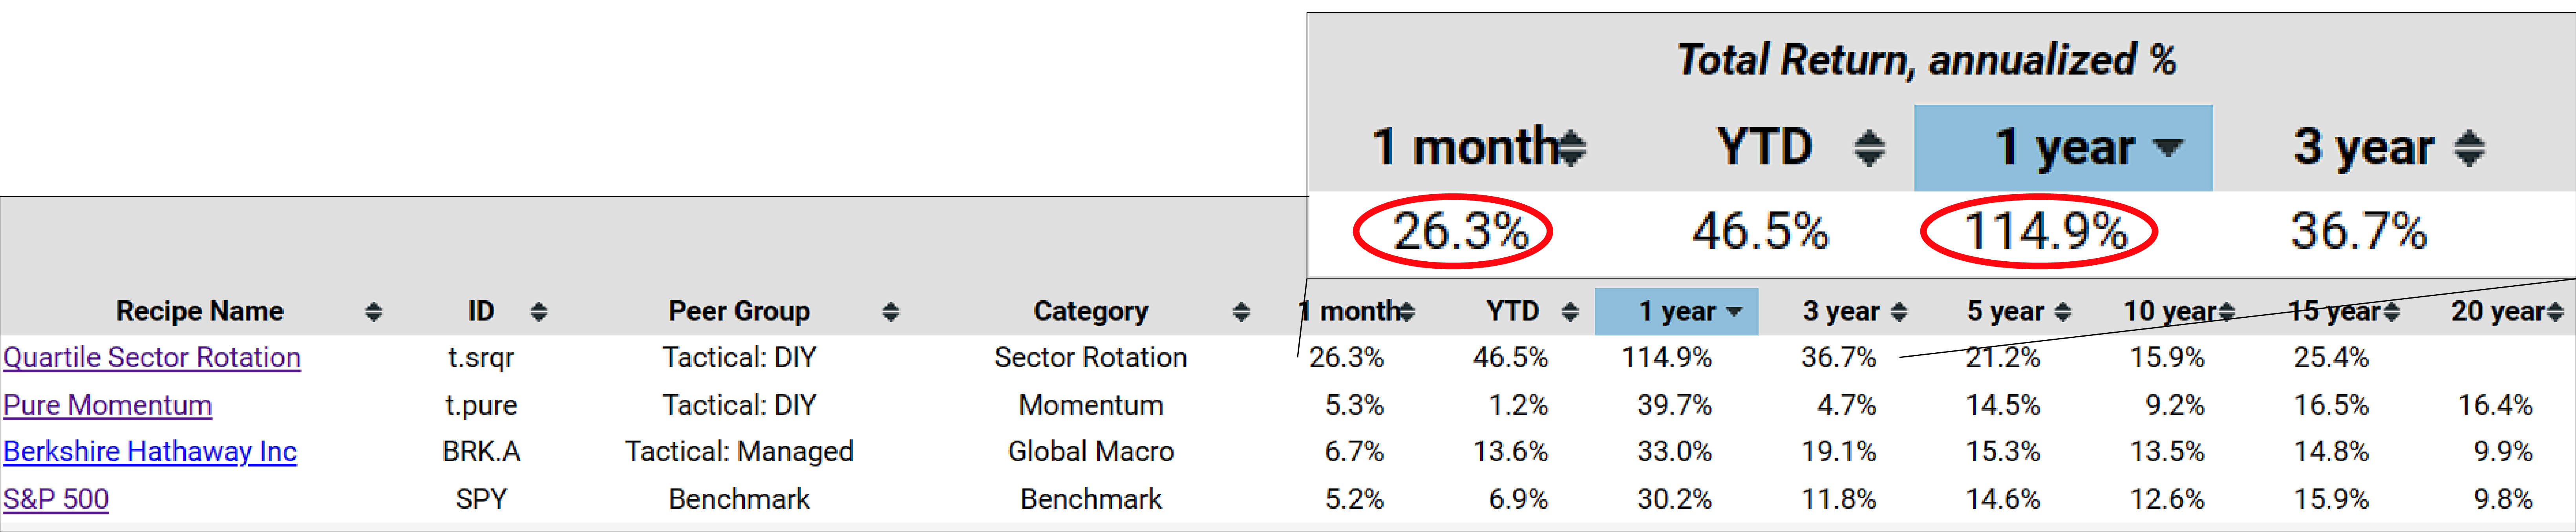
Now, shifting our focus to the positive side, let's return to the recipe summary page and sort these portfolios in descending order, highlighting the best one-year performers. Topping the list is Quartile Sector Rotation (t.srqr) with an impressive return of 114% over the past year. Moreover, in the last month alone, it's up by 26.3%. Let's take a moment to recall what's involved in this Quartile Sector Rotation recipe.
Here's how it operates: we start with a collection of over 100 sector funds, mainly mutual funds, which can add complexity to trading but offer a wider range of options. The algorithm or model ranks these funds based on a momentum score, a blend of scores from various recent time periods. It then selects the top-performing fund for investment. However, it doesn't stop there. The selected fund will only be replaced if it falls out of the top quartile in the rankings. This approach aims to reduce volatility and prevent unnecessary churn. Instead of simply switching to the top-ranked fund each month, the algorithm waits until the current selection falls out of the top quartile before making a change. This means waiting for roughly one-fourth of the ranking positions to move before considering a replacement. Notably, the algorithm focuses on selecting just one fund, resulting in a highly concentrated portfolio. Furthermore, some of the funds in the selection of 117 sector funds are allowed to leverage, potentially enhancing returns. For the period of March 2024, the selected fund is SMPIX, which has been allocated to this strategy for the past few months, explaining its exceptional performance.
Let's delve into SMPIX. It stands for ProFunds Semiconductor UltraSector Inv. Despite its relatively high expense ratio of 1.56%, which is reasonable considering its strategy, this fund utilizes leverage to amplify its returns, aiming for results approximately 1.5 times greater than those of the US semiconductor index.
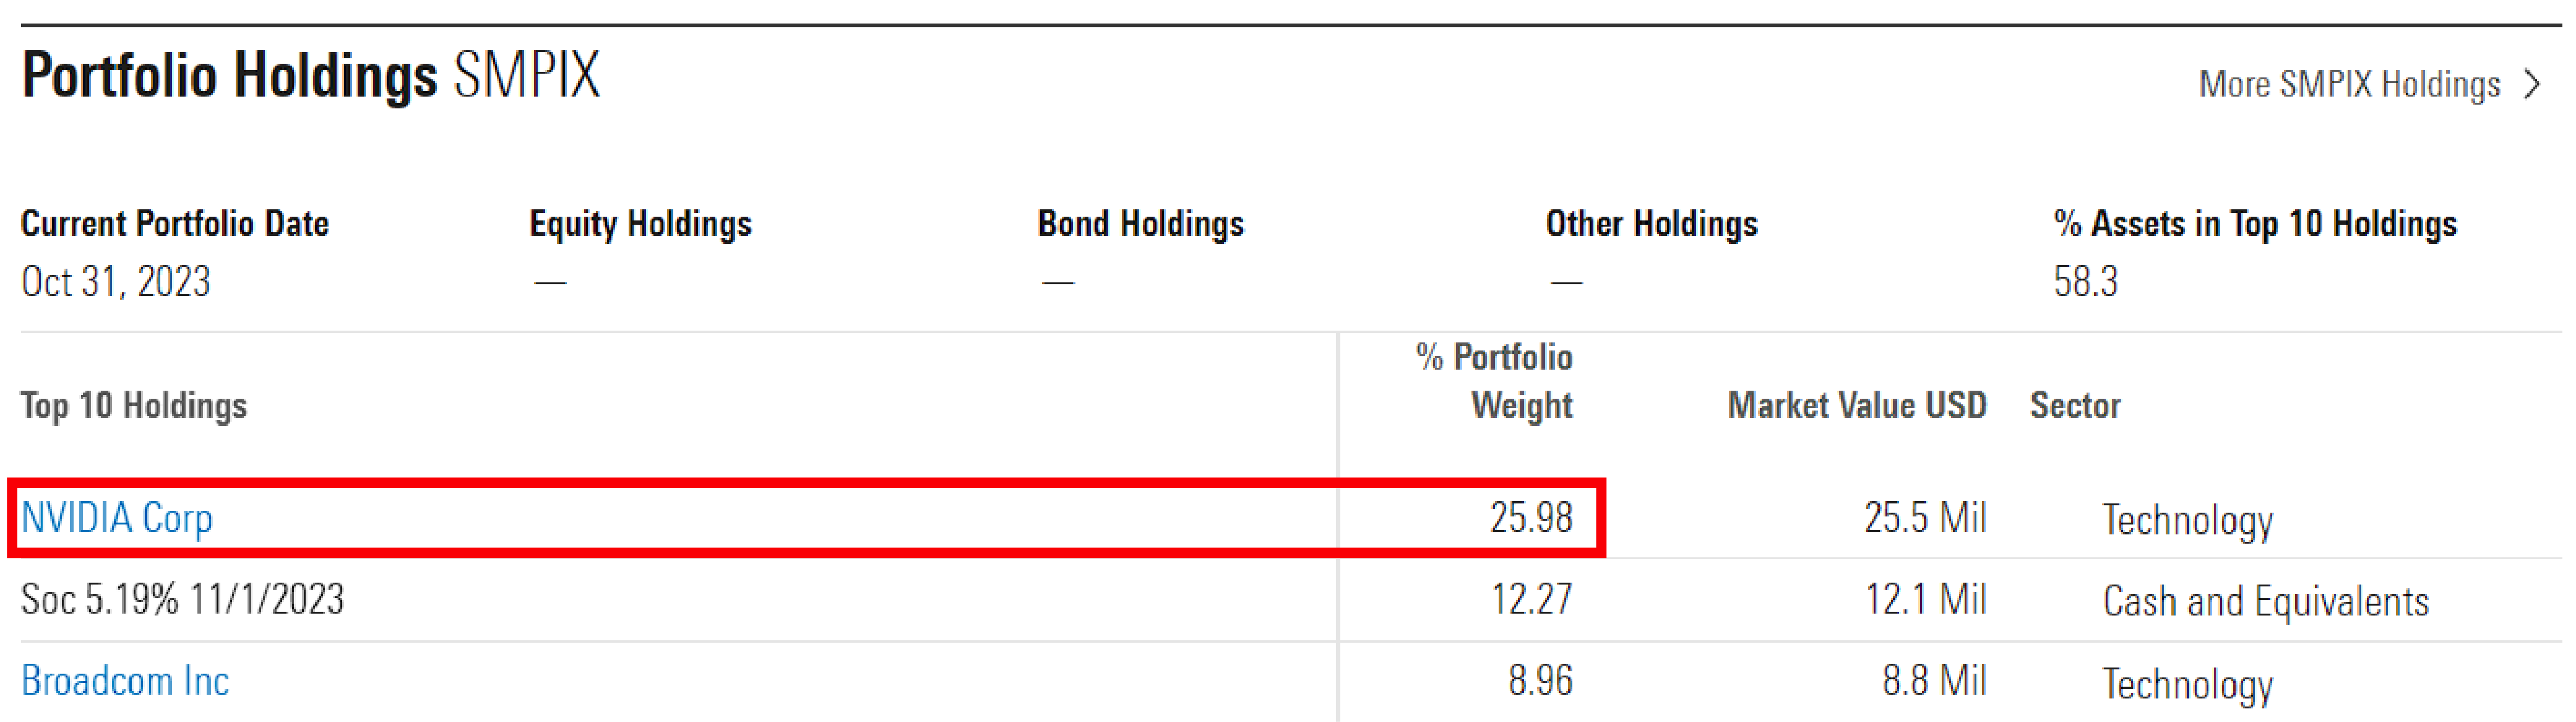
If the investor has been keeping up with the news, he/she might have noticed the buzz surrounding NVIDIA Corp, which currently comprises over 25% of this fund. This significant allocation could be attributed to Nvidia's recent performance, potentially resulting in an increased allocation over the past few months or year. Moreover, given the fund's structure, investors may also benefit from an additional 50% return, further enhancing overall returns.
This fund has indeed performed impressively, particularly in recent years. However, it's essential to acknowledge its inherent risk, as evidenced by its decline of over half its value in 2022. Nevertheless, its remarkable recovery is evident, with a staggering increase of 155% in 2023. Even as we're just two months into 2024, the fund has already surged by 54%. The Quartile Sector Rotation portfolio recipe, while highly concentrated, has demonstrated its ability to select high-performing funds effectively. In this instance, it accurately identified the hottest sector and leveraged a fund to amplify returns by 50%. Indeed, the exceptional performance of this particular recipe can be attributed to its ability to select high-performing funds, such as the one focused on the hottest sector, and leverage them for amplified returns. Even over the 15-year timeframe, it has achieved an impressive annualized return of 25.4%. However, it's crucial to remember that such high returns come with inherent risk, as evidenced by drawdowns of up to 50%. Thus, while the returns are noteworthy, they are not without their fair share of risk.
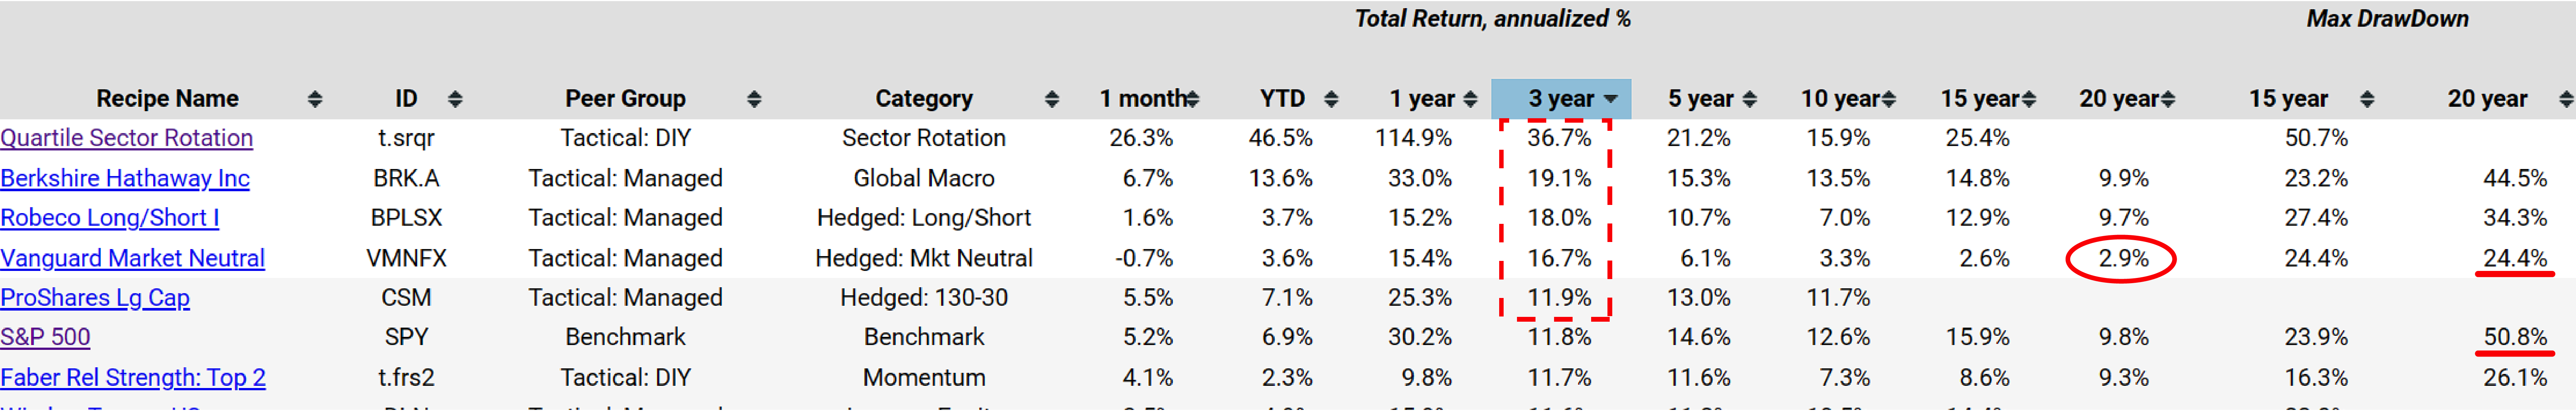
When we extend the time horizon to three years, we notice that only a handful of recipes, five to be precise, have outperformed the S&P 500 (SPY) represented by this ETF, in terms of total annualized return. However, it's essential to consider risk as well. While the SPY has experienced a significant 50% drawdown over the last 20 years, at least one of these recipes has only faced half that amount, notably the Vanguard Market Neutral (VMNFX). Nevertheless, it's worth noting that over the same 20-year period, this market-neutral strategy has delivered only a modest return of 2.9%.
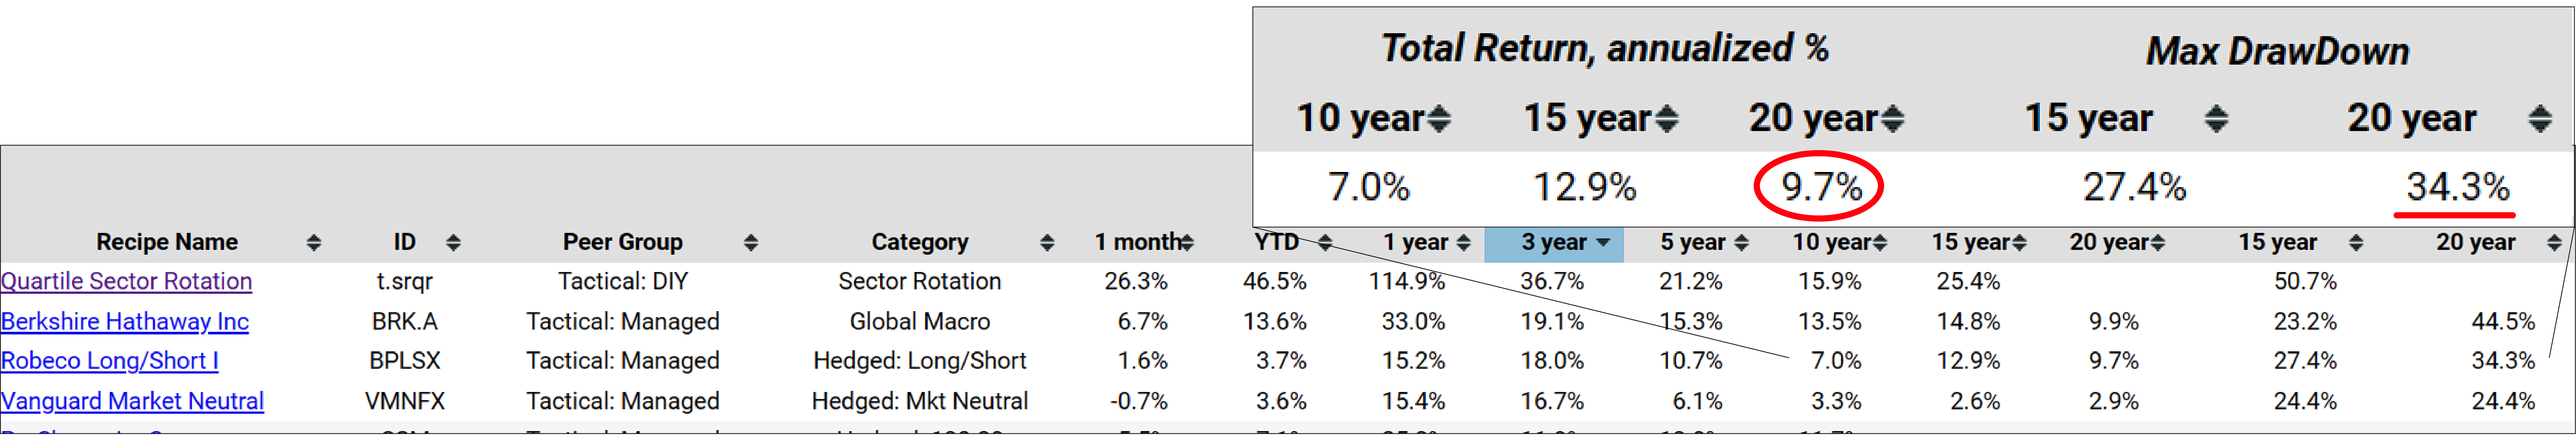
Indeed, the Robeco Long/Short Institutional (BPLSX) fund is an intriguing benchmark, although it may not be directly accessible to retail investors. Nevertheless, it provides valuable insights for benchmarking purposes. Over the past 20 years, it has delivered a solid return of 9.7%, with a maximum drawdown of 34%. This demonstrates the effectiveness of their long/short strategy, which has certainly earned its keep. While it may have been challenging to outperform the SPY purely in terms of return over the past three years, a different narrative emerges when considering risk-adjusted returns.
The tactical Portfolio Recipe with SPY-like return
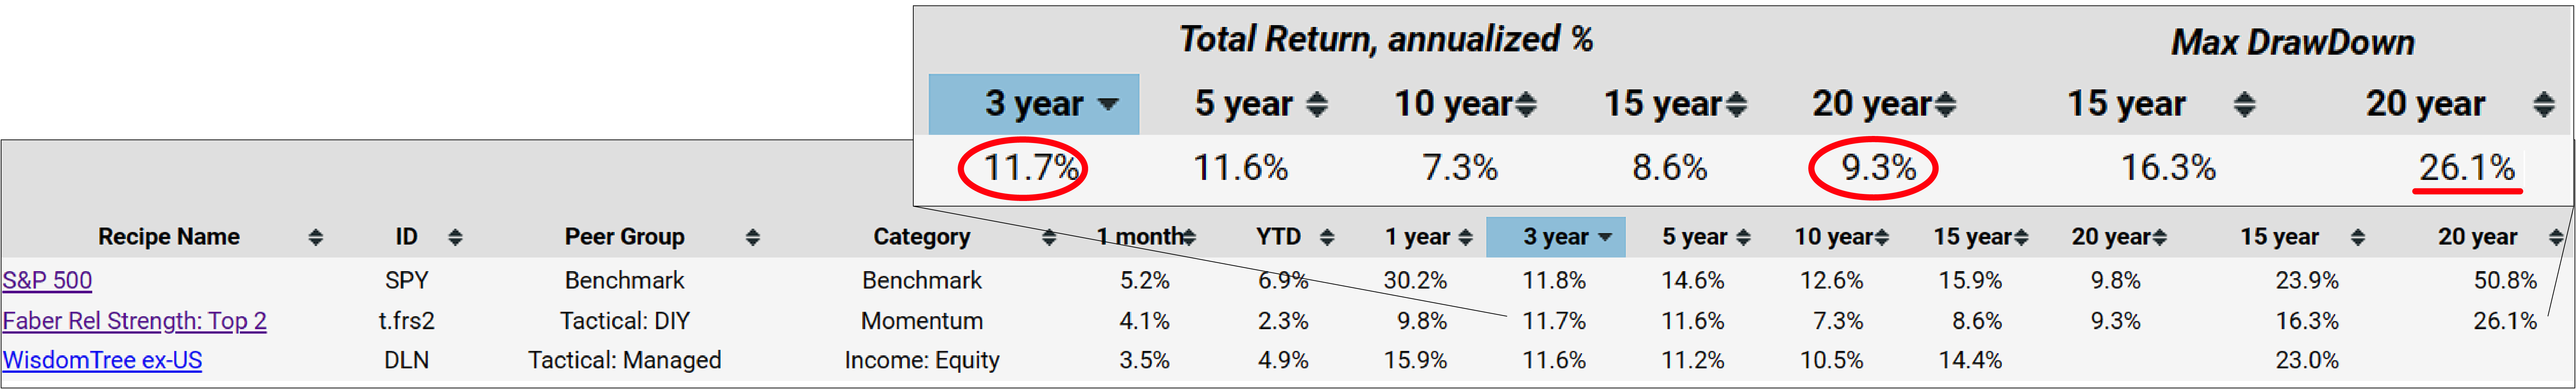
Certainly, the Faber Relative Strength: Top 2 (t.frs2) portfolio recipe presents an intriguing case. Despite slightly underperforming the SPY over the last three years, with a return of 9.3% compared to SPY's 9.8%, its risk management strategy sets it apart. The significant difference lies in its 20-year maximum drawdown of 26.1%, which includes the 2008 financial crisis. This suggests a robust risk mitigation approach. This recipe selects two funds from a collection of six ETFs to form its portfolio and operates tactically, unable to update monthly. However, its unique feature is the ability to pivot to safety when an asset class's simple moving average falls below its ten-month counterpart. In such instances, the algorithm can invest in iShares 1-3 Year Treasury Bond (SHY), offering a defensive stance in volatile market conditions. This safety mechanism likely played a pivotal role in sparing the portfolio from the extreme drawdown experienced during the 2008 crisis.
Indeed, it's been a remarkable journey, particularly when comparing various portfolio recipes to the performance of the SPY, which has seen exceptional growth over the past 15 years. While there may not be anything that has outperformed the SPY in terms of both higher return and lower risk over this period, it's important to consider the broader context. The SPY has experienced significant fluctuations over time, with periods of downturn and upturn. Our analysis captures both ends of the spectrum, likely hitting during downturns and upswings, highlighting the importance of considering the full trajectory of investment performance.
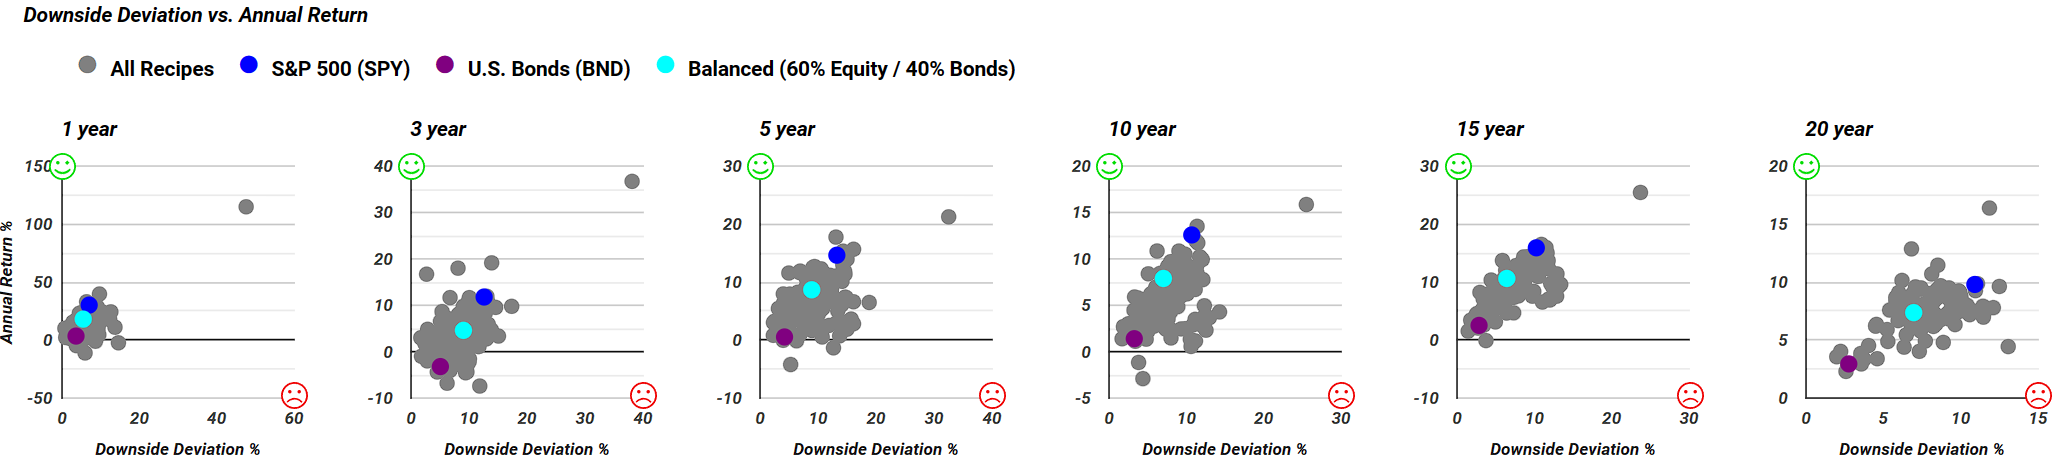
When we examine different time frames, especially over the long term like the 20-year graph or the shorter term like the three-year graph, we notice that while the SPY has shown strong performance in some periods, it has also faced significant risks. This is why we rely on scatterplots to help illustrate the relationship between risk and return when choosing different investment strategies. These plots offer a clear picture of the trade-offs involved in selecting the right portfolio recipe. We provide scatterplots not only for maximum drawdown but also for downside deviation, which can help you understand risks better. This tool is incredibly useful for investors as it shows how risk and return align over time. While the SPY may have performed well in the past 15 years, it's essential to recognize that this level of success may not last forever. That's why we continue to explore various professionally managed mutual funds that offer consistent returns over the long term, helping to mitigate the impact of unexpected market downturns. In conclusion, our focus on these analytical tools and diversified investment options guides our commentary for this month.