Article-2024-01
January 2024 Recipe Investing - Commentary
Topics this month
- New 20-Year Metrics for Visualizing Risk and Return
- Layout Update: Quick Switching between Recipes and Ingredients
- New Portfolio Comparison Tool: Risk-Return Compass
- Two Mutual Funds That Fall Short: PIMCO All Asset (PAUIX) & Vanguard Star Inv (VGSTX)
Welcome to the January 2024 commentary from recipeinvesting.com. We track investable portfolio recipes that allow investors and advisors to build portfolios that minimize risk and maximize return. We reallocate and rebalance monthly, so we have plenty of new material to cover for our comparisons this month.
New 20-year metrics added
On the Recipe Summary page, where we display all the various portfolios we track, we've made a couple of updates.
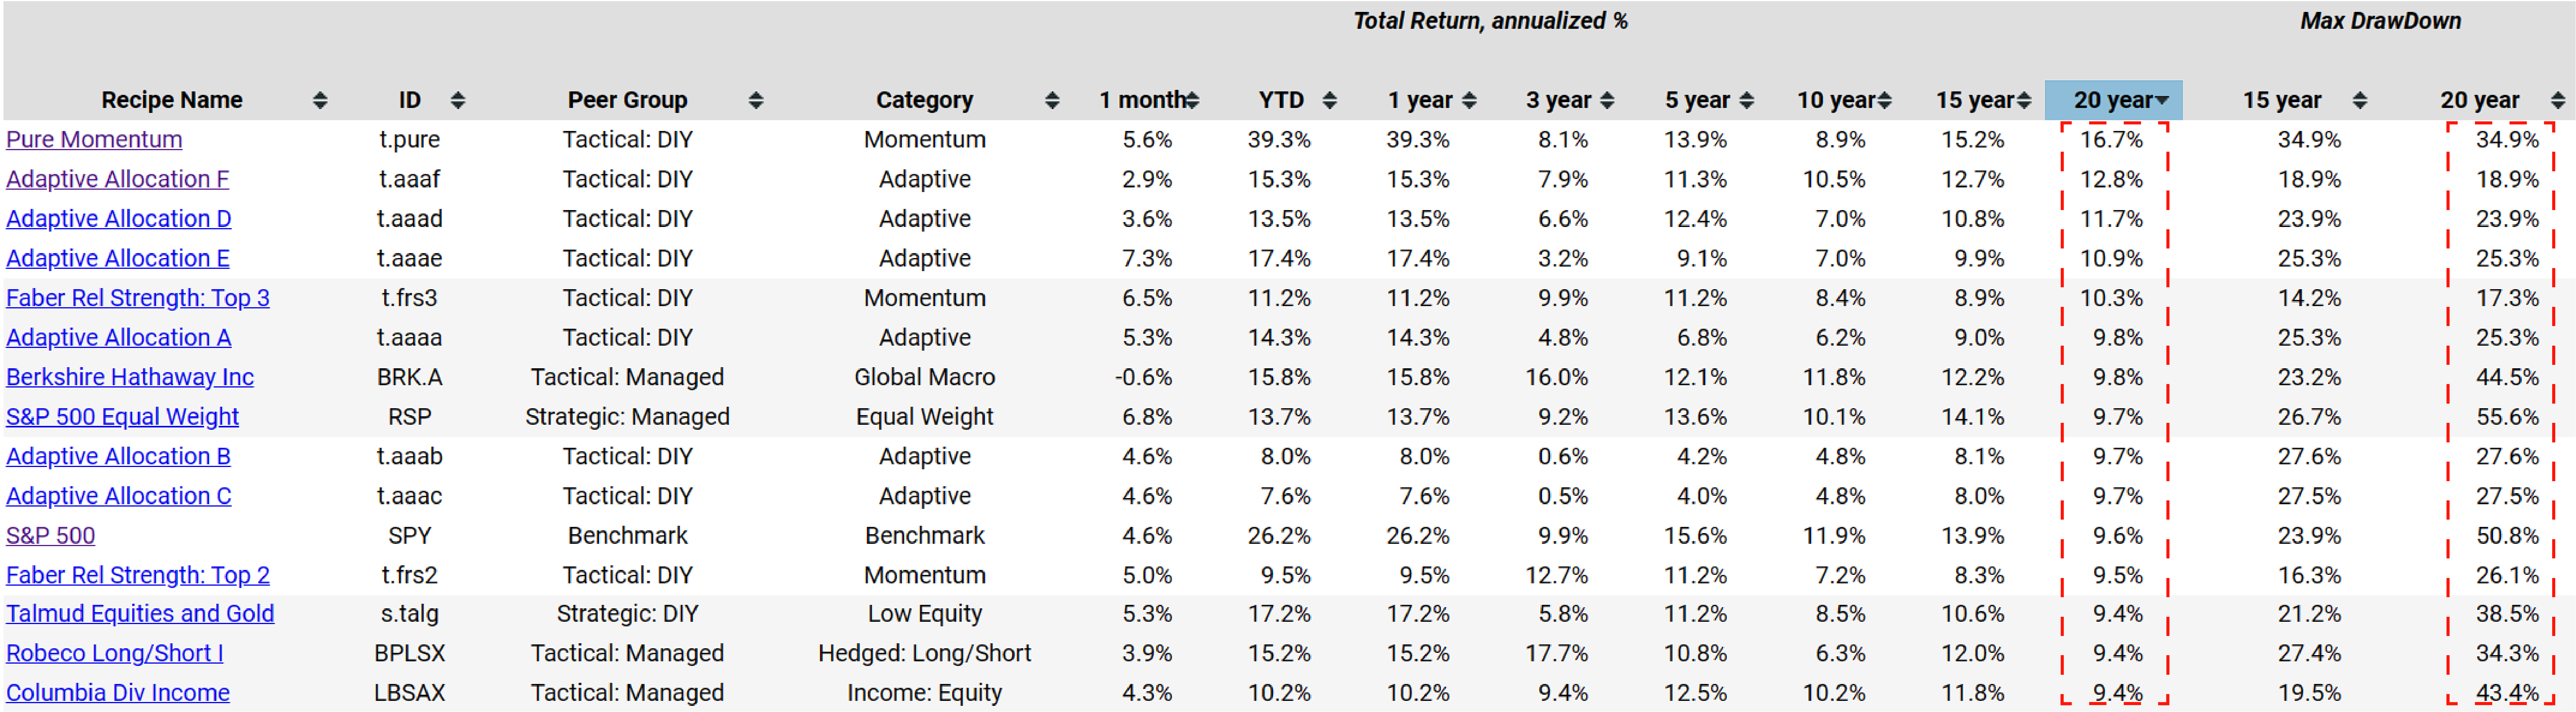
Firstly, we introduced a new column for a 20-year period in our risk and return metrics. This means investors can now view the annualized return specifically for the past 20 years. If the investors wish to sort by this criterion, they'll easily identify the portfolio recipes that performed best during this period, encompassing the challenging 2008 year. We've also extended this update to the maximum drawdown column.
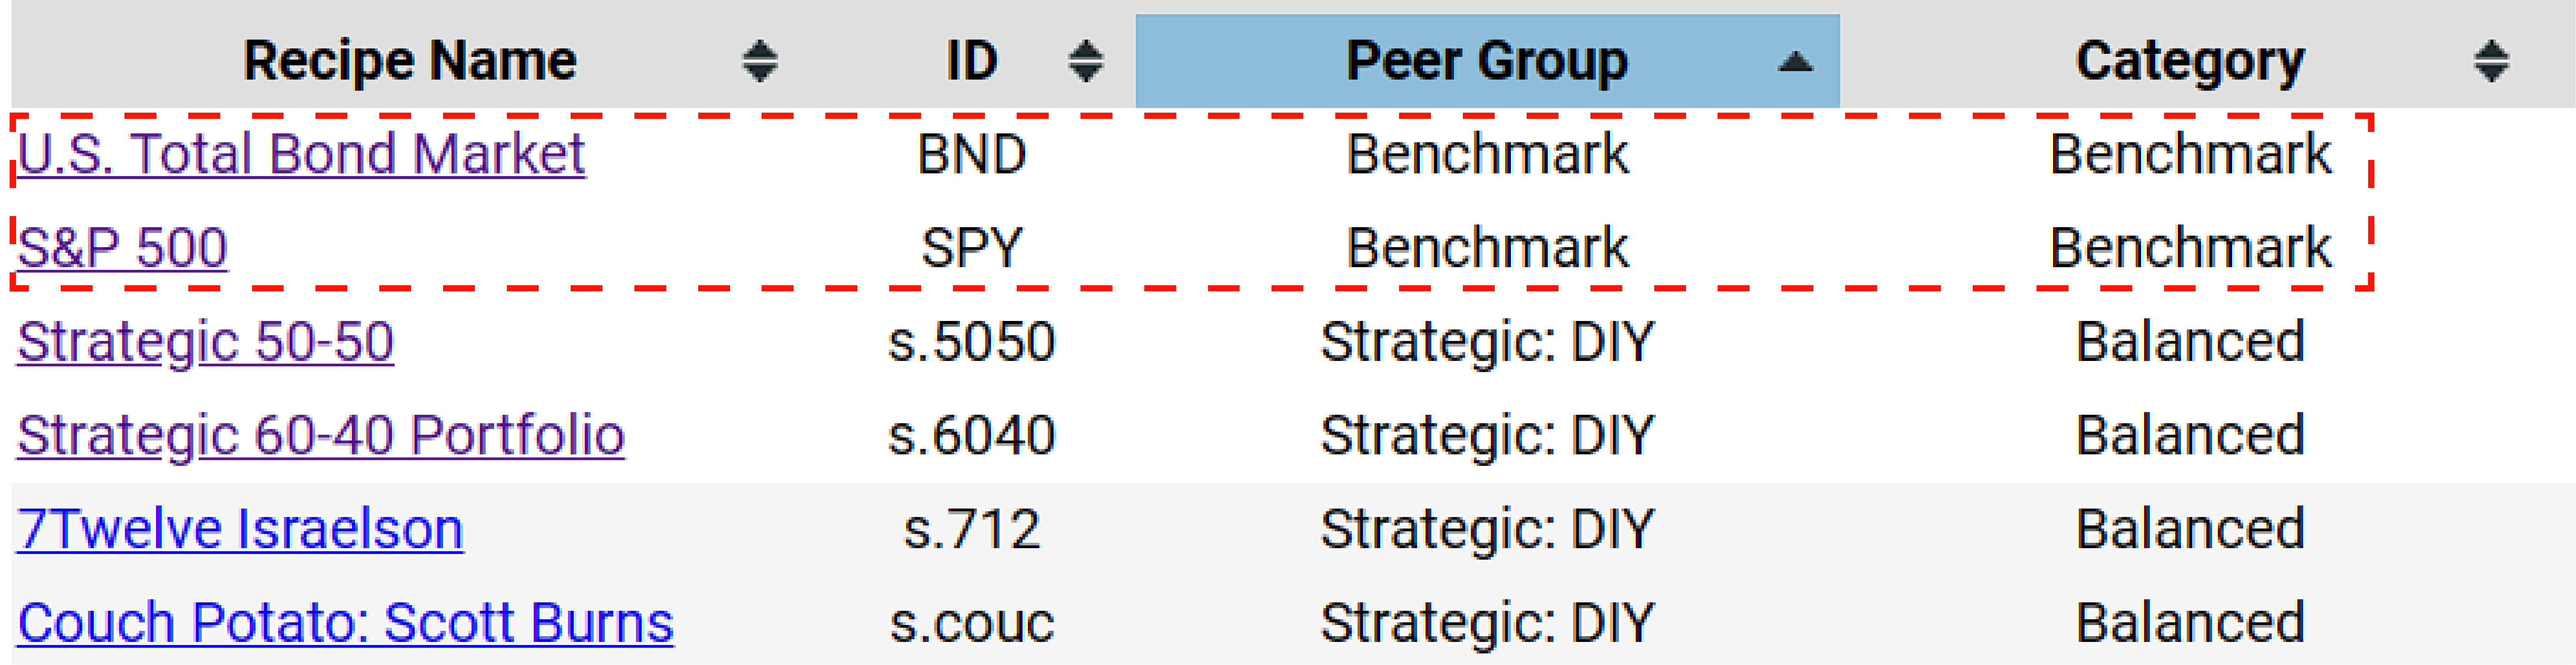
Moving on to peer groups, we've added two new rows as benchmarks: the U.S. Total Bond Market (BND) Fund and the S&P 500 (SPY). Both are now part of the comprehensive list of different portfolio recipes we compare on this summary sheet.
Quick Switching between Recipes and Ingredients
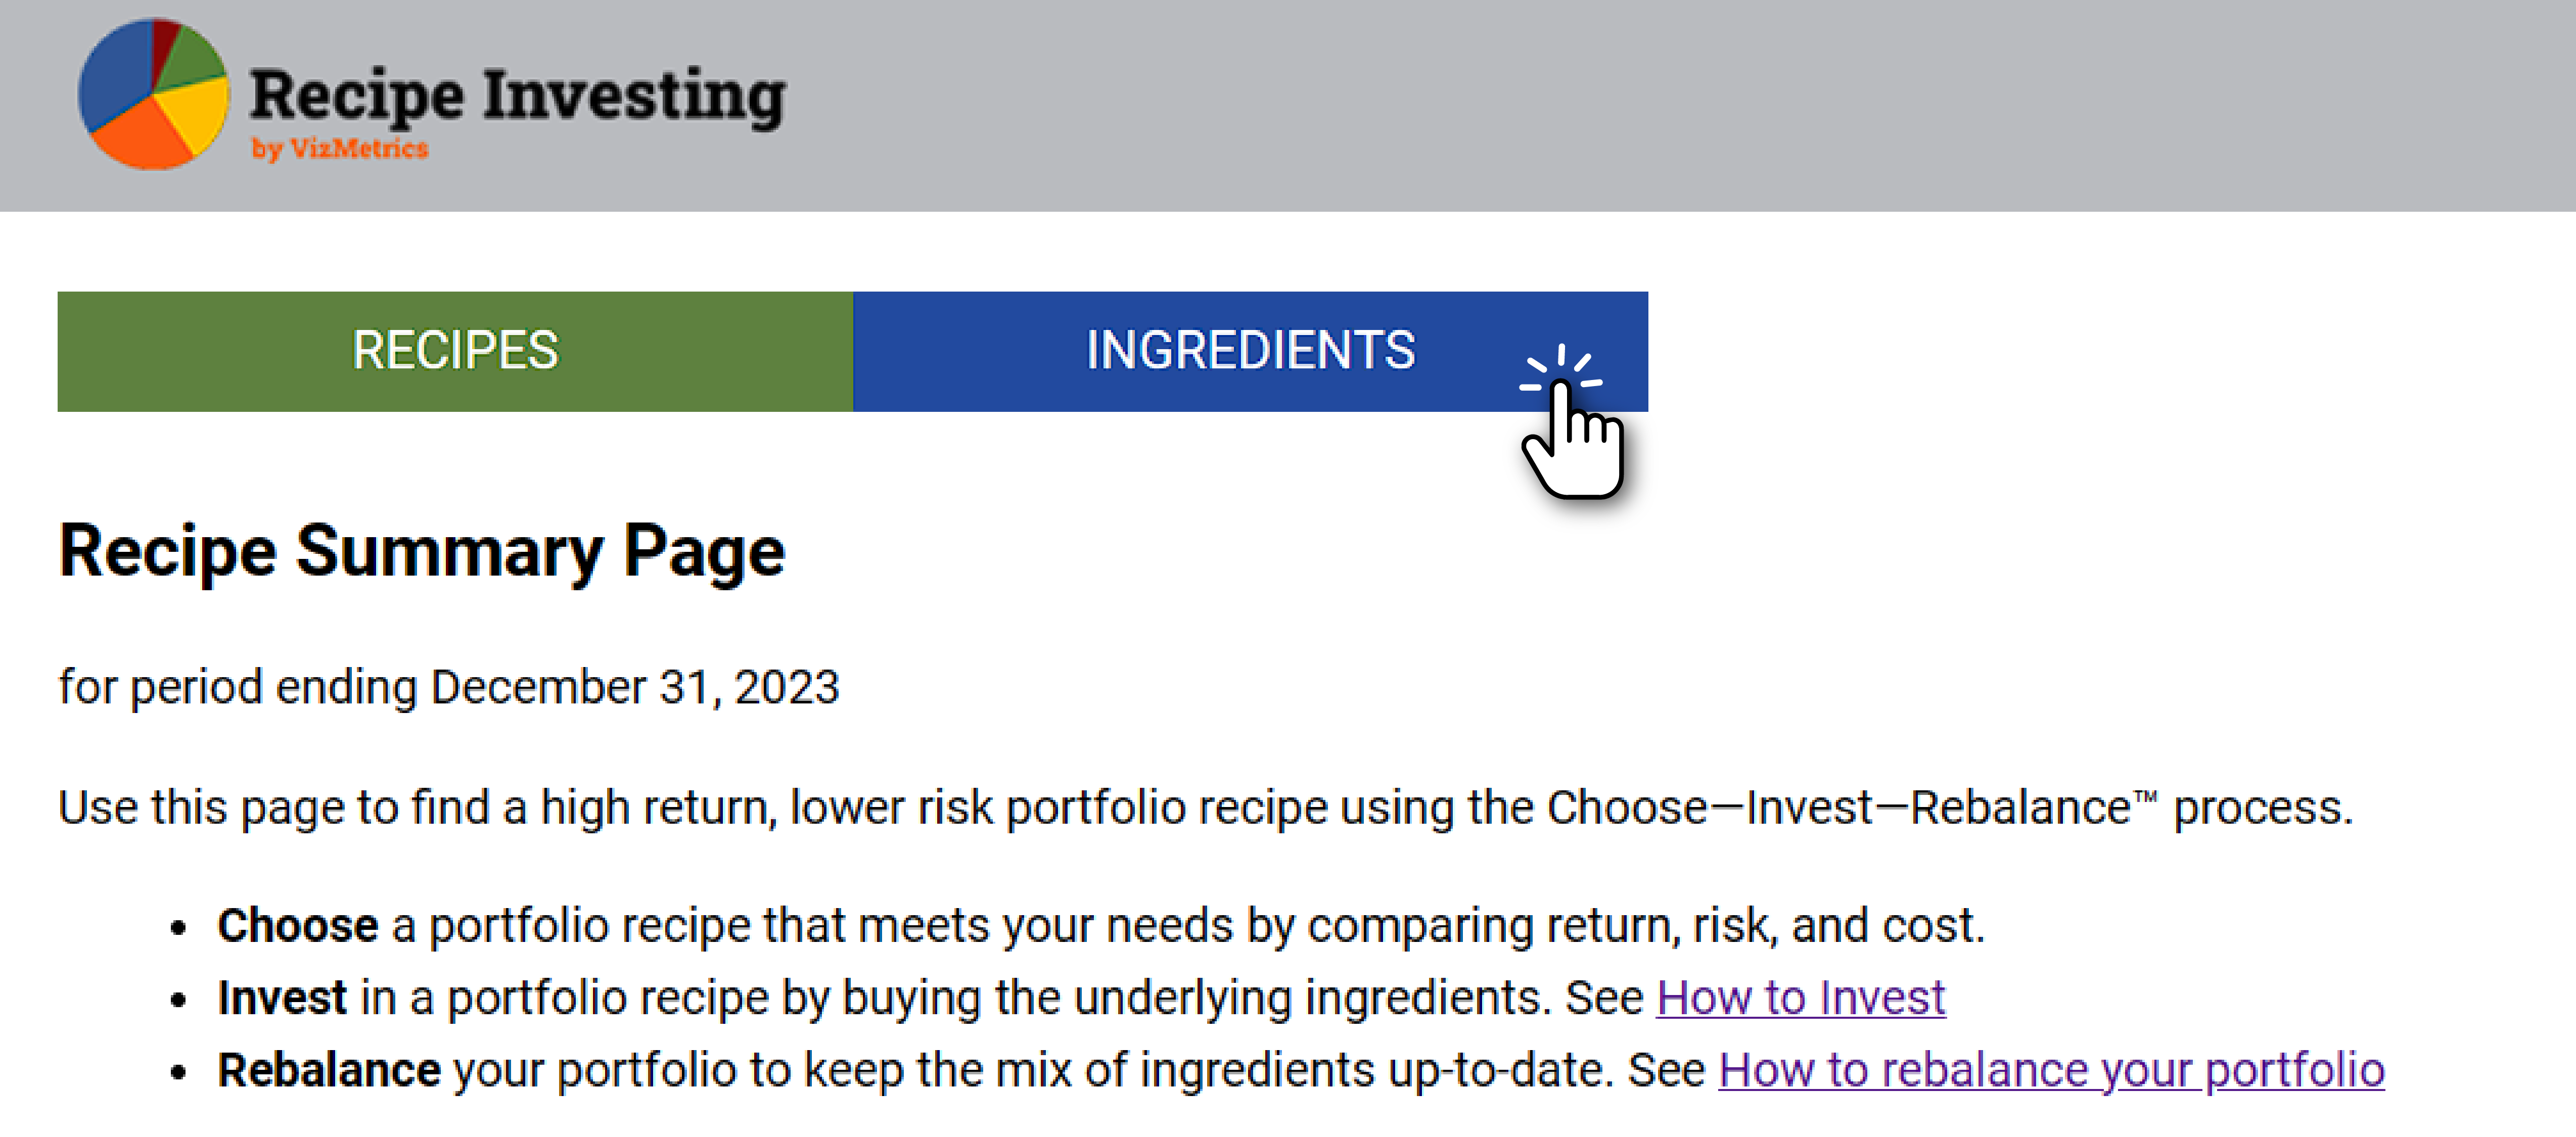
We've included a new navigation option at the top. By clicking on "Ingredients," it can quickly switch to view all the recipe ingredients, which, in this context, are exchange-traded funds categorized into various peer groups such as global asset classes, global equities, and global sectors.
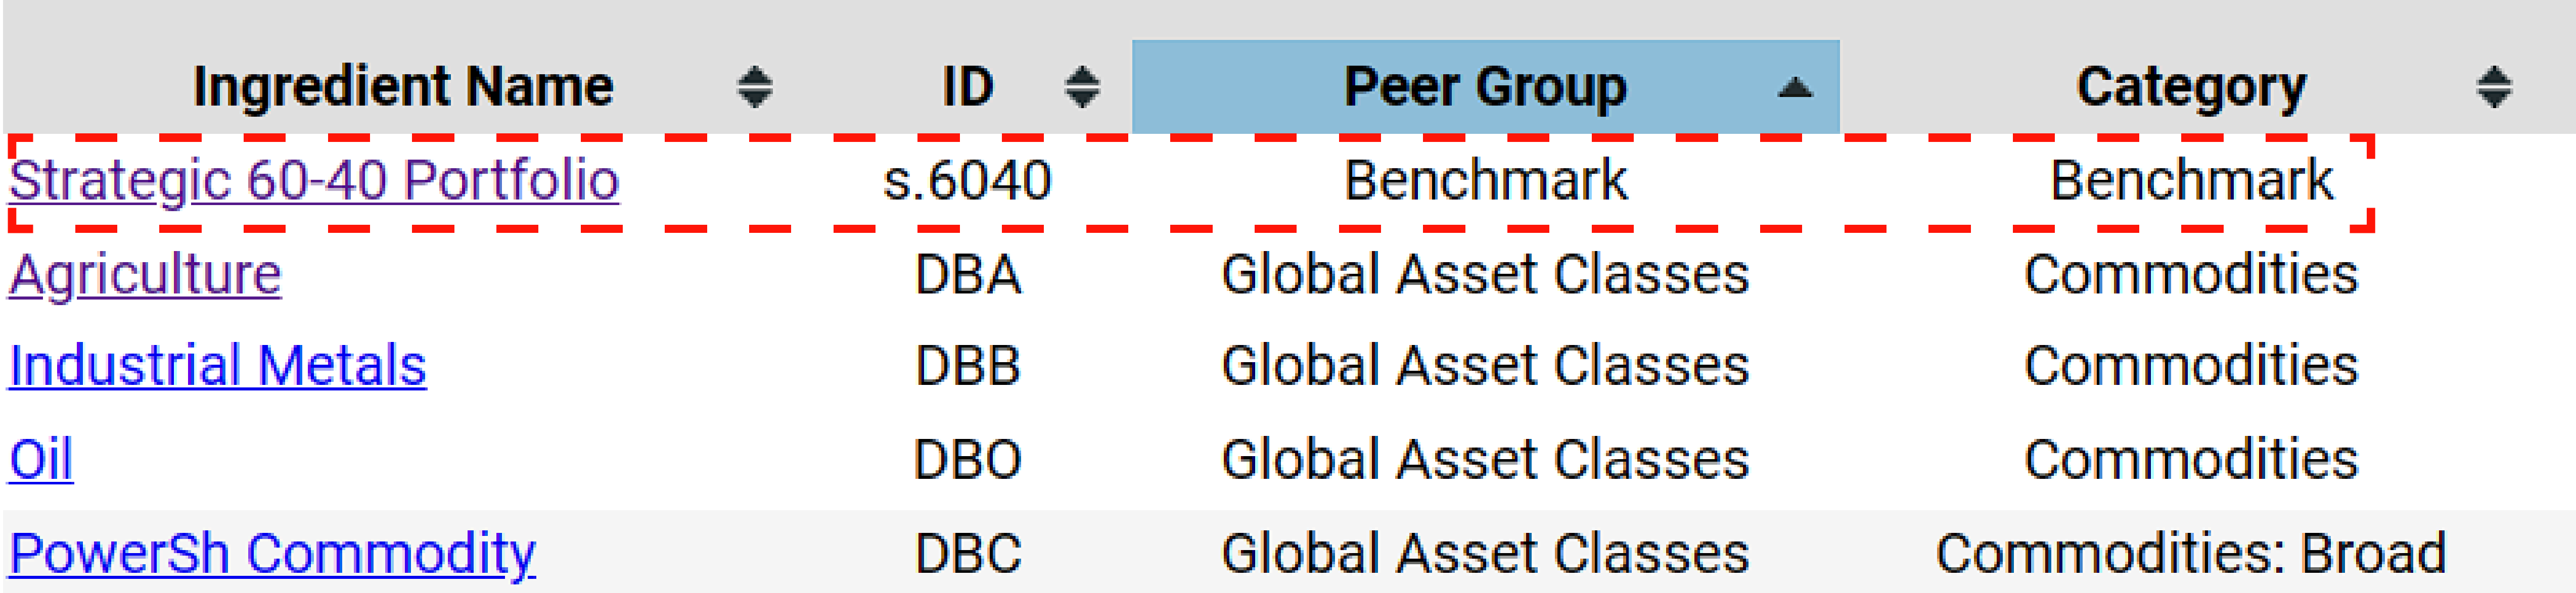
Similar to the changes made on the recipe page, we've introduced a benchmark on the ingredient summary page. Instead of specifying an asset class like a total bond fund, we've chosen to use the Strategic 60-40 Balanced Portfolio (s.6040) as the benchmark.
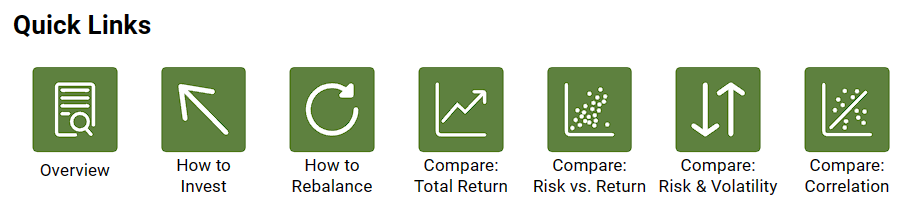
Let's take a closer look at the detailed page layout. We've introduced icons that help investors to quickly navigate to different sections such as total return, risk versus return, the risk section, and the correlation section. The content remains generally the same, but we've reorganized it slightly for easier understanding.
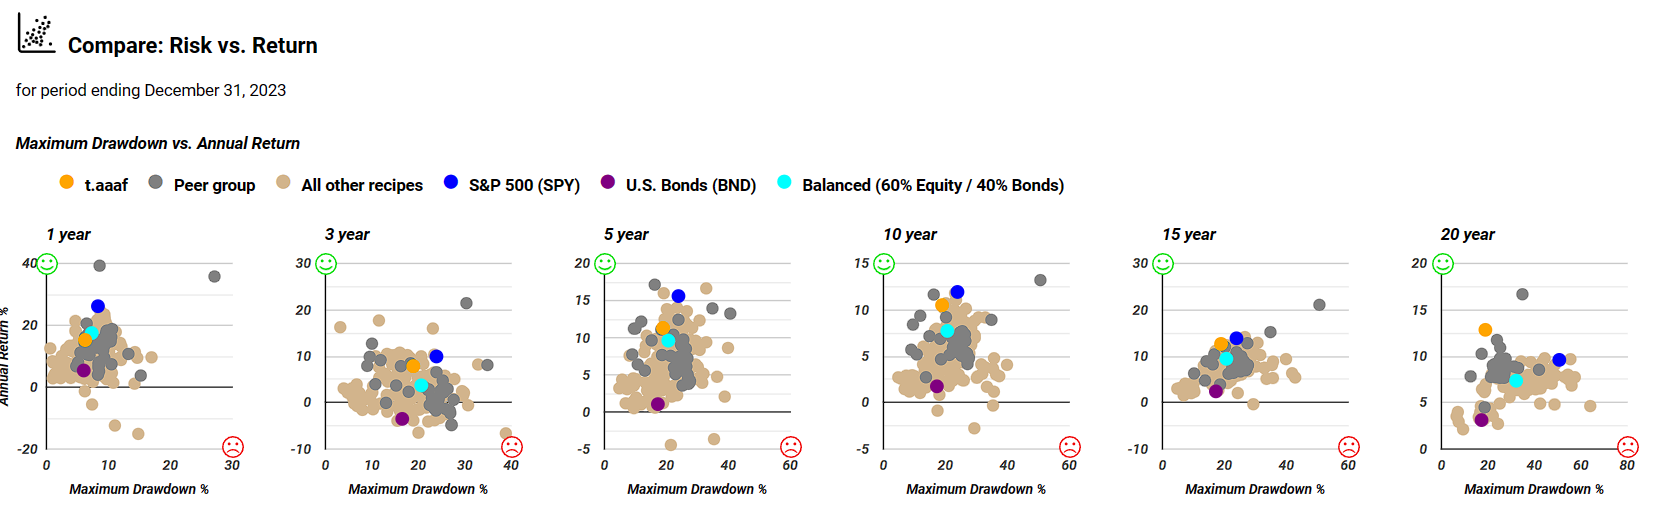
Moving down to the risk versus return section, we changed the dots to tan instead of light yellow, aiming to enhance readability. The maximum drawdown scatter plots, downside deviation scatter plots, and standard deviation scatter plots now follow one after the other.
The Risk-Return Compass Tool
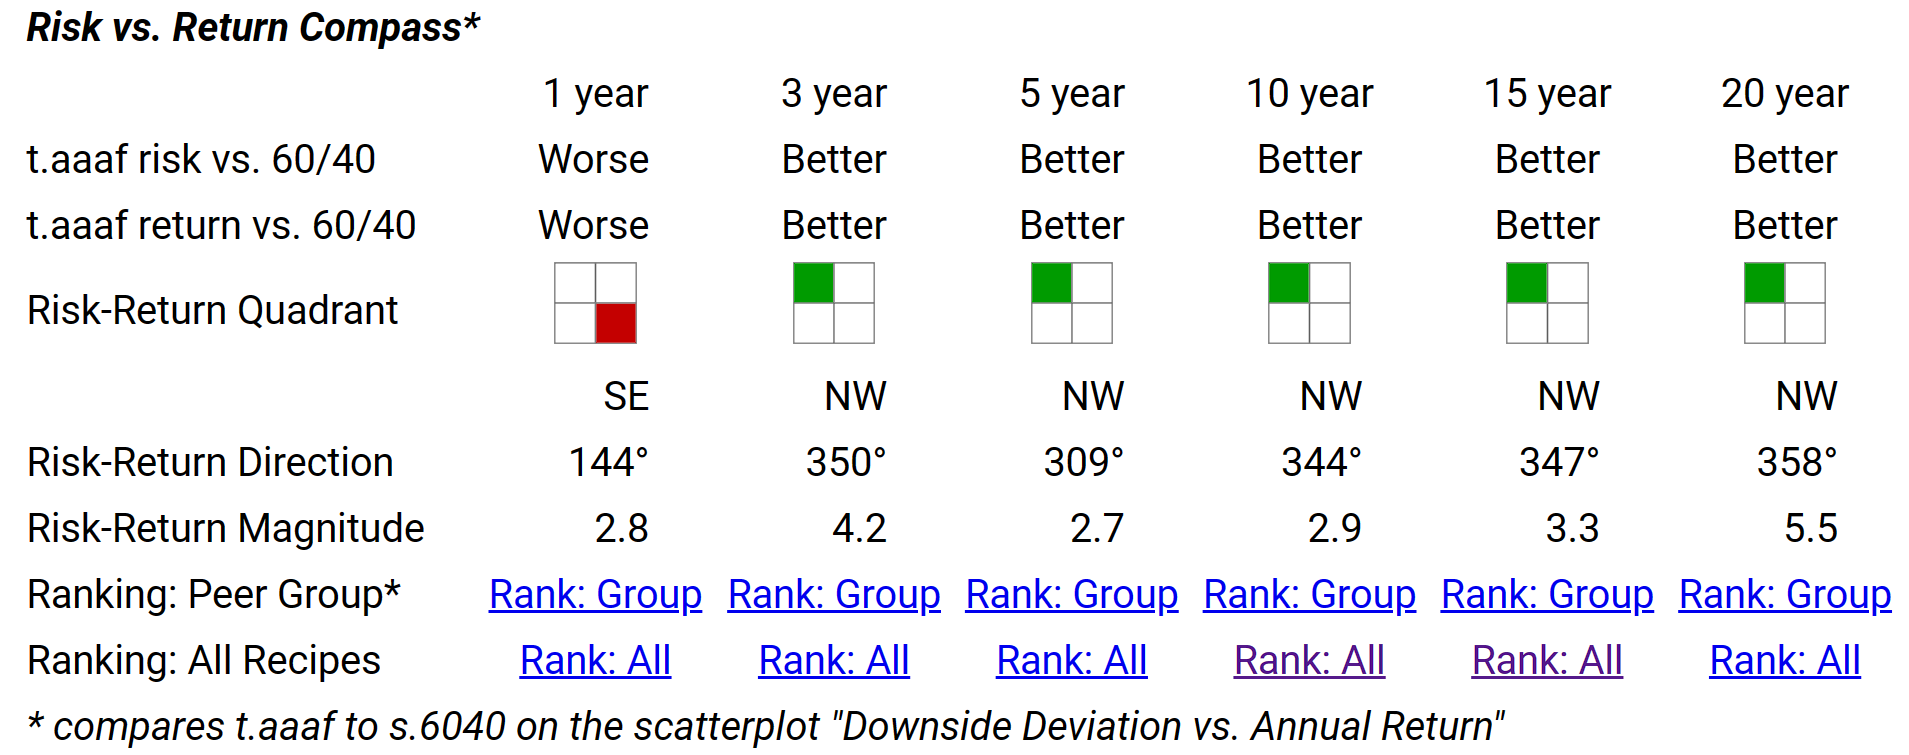
Now, I'd like to introduce something new that wasn't available before, and we're calling it the risk-return compass. This feature generates four different icons in red, green, blue, and yellow. These icons indicate where a specific recipe falls on the scatter plot for downside deviation versus annual return. Our benchmark for comparison is the 60% equity 40% bonds Balanced fund. This benchmark comprises 60% VTI, a Vanguard Total Stock Market ETF, and 40% of BND, a Total Bond Market ETF. This combination creates a simple two-ETF portfolio, referred to as the balanced 60% equity 40% bonds benchmark, represented as teal on all the graphs.
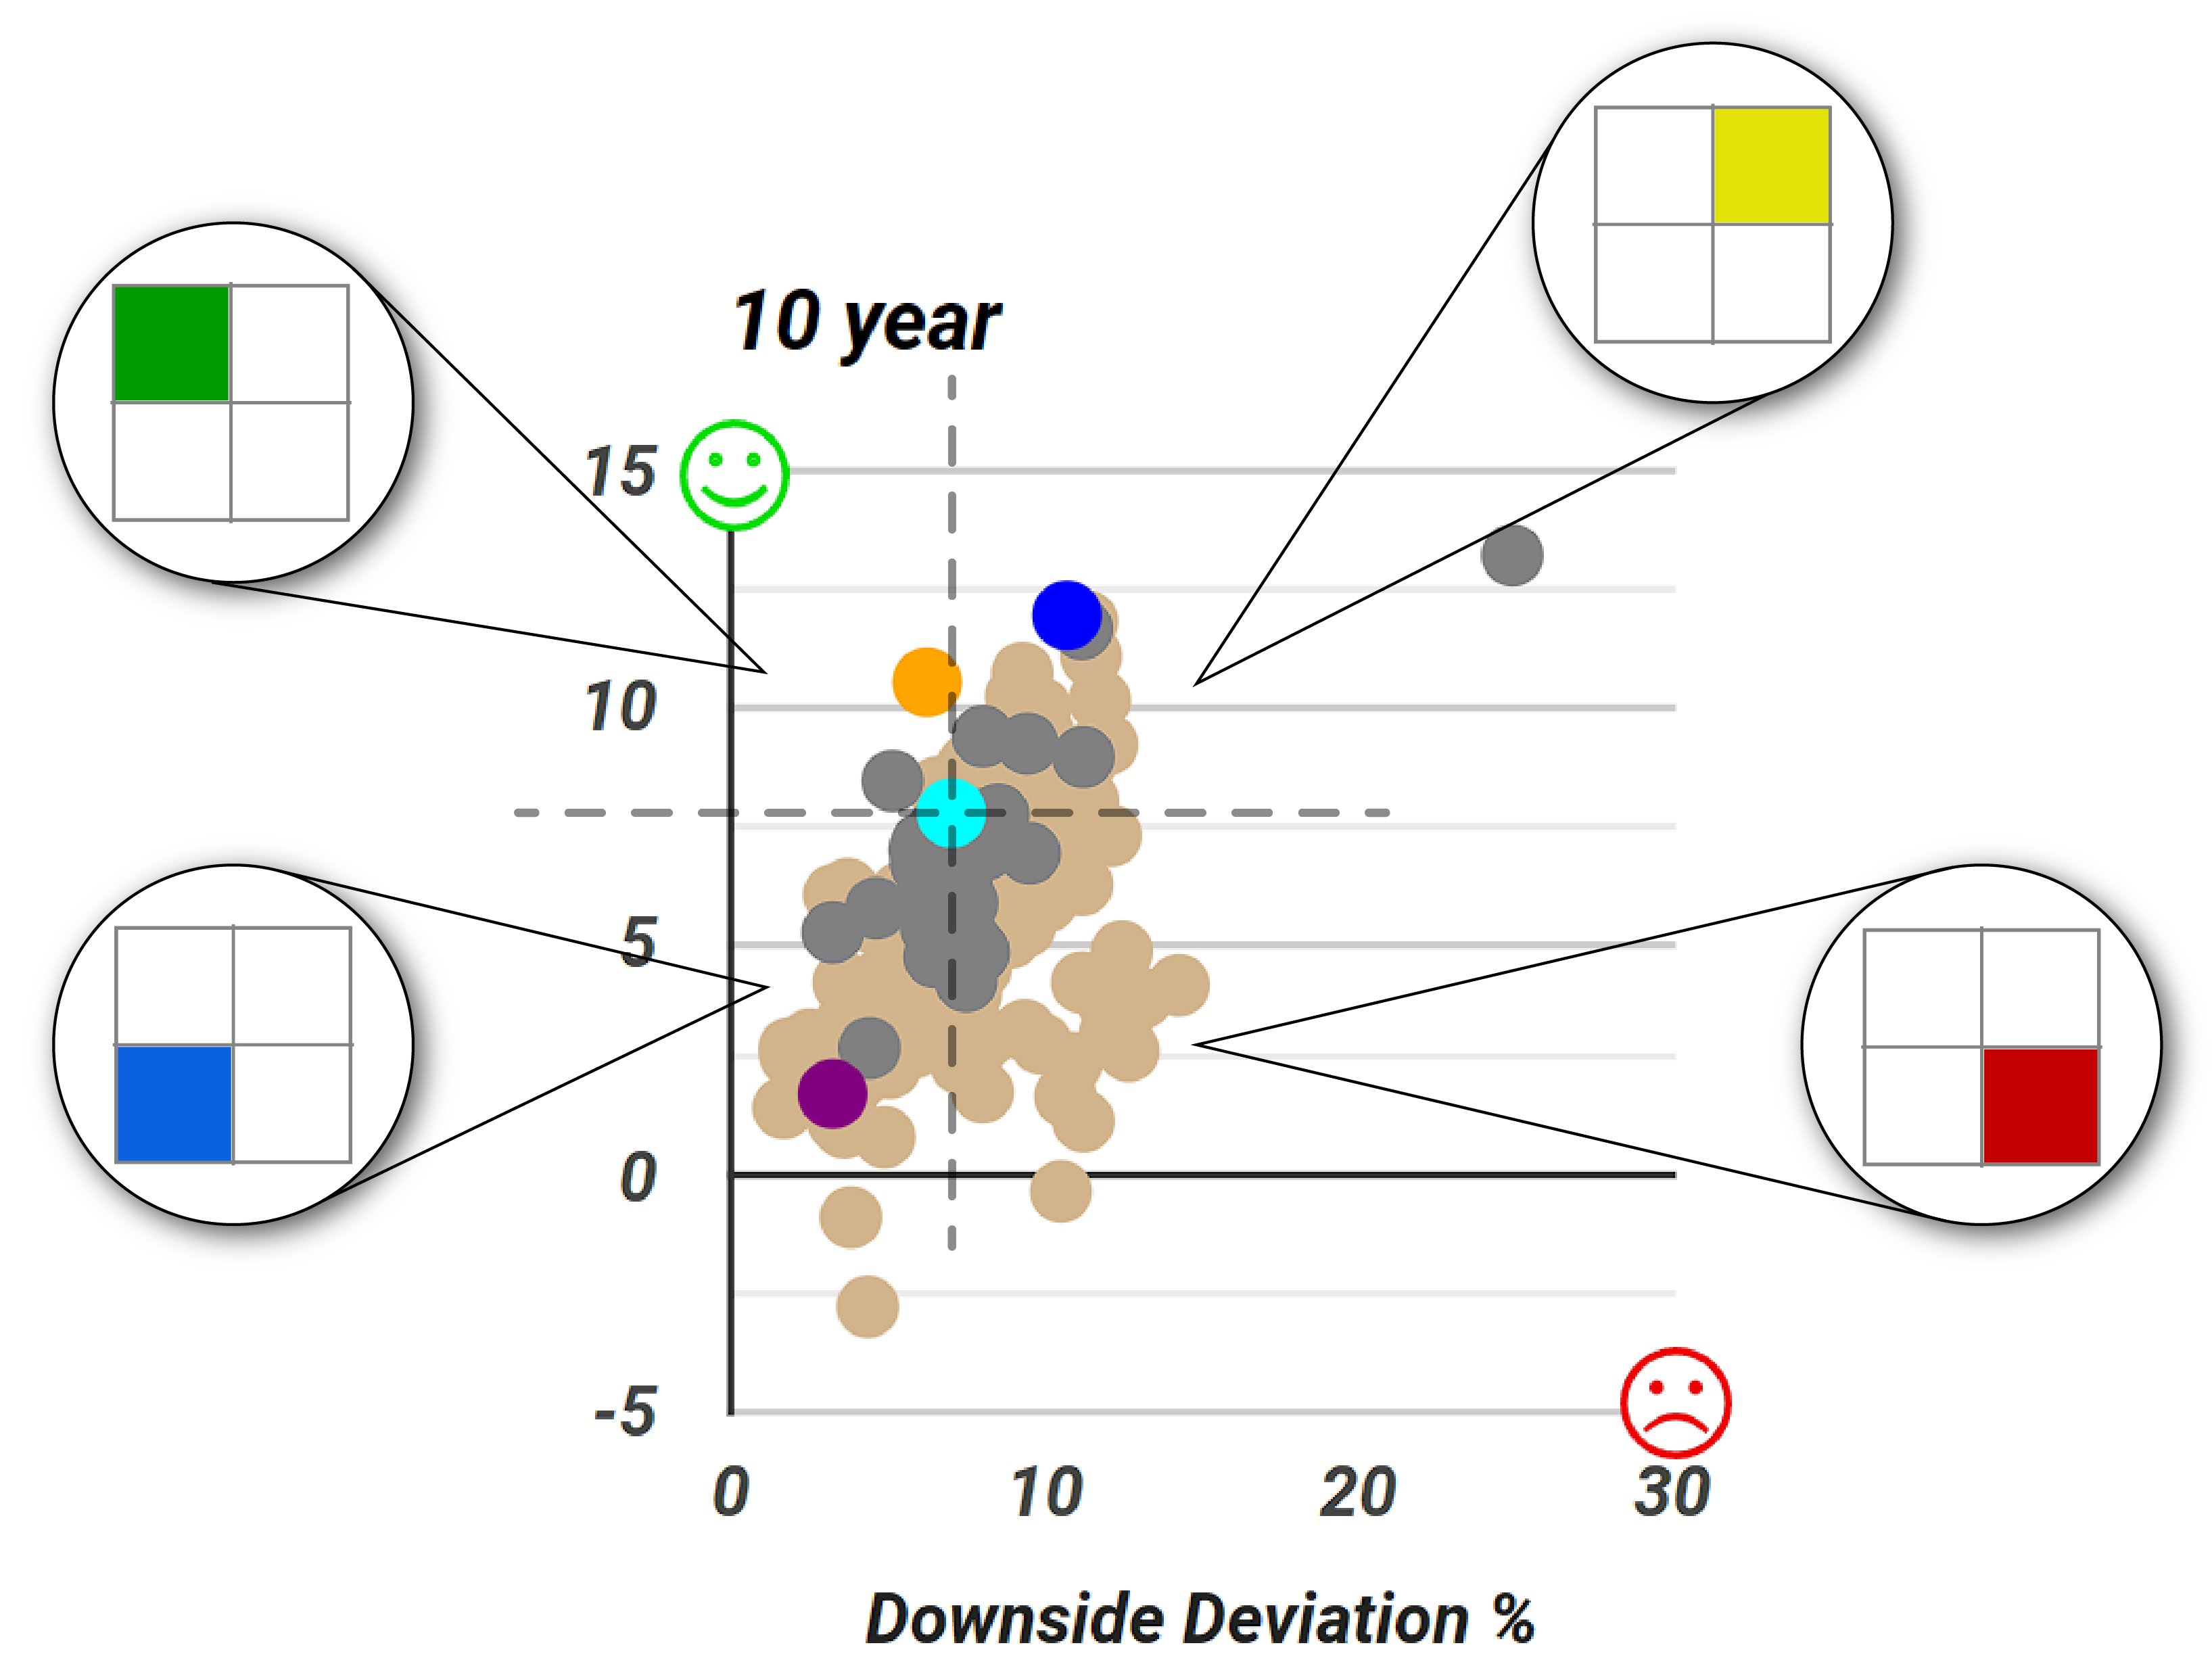
If we draw a vertical line down through that teal dot and a horizontal line right across it, we create four quadrants. Now, for the recipe or portfolio in question, we can determine which quadrant it falls into. Is it in the northwest quadrant, represented by the green smiley face and a green square, signifying a favorable mix of lower risk and higher return? Or, unfortunately, does it fall into the less desirable category of higher risk and lower return, found in the red quadrant below? There's also the possibility that the investment, or in this case, the recipe, lies in the upper right-hand quadrant, indicating higher risk but also higher return—something that might catch the investor’s interest. And then, at the bottom, there's the option of lower risk and lower return, which could also be of interest. So, we have four possibilities, each represented by a different color in the risk-return quadrant.
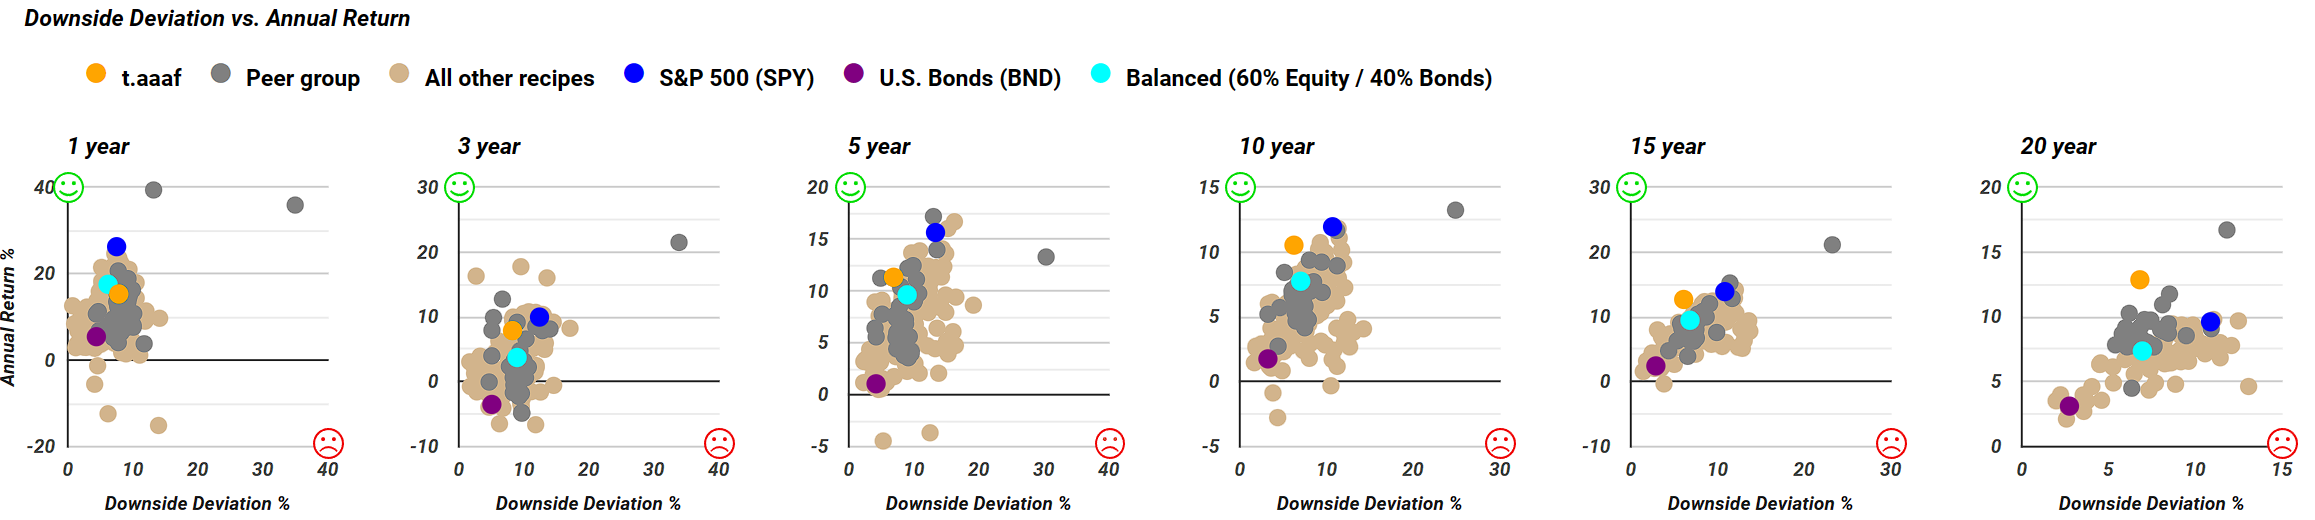
Looking at Adaptive Allocation F (t.aaaf) in this analysis, it outperforms the 60/40 Balanced Portfolio in both risk and return across the 3-year, 5-year, 10-year, 15-year, and 20-year periods. Although there's been a slight dip in performance over the past one year, examining the downside deviation scatter plot reveals that it is slightly below and to the right of the teal dot, indicating a marginally less favorable position but not significantly so. This explains the continued popularity of this portfolio recipe, consistently delivering higher returns year after year with either the same or lower risk compared to a balanced portfolio. Notably, over the 20-year period, it exhibits nearly the same downside deviation, or even less, than the balanced portfolio benchmark, yet achieves considerably higher returns.
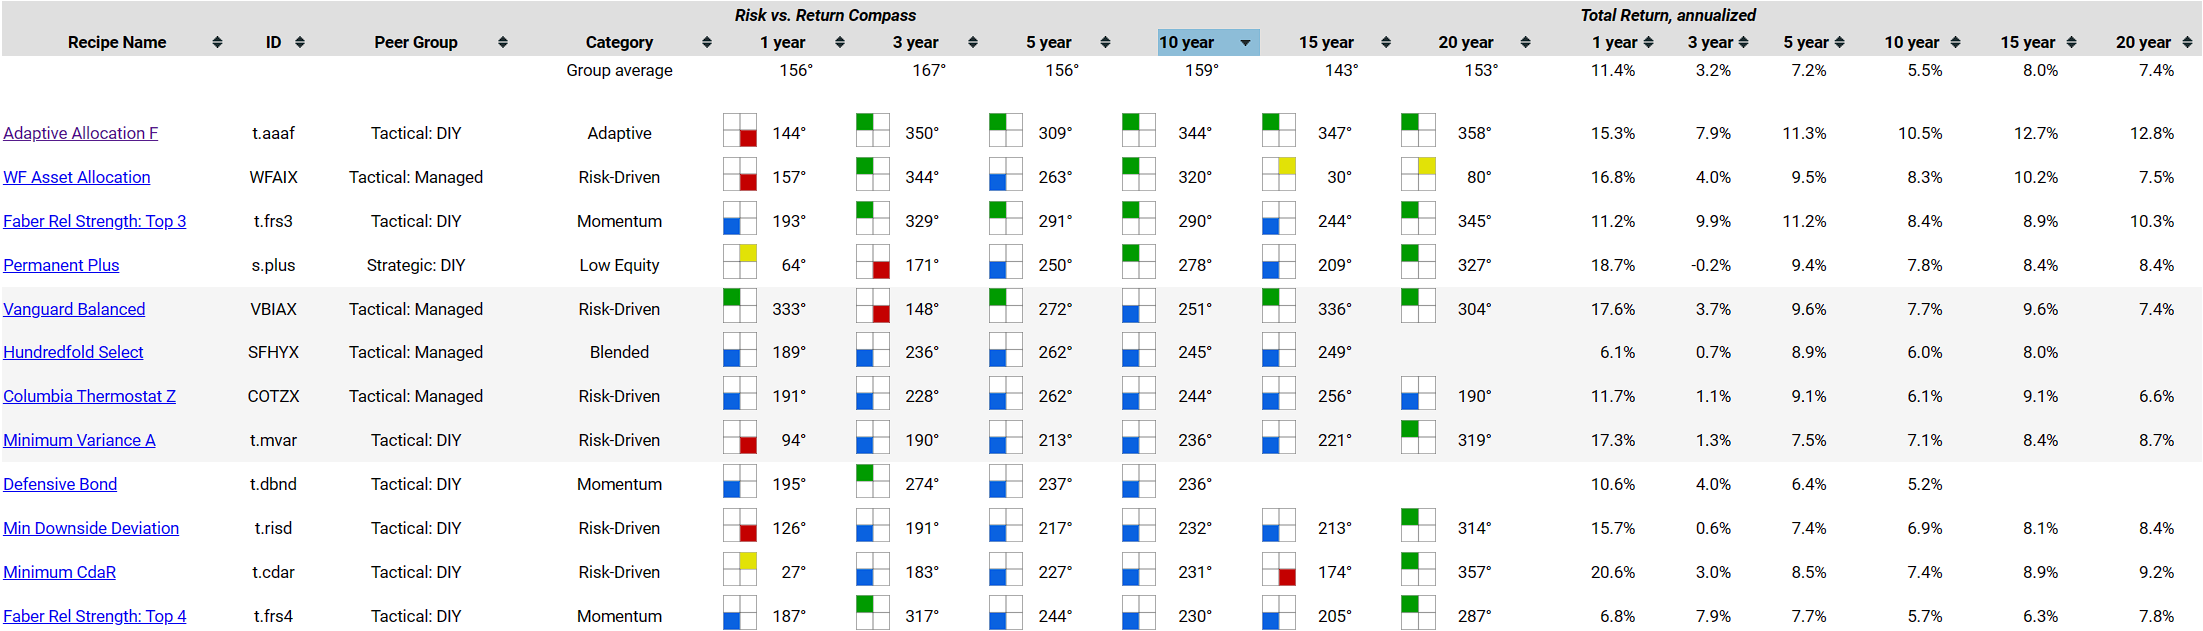
This tool provides a visual means to compare any specific portfolio with the benchmark of the 60/40 Balanced Portfolio fund. What's also noteworthy is having the "Rank All," revealing icons for all the portfolio recipes under comparison. When we sort the table by 10-year, we observe that only four portfolio recipes have managed to achieve both higher returns and lower risk over the past ten years. This suggests that applying such a stringent filter makes it a challenging benchmark for our portfolio recipes, but having rigorous standards ensures a robust evaluation. Hence, this allows us to distinguish between portfolios that perform well and those that don't. By applying these criteria, we can quickly identify potentially interesting portfolio recipes. Out of the many, only four have met the criteria.
For instance, there's "Permanent Plus (s.plus)," a strategic DIY portfolio that passed the 10-year test. "Adaptive Allocation F," as we noted earlier, has shown consistent performance across the 3-year to 20-year time horizons. Another candidate is "WF Asset Allocation (WFAIX)," a tactical managed fund from Wells Fargo. Additionally, "Faber Rel Strength: Top 3 (t.frs3)" has passed the test, although it had a lower return with less risk over the specified period, indicated by the blue color. However, this might still be an acceptable trade-off for some investors.
As we continue, there are some intriguing trends. Over the past 20 years, several portfolios have outperformed the 60/40 balanced benchmark in both risk and return. The presence of blue squares signifies lower risk, lower return portfolio recipes. If the investor’s risk tolerance is not very high, exploring these options might be worthwhile for them.
Two Mutual Funds that fall short
Interestingly, we can also identify what might be termed the "Hall of Shame." Some portfolio recipes, including those managed by professional managers, have consistently underperformed the 60/40 balanced portfolio across all the time periods we've examined, spanning 20 years.

Take, for instance, the PIMCO All-Asset All Authority (PAUIX) fund, which has failed to outperform the 60/40 Balanced Portfolio benchmark over the whole time periods. In this case, opting for the simple two-ETF portfolio recipe might be a more favorable choice than entrusting funds to the PIMCO fund manager. This raises the question: What factors contribute to such underperformance?
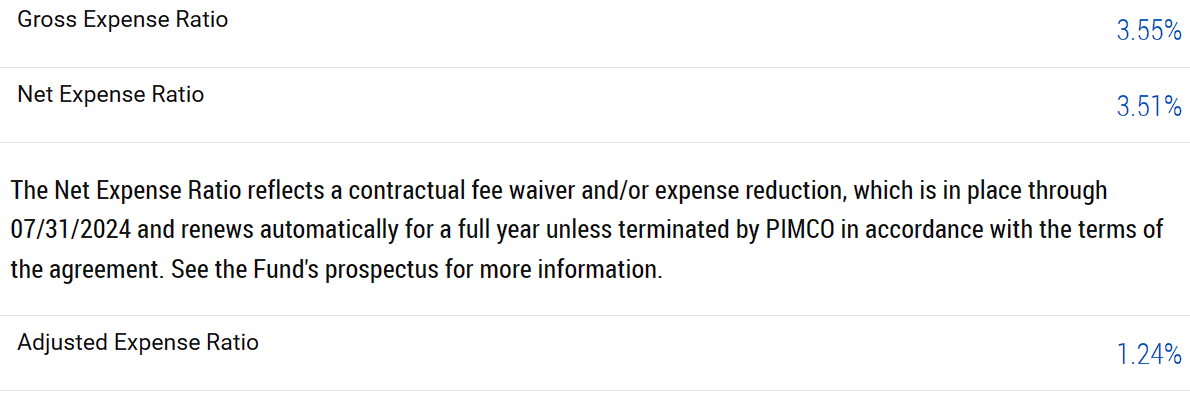
Exploring the All Asset All Authority Fund website provides some clues as to why it may underperform. The expense ratio, particularly the gross expense ratio of 3.55, is notably high. Even when adjusted to 1.24, it remains relatively elevated compared to some competing mutual funds. This higher expense ratio could be a contributing factor to its less favorable position on the risk-return compass. The cost of managing the fund might be impacting its overall performance and hindering its competitiveness compared to other investment options.
It's worth noting that some of the statistics provided by mutual fund companies may have a limited historical perspective, often extending only about three years. While a fund might appear successful within this timeframe, a more comprehensive analysis is crucial. In the recipe investing pages, we delve back 20 years and assess various risk-versus-return metrics, including M-squared, Alpha, and others. This extended historical analysis allows for a more thorough evaluation of a fund's performance across diverse market conditions and economic cycles.
This new analytical tool we've developed provides a comprehensive approach. We even include the degrees in our analysis. Imagine the 180 degrees as due south and 270 degrees as due west, we publish the degree to which the reference portfolio compares to the benchmark portfolio, situated at the center. While delving into specifics, this feature allows the investor to precisely determine the position of their research portfolio in relation to the benchmark using the colored icon. The accompanying number provides the degree or angle along the compass that represents the relationship between these two funds.

The PIMCO All Asset All Authority fund doesn't quite meet the criteria, and interestingly, there might be a couple of others facing a similar challenge. Take, for example, the Vanguard Star Inv (VGSTX) fund. Over the past 20 years and across all other periods, it has shown inferior performance in terms of both risk and return compared to a straightforward two-ETF benchmark fund. This likely suggests that fees may have hindered the fund's return, underscoring the impact of costs on overall performance.
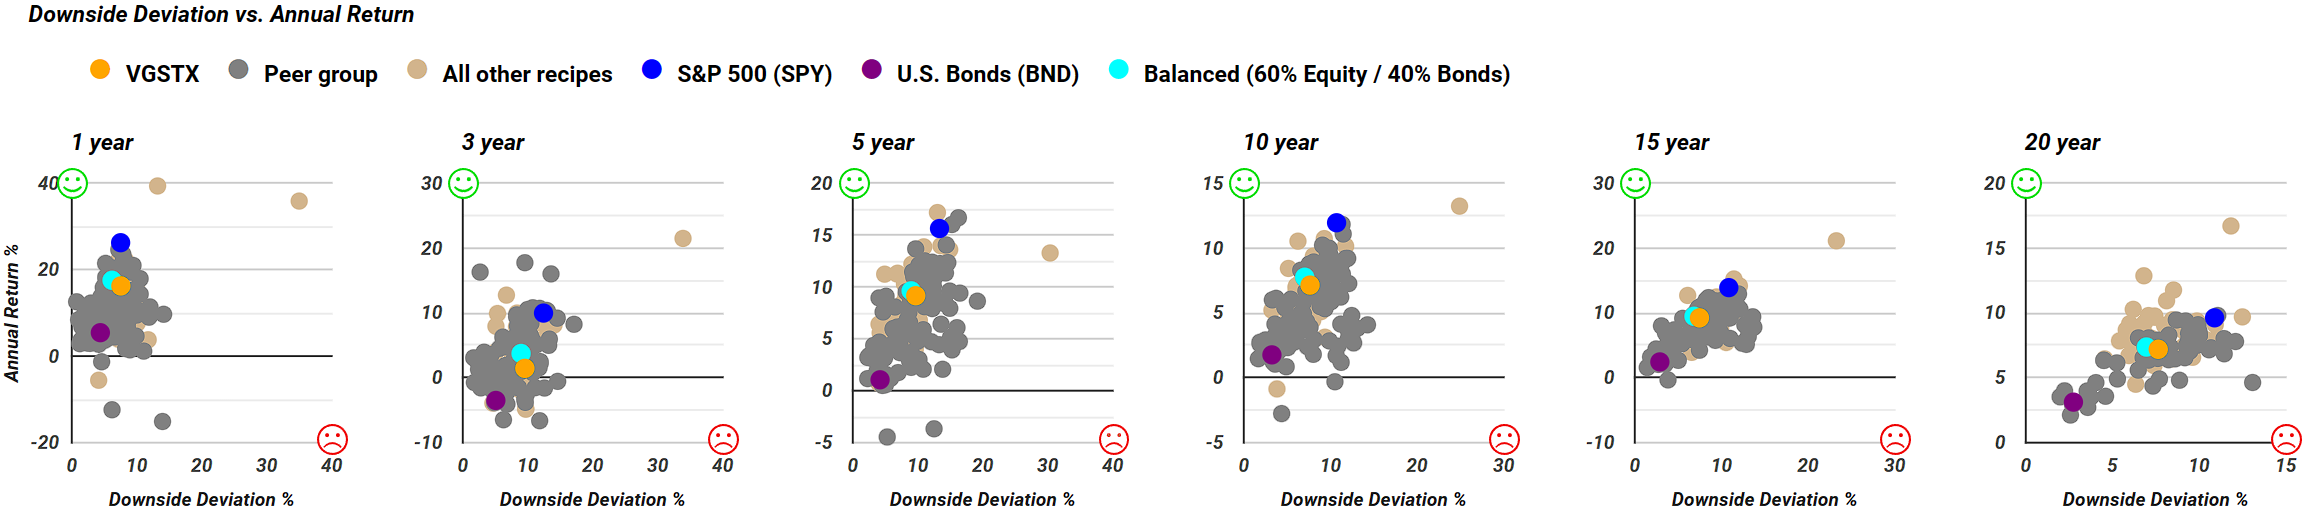
Certainly, the Vanguard Star Inv fund, represented by the orange color, closely mirrors the teal-colored 60/40 benchmark. Checking the downside deviation scatter plot, which serves as the basis for the risk-return compass icons, we observe that the Vanguard Star Inv is slightly worse in each instance. The consistent downward and rightward position of the reference portfolio across all time periods results in the red icon, indicating its comparatively poorer performance in terms of both risk and return.