Article-2023-11
November 2023 Recipe Investing - Commentary
Topics this month
- Country funds: Winners and Losers over the Past Month
- Minimizing Risk with Minimum CvaR and Minimum CdaR Portfolios (see 15-Year Returns)
- Top Recipes over the Long-Term (1 stock, 1 mutual fund, 3 tactical portfolios)
- The 80-20 Static Portfolio
Welcome to the November 2023 commentary from recipeinvesting.com. We track investable portfolio recipes that allow investors and advisors to build portfolios that minimize risk and maximize return. We reallocate and rebalance monthly, so we have plenty of new material to cover for our comparisons this month.
Country funds: Winners and Losers over the Past Month
Let's begin by examining the Portfolio Ingredients. We'll explore the performance of various ETFs for this month. It's important to note that these ETFs represent a diverse range of global asset classes, including global equities and various global sectors. These ETFs primarily serve as individual components or building blocks, distinct from the complete portfolios and strategies outlined in our portfolio recipes section, which incorporate different models and algorithms.
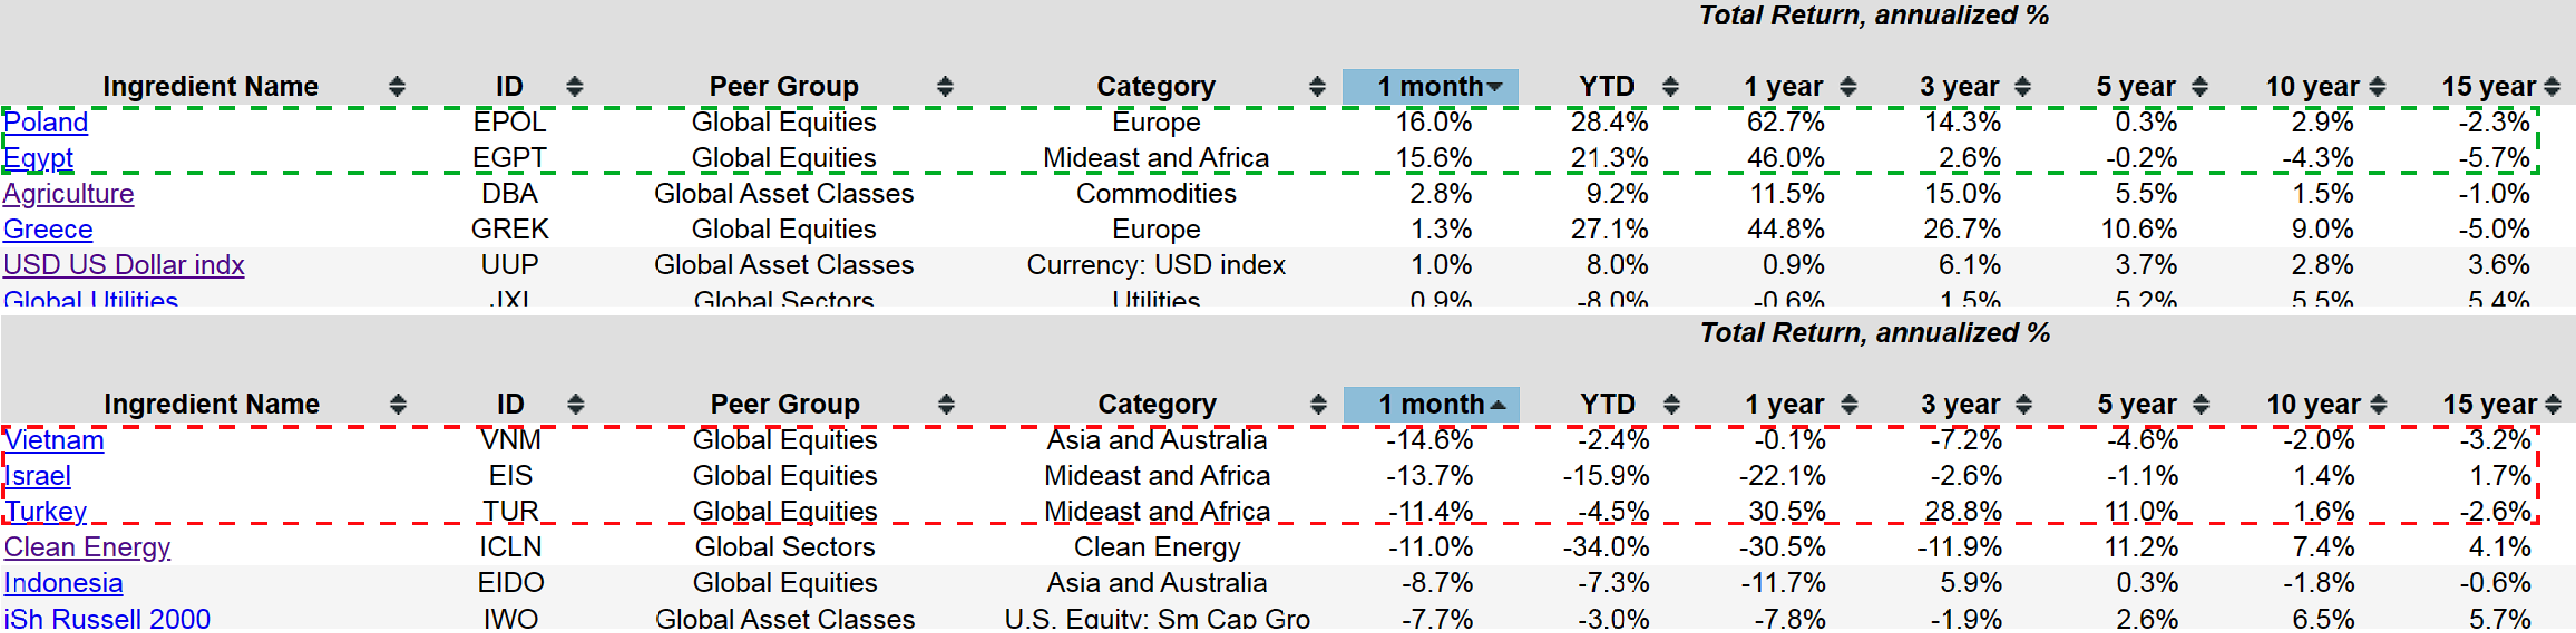
By selecting the appropriate header, we can analyze the underperforming assets for the past month. Notably, there have been certain country-focused funds that faced challenges during this period. Conversely, by selecting the header again, we can identify the monthly winners, which intriguingly include some country-specific funds with the highest one-month returns. However, a longer-term perspective reveals that these same funds have encountered difficulties over the past 15 years, resulting in annualized losses ranging from 2% to nearly 6%.
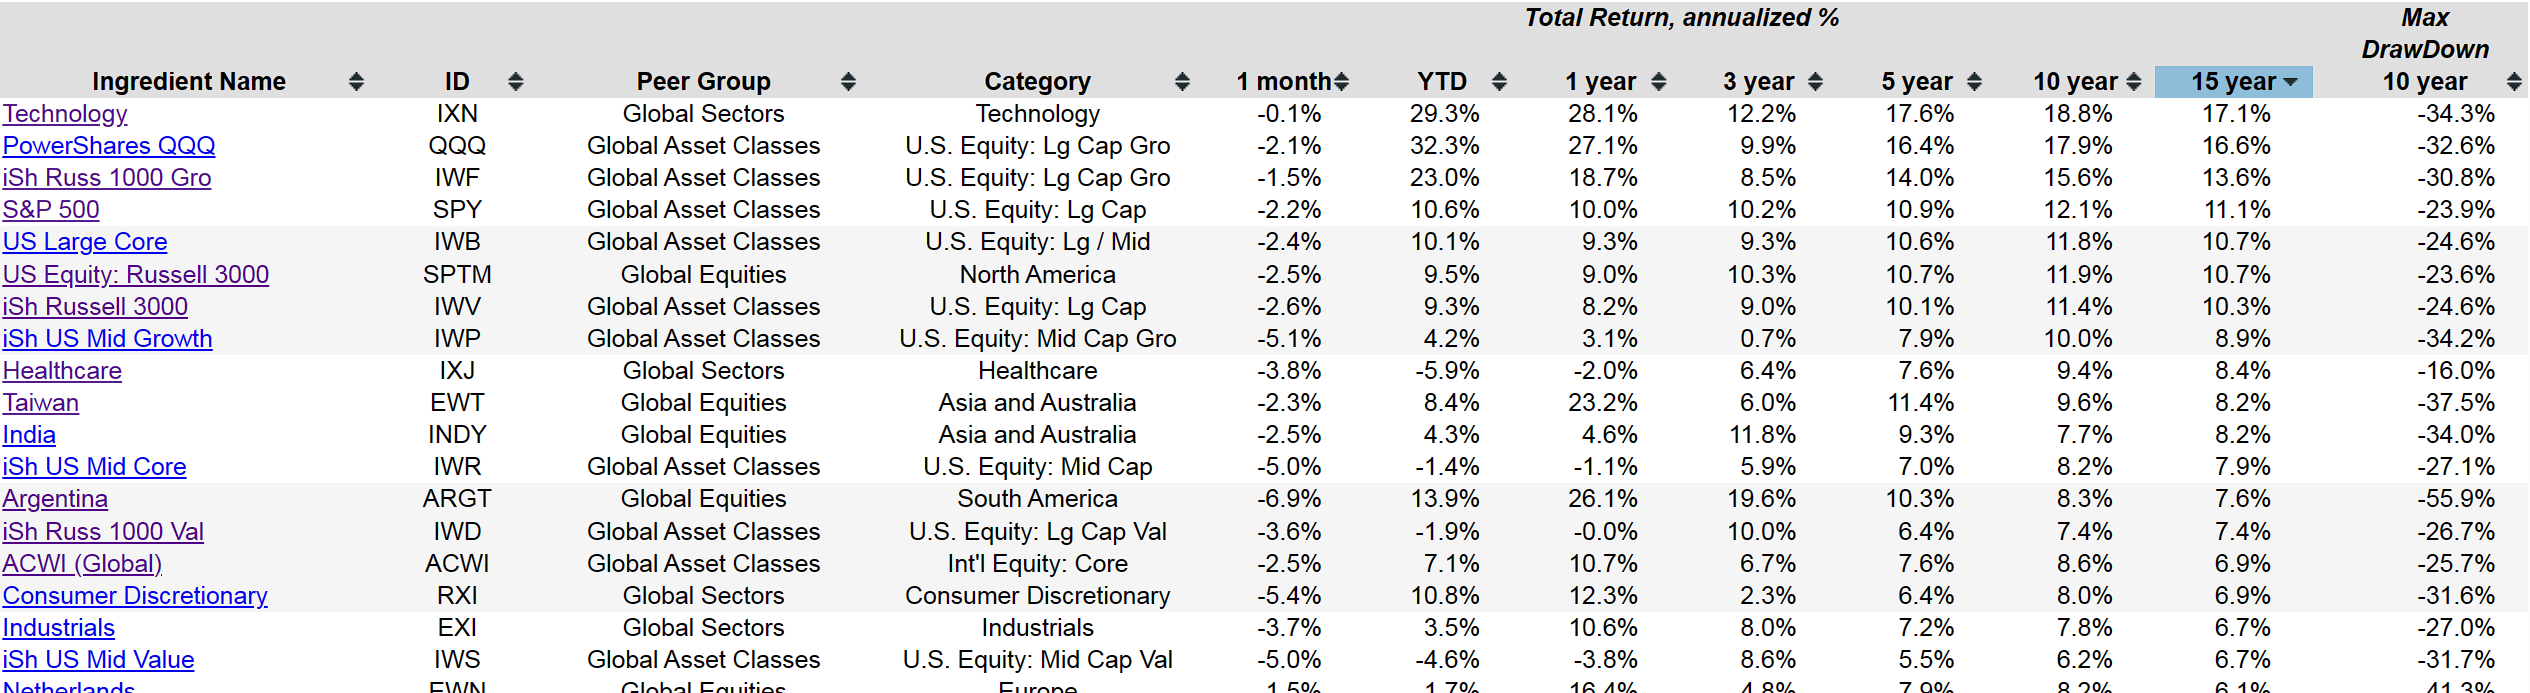
Perhaps, another way to look at this is to sort data by a 15-year timeframe and examine which assets have consistently performed well over this period. Notably, Technology (IXN), PowerShares (QQQ), and even the S&P 500 (SPY) have showed strong performance among various U.S. equities over the past 15 years. It's important to remember that significant declines have accompanied these gains. The data currently covers a 10-year period, and expanding it to 20 years would provide a deeper insight into events, including the 2008 financial crisis. This approach underscores the complexity of investment decisions, involving the trade-offs between risk and return, short-term and long-term considerations, and the need for a clear assessment of the investor's investment horizon. Multiple factors influence these choices, and it's clear that investment success cannot be reduced to short-term or 15-year performance alone. Therefore, a tool like this, which presents different returns and annualized returns in various columns, offers valuable insights, enabling the investors to compare different funds, even at the ingredient level.
Let's switch back to the portfolio recipes, which represent the combinations of mutual funds and exchange-traded funds incorporated into algorithms or model portfolios. These model portfolios can be categorized into three primary types. The first category, known as "Strategic DIY," follows a fixed allocation of exchange-traded funds or mutual funds, maintaining consistency from month to month. Although monthly rebalancing is performed to realign allocations with the predefined target, the core allocations themselves remain unchanged. In contrast, the second category is termed "Tactical DIY." In this approach, allocations shift every month, guided by a specific algorithm that remains constant. While the algorithm remains consistent month to month, it dictates the investments for the upcoming month, leading to changes in allocation. Tactical DIY can encompass various subcategories like adaptive momentum and risk-driven strategies, each employing distinct tactical asset allocation algorithms.
For the sake of comparison or investment evaluation, we introduce what we refer to as "Tactical Manage." This category encompasses more traditional active exchange-traded funds or mutual funds. In some instances, it may also include indexed exchange-traded funds that maintain a comprehensive perspective, possibly encompassing multiple asset classes. Some of these funds identify themselves as "global macro" or adopt strategies like long-short, risk-driven, or hedged approaches. We've specifically chosen mutual funds that offer a broad portfolio view of the world. These funds are typically classified as multi-asset mutual funds, capable of investing in equities, bonds, or both. Our intention is to provide these options for comparison against the static and tactical portfolios featured in our collection.
Minimizing Risk with Minimum CvaR and Minimum CdaR Portfolios
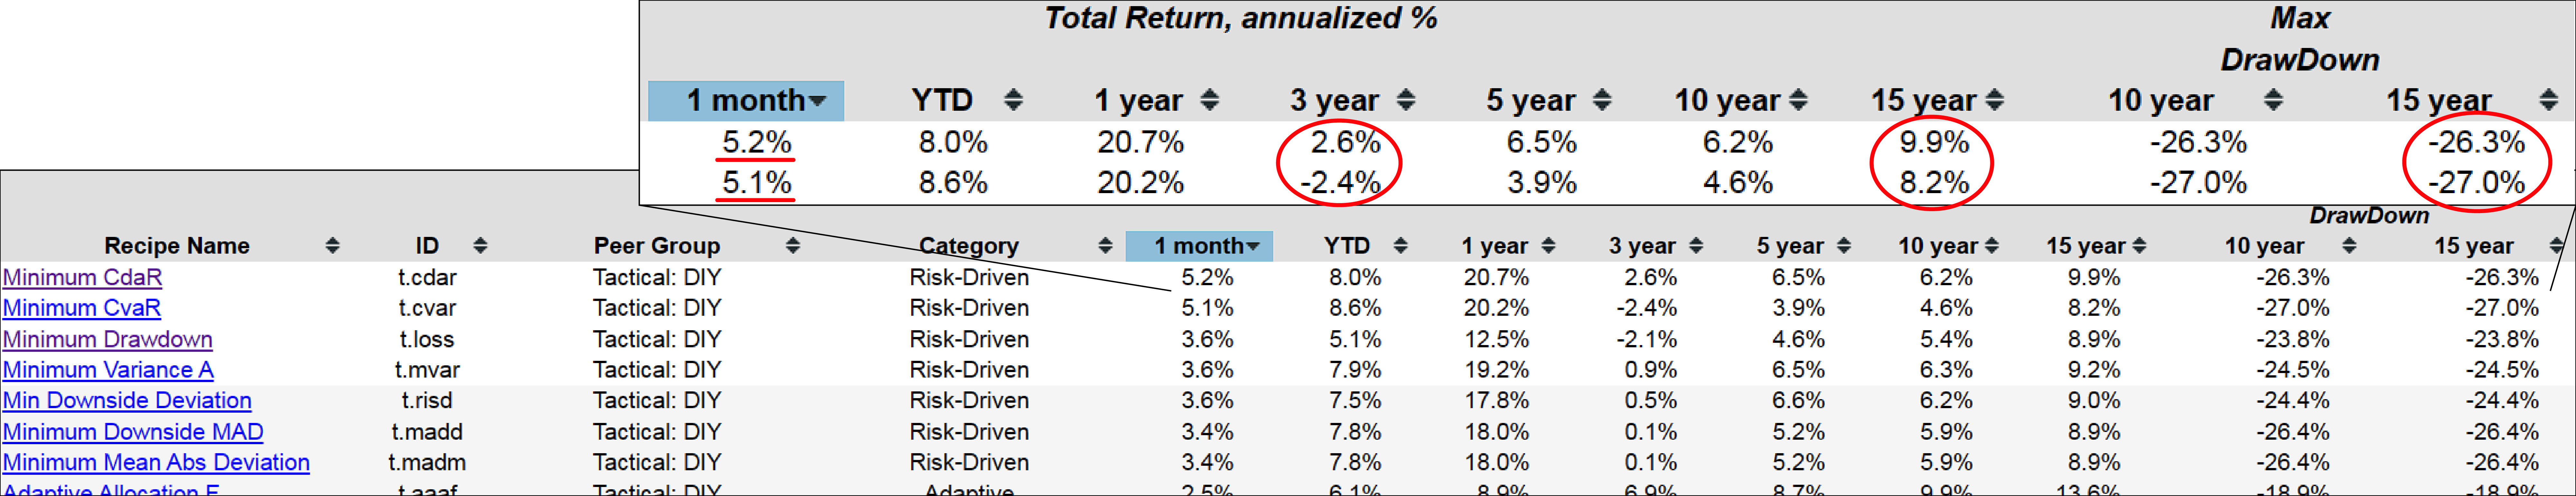
If we examine the performance over a one-month period, it quickly becomes clear that certain Tactical DIY (Do-It-Yourself) portfolios, specifically those driven by risk, have yielded positive results. This implies that the algorithm, at the end of the previous month, recommended a reallocation for the start of October, and this reallocation has outperformed other options in our list. Notably, portfolios like Minimum CvaR (t.cvar) and Minimum CdaR (t.cdar) have achieved gains exceeding 5% in the past month and have maintained solid performance over the past 15 years, with annualized returns reaching close to 10%. It's important to recognize that such returns come with a degree of risk, often accompanied by drawdowns.
Top Recipes over the Long-Term
The Berkshire Hathaway Inc Portfolio
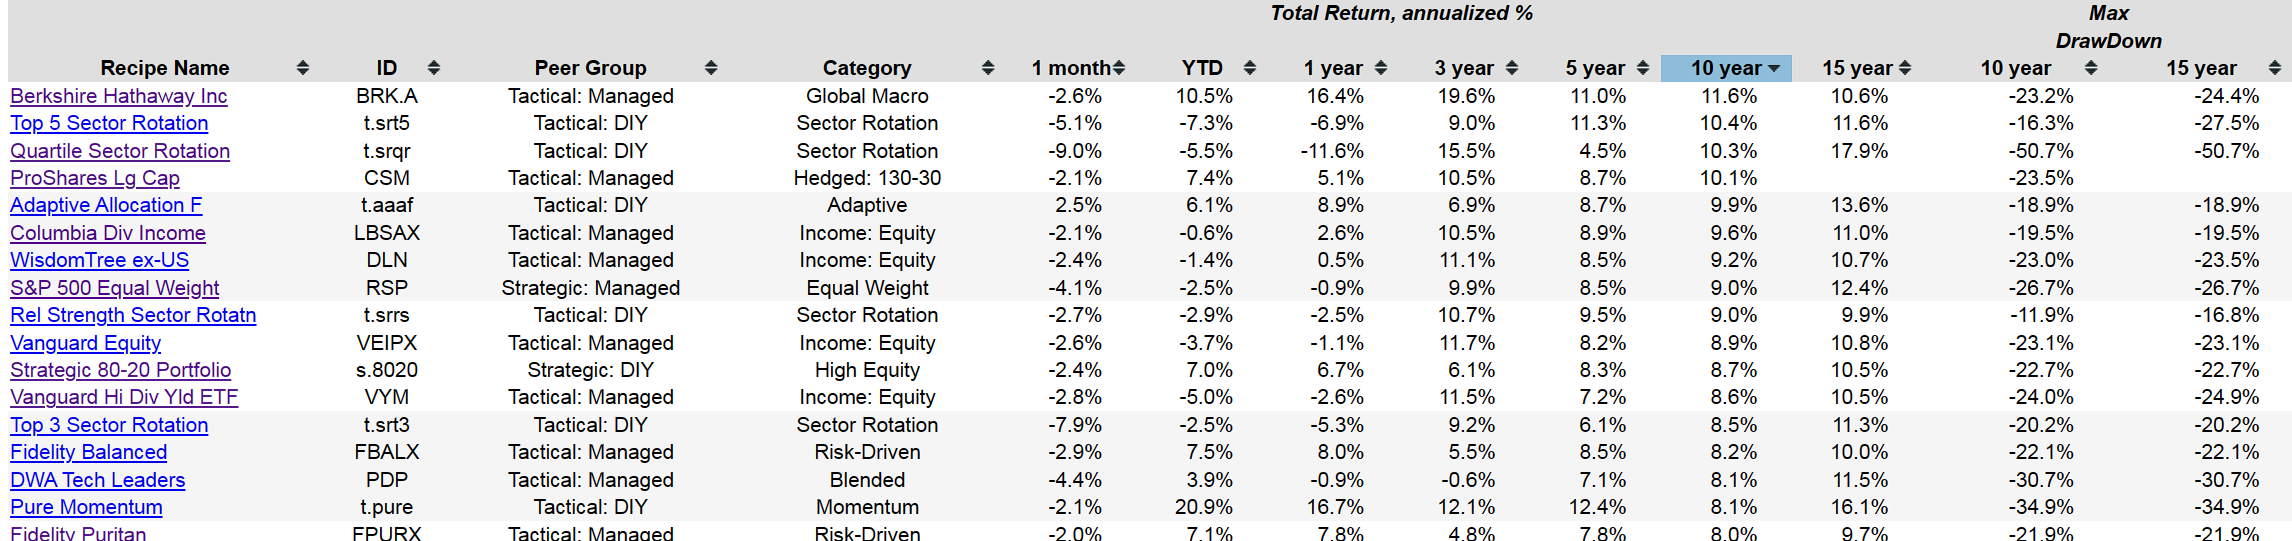
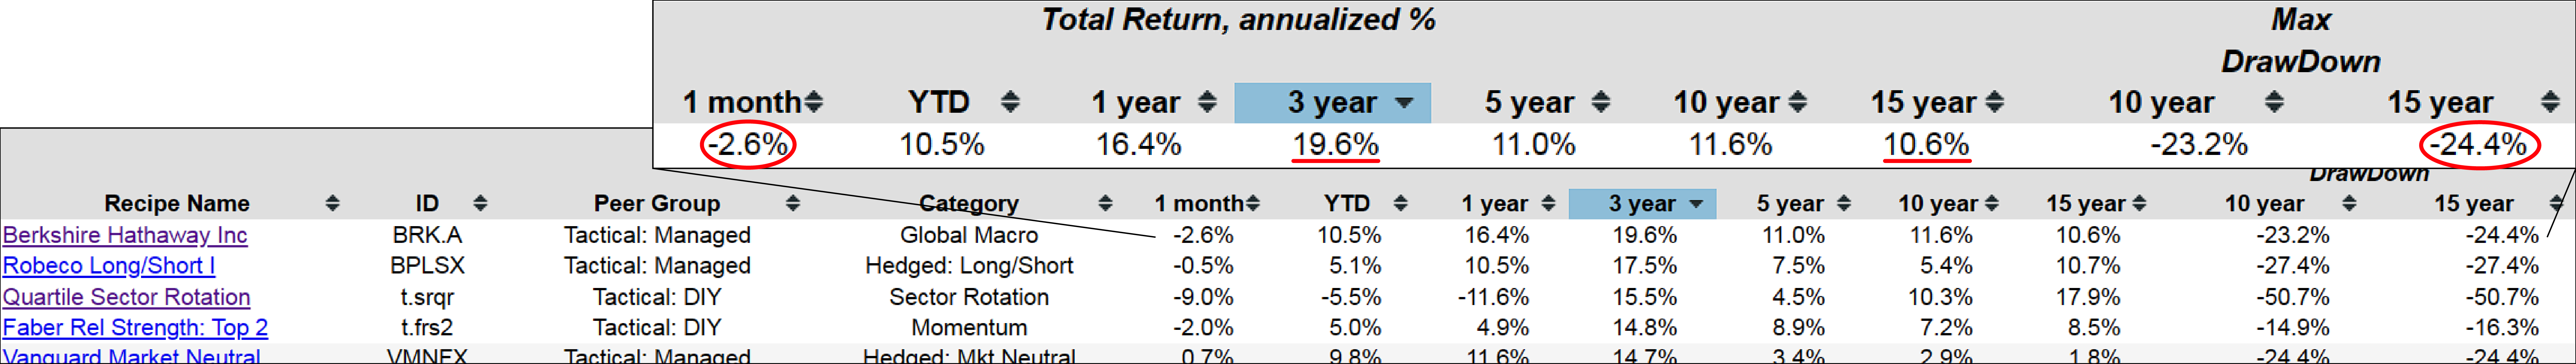
However, it's worth noting that some of these tactical asset allocation portfolios have faced challenges over the past three years. To gain a better understanding of this period, let's take a closer look at a three-year perspective. For instance, consider Berkshire Hathaway Inc (BRK.A), which, too, experienced periods of drawdown. It's important to emphasize that this drawdown would be more pronounced if we were to extend our analysis to a 20-year timeframe, a dimension we should consider adding to our evaluation.
Despite these temporary setbacks, Berkshire Hathaway's performance has been strong over the past 15 years. It has performed well over the past three years, albeit with some recent difficulties. We classify this investment approach as a form of "global macro" because of its investments across various sectors within its conglomerate, reflecting a diverse range of interests and holdings.
The Robeco Long/Short I Portfolio
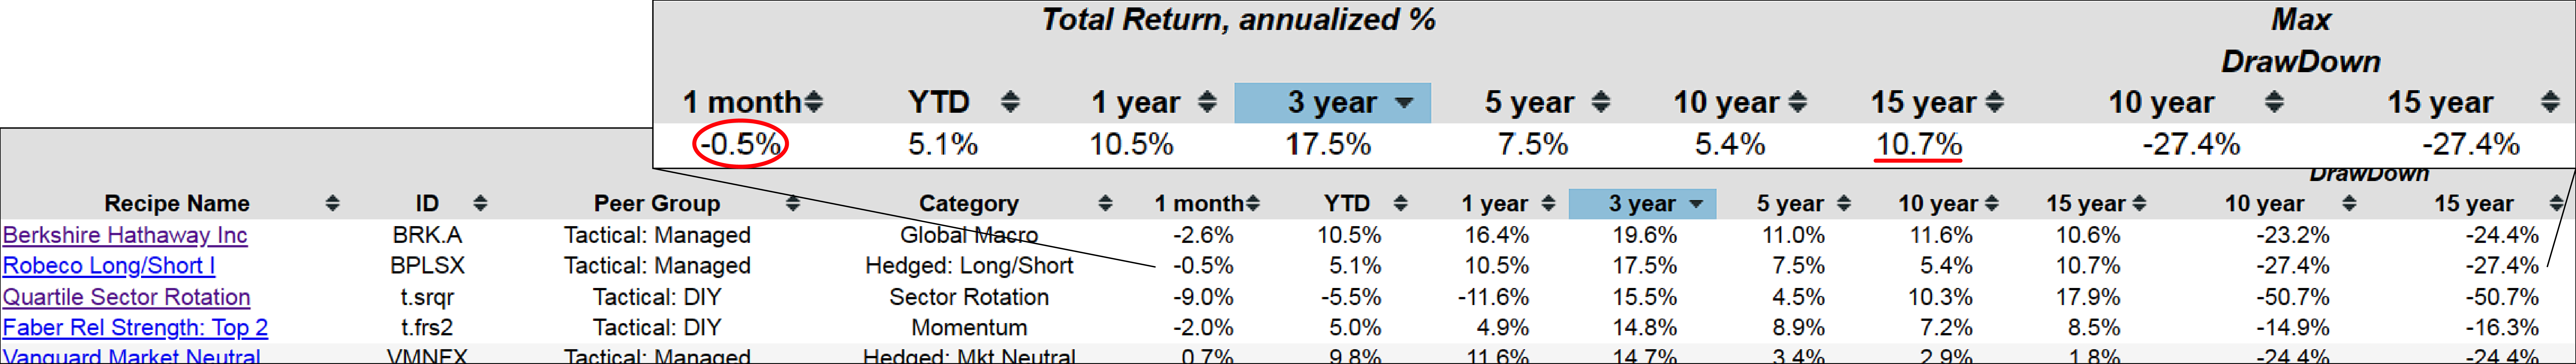
Robeco Long/Short I (BPLSX), which we've discussed in previous conversations, continues to perform impressively. It's important to note that this fund falls into the category of institutional class, meaning it's usually not accessible to retail investors. However, for the sake of comparison and analysis, it's indeed interesting to examine. Over the last 15 years, it has consistently delivered strong returns. It's worth mentioning that this fund comes with relatively higher management fees, but given its track record, it appears to be justifying its costs. Even in the most recent month, although there was a slight dip, its performance remains solid.
The Quartile Sector Rotation Portfolio

However, it's important to bear in mind that we must frequently switch between these columns and carefully assess the significance of short-term performance in comparison to long-term trends. When delving into the 15-year long-term performance, we encounter Quartile Sector Rotation (t.srqr), which employs a highly concentrated algorithm. This approach typically invests in a single mutual fund each month, with the selection based on the top quartiles of various sectors. Over the past 15 years, Quartile Sector Rotation has demonstrated exceptional performance. However, it has faced notable challenges in the past month and even over the course of the last year. This highlights the need to consider not only long-term success but also short-term fluctuations when evaluating these investment strategies.
The Pure Momentum Portfolio
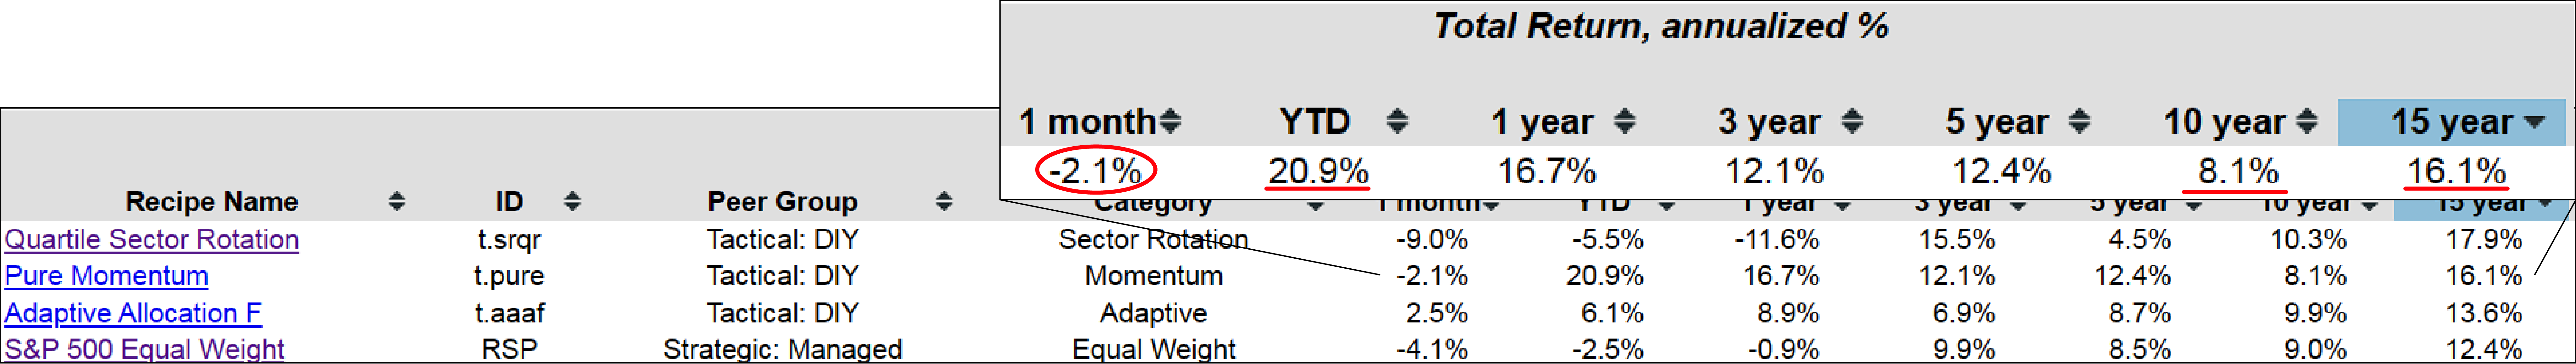
As is often the case with investments, the key consideration is the delicate balance between risk and return. It's essential to understand that not all investments will consistently exhibit exceptional gains both year-to-date and over a 15-year period. However, with the assistance of this analytical tool and the scatterplots, we can better grasp the trade-offs between risk and return. Take, for example, Pure Momentum (t.pure), which has shown substantial growth over the past decade. Over a 15-year span, it has performed admirably and has continued to deliver strong results year-to-date. Although it experienced a slight dip in the past month, when compared to some other investments during the same period, this performance is actually quite favorable.
The Adaptive Allocation F Portfolio
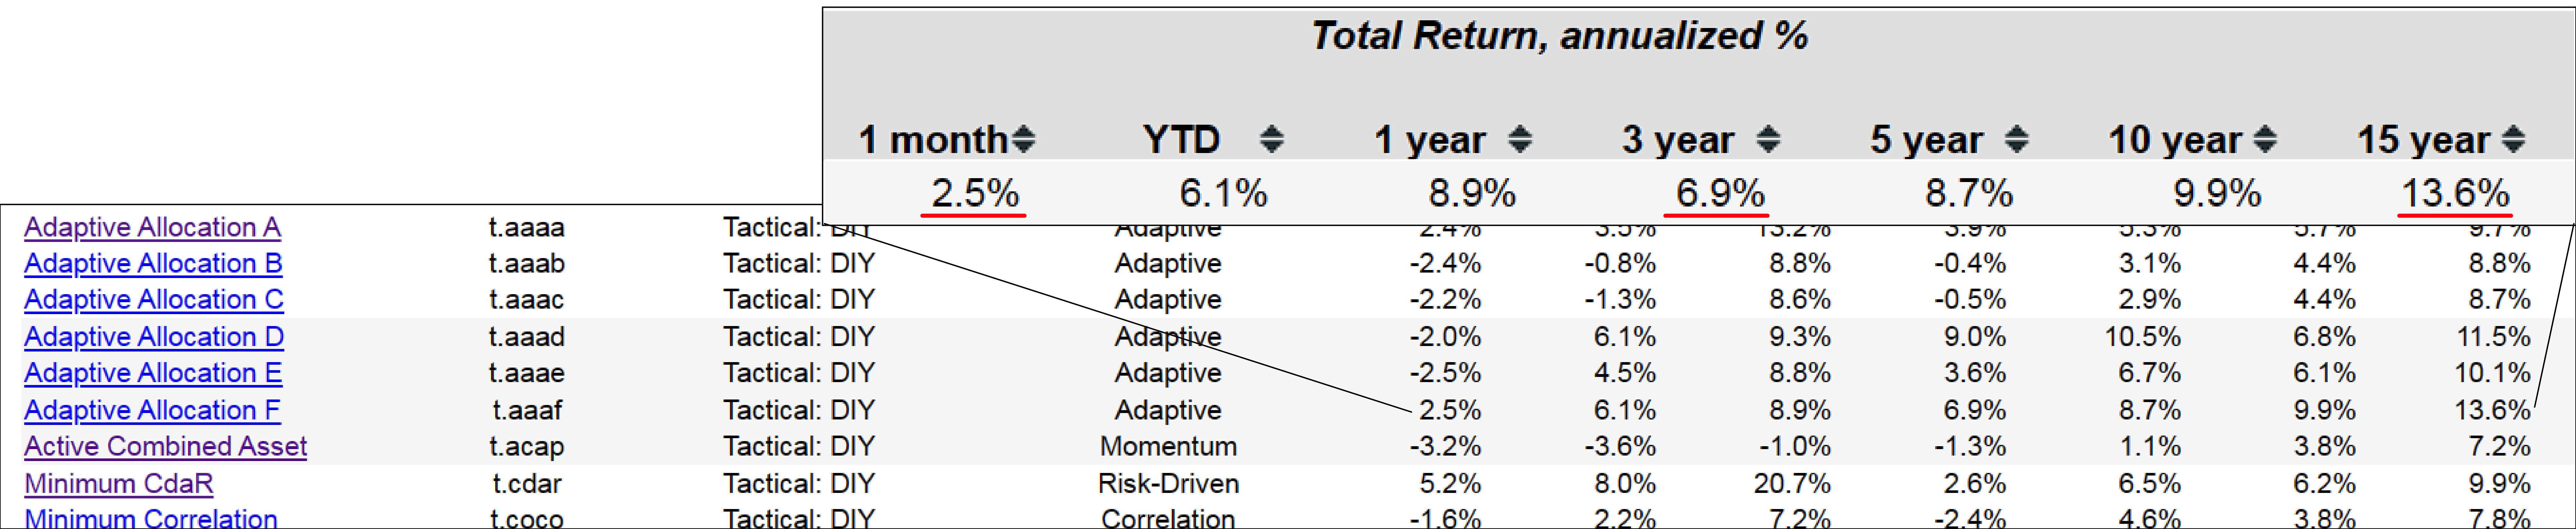
Examining peer groups can offer valuable insights, allowing us to move beyond the scope of tactical managed portfolios. Let's turn our attention to how Tactical DIY portfolios have fared as a category. For instance, consider Adaptive Allocation F (t.aaaf), which has delivered an annualized return of 13.6% over the last 15 years. Moreover, it exhibited a positive performance of two and a half percent in the most recent month, showing signs of a recovery.
It's worth noting that this portfolio faced some challenges over the past three years and didn't perform as strongly as certain counterparts within this timeframe. However, if the investor can tolerate a slight softness in its three-year performance, it has demonstrated robust performance over the past 15 years. Additionally, it appears to be making a strong comeback in the most recent month. This highlights the importance of adopting a longer-term perspective when evaluating these portfolios, as not every portfolio will consistently meet the investors expectations on a month-to-month basis.
The 80-20 Static Portfolio
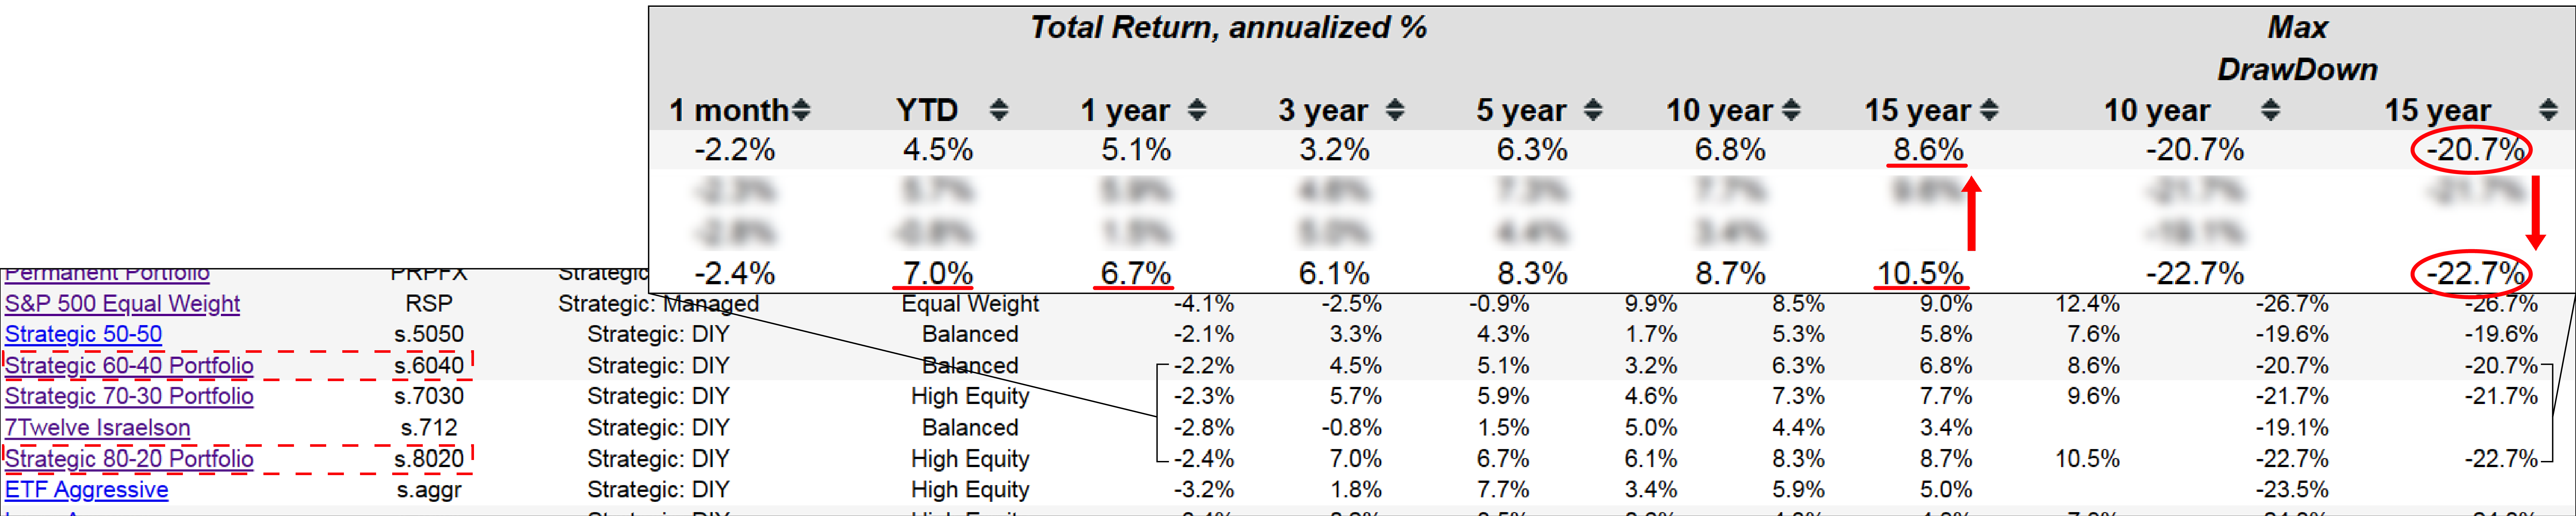
Now, turning our focus to static portfolios, particularly what we might refer to as Strategic DIY portfolios. In these portfolios, we employ a straightforward approach by blending two exchange-traded funds in ratios like 50-50, 60-40, or 70-30. This combination creates a well-balanced fund comprising a broad-based equity and a broad-based bond. Notably, let's take a closer look at the Strategic 80-20 Portfolio (s.8020), which has delivered an annualized return of 10.5% over the past 15 years. It has only experienced a modest decline of 2.4% in the most recent month, which is understandable given the challenging market conditions. Year-to-date, it has shown a robust performance, with a 7% increase, and it remains up by 6.7% over the last year. It's important to recognize that the drawdown for this portfolio appears relatively low. However, it's crucial to keep in mind that this evaluation encompasses the last 15 years and doesn't include the events of 2008. If we were to extend the analysis to a 20-year timeframe, we would likely observe a higher drawdown. Nevertheless, the Strategic 80-20 Portfolio remains an intriguing and straightforward strategic portfolio with an 80-20 allocation. The 60-40 allocation is also well-regarded and often considered a classic balanced portfolio. As we delve into this category, we observe a slightly lower level of risk, but this comes at the cost of slightly reduced returns. Effectively, the numbers across the board show declines, reflecting the current market conditions. This illustrates the trade-off between risk and return in the context of the classic Strategic 60-40 Portfolio (s.6040).
The Vanguard & JPMorgan Market Neutral Portfolio
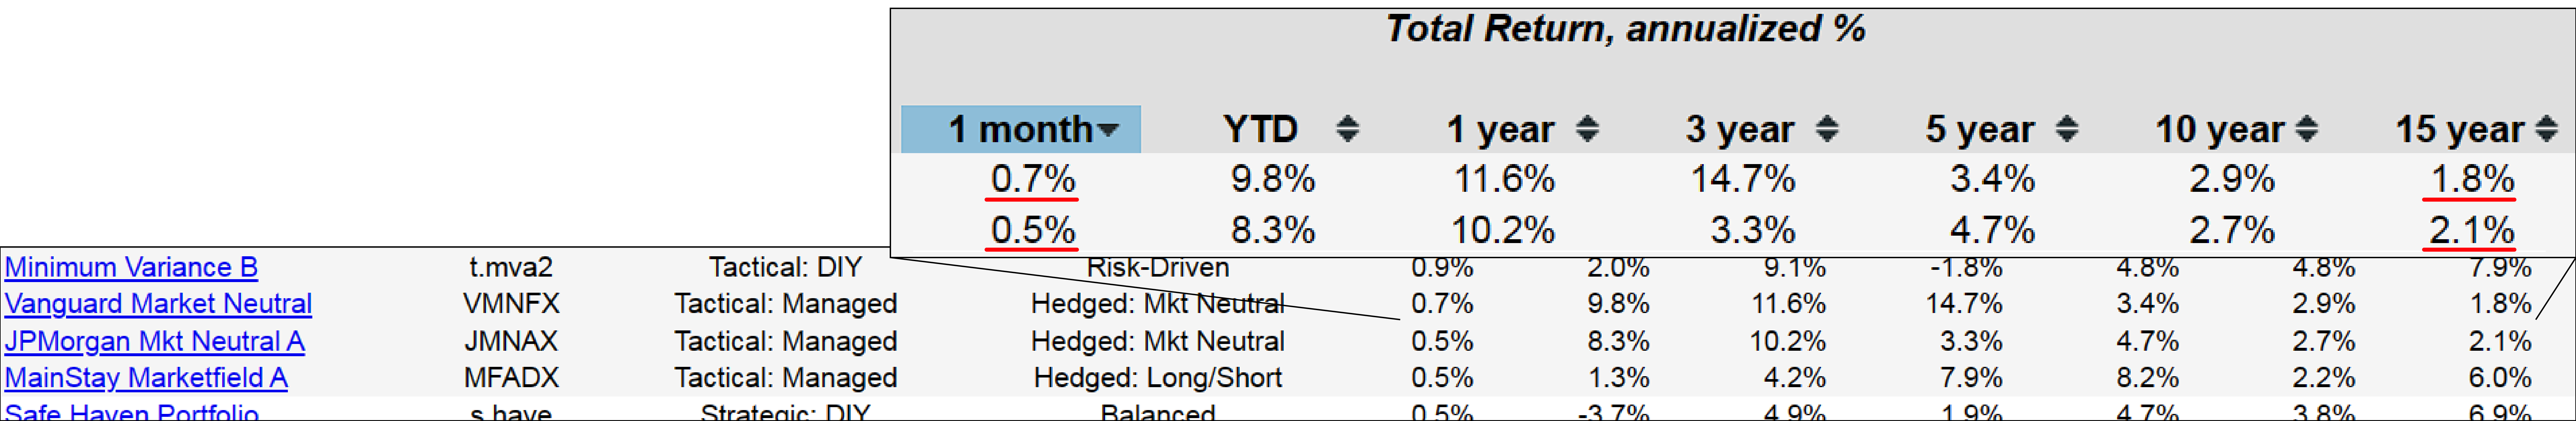
It's evident that this hasn't been a particularly favorable month for most investments, as we observe a prevalence of negative returns in the one-month performance. There are only a handful of exceptions, with some of the tactical managed portfolios demonstrating positive results. Notably, Vanguard Market Neutral (VMNFX) and JPMorgan Mkt Neutral A (JMNAX) are among those managing to deliver positive returns this month. However, when we shift our focus to the longer-term perspective, it becomes clear that despite being labeled as "market neutral," these portfolios haven't significantly contributed to our gains. Their annualized returns stand at a meager 2.9% or approximately 2% over the past 15 years. While they may maintain a relatively flat or slightly positive performance during market downturns, it appears that they may not offer substantial long-term benefits, at least based on historical data.
In summary, this provides an overview of the components and strategies for the current month, which has been marked by a general downturn in performance. However, amid the challenges, there have been some notable positive aspects. It's important to maintain a long-term perspective, as many of these investments have demonstrated consistent strength over extended periods, spanning five years, ten years, and beyond, despite facing temporary setbacks in the recent month.