Article-2023-06
June 2023 Recipe Investing - Commentary
Topics this month
- Reviewing the Top ETF Ingredients
- Comparing Max Sharpe and Max Sortino: two related recipe algorithms
- Finding "Set it and Forget it" Portfolio Recipes
- Using the Spreadsheet download for analysis
- Filtering for High-return Strategic DIY Portfolio Recipes
- Filtering for High-return Strategic Managed Portfolios
- Filtering for High-return Tactical Managed Portfolios
Welcome to the June 2023 commentary from recipeinvesting.com. We track investible portfolio recipes that allow investors and advisors to build portfolios that minimize risk and maximize return. We reallocate and rebalance monthly, so we have plenty of new material to cover for our comparisons this month.
Top ETF Ingredients
Let's start by examining the components of the portfolio and explore the recent performance of various underlying exchange-traded funds (ETFs) that represent specific global asset classes, sectors, equities, and more. If we sort it by one month, we can see who's been leading by this month.
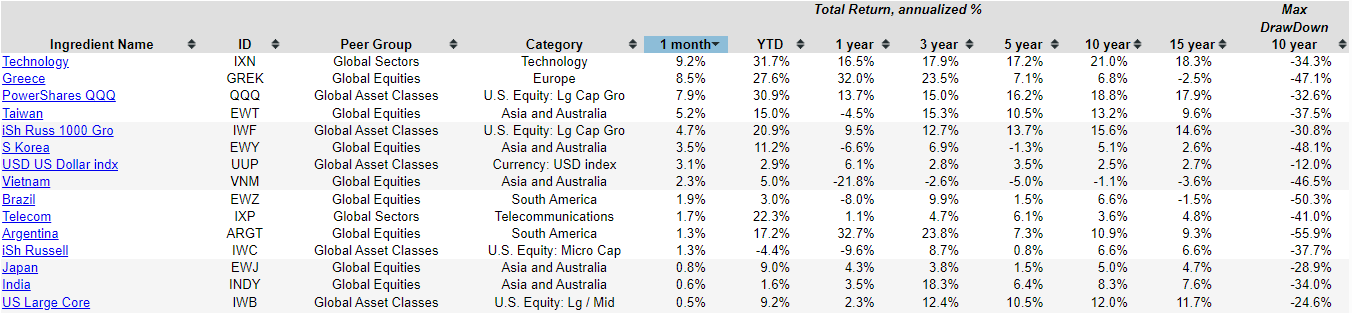
Technology has actually been doing well. We have observed various country funds, and it's important to note that our analysis currently focuses on a 10-year drawdown. However, it would be more accurate to include a 15-year column, as this might result in a drawdown of 50% or even more. Although technology has done phenomenally well, and this is annualized return over the past 15 years, you have to understand that it comes with some risk of drawdown also.
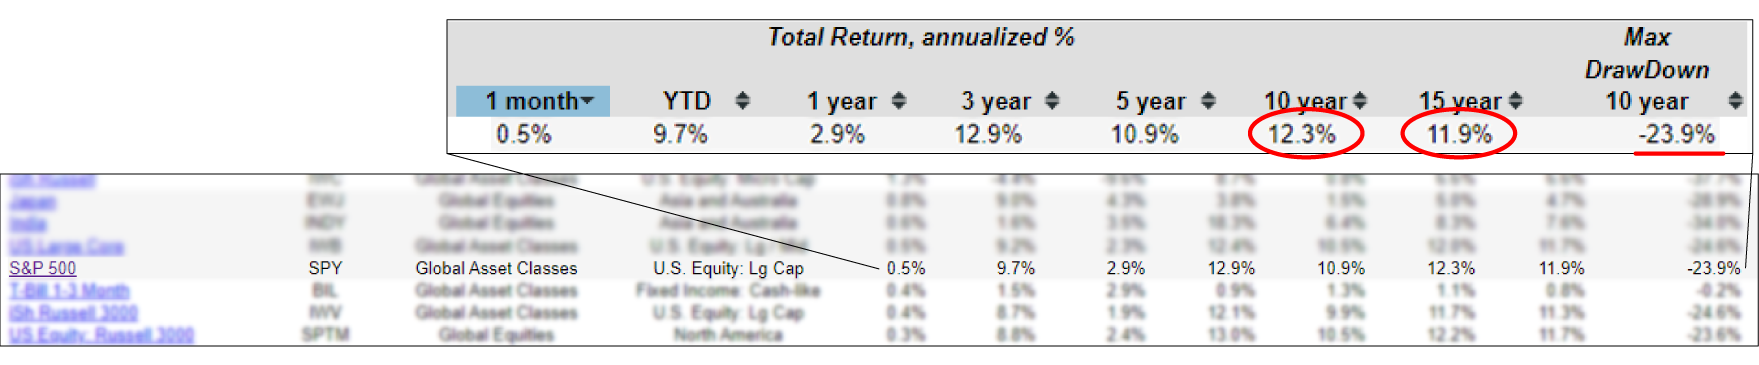
If you want to get a sense of what's going on with SPY, which is a great benchmark for S&P 500. So there we have it as 11.9% annualized return, 12.3% annualized return over the past 10 years. But you'd have to be willing to deal with a -23.9% drawdown on that and it's important to look at all of the risk measures and not just some of these really great 15-year total return measures, because some of these can be good, but the risk can be high. Or you can see maybe it's been doing okay for the past 15 years, but it's really been hammered hard the last couple of years. You just have to decide how you want to make that risk versus return trade off.
And one approach that we're a big fan of is, instead of sort of betting the farm on these individual sector or country exchange-traded funds, a wiser approach, is to diversify and develop a portfolio recipe that would then be a collection of different ETFs or mutual funds arranged according to some sort of an algorithm or a plan that we then review and look at each month. If we switch over to the portfolio recipes, each of these either has a ticker, from the fund manager, if it's a mutual fund or exchange-traded fund, or it'll have a prefixed T-dot, if it's a “tactical” allocation that's rebalanced and reallocated every month, or some of these, we have S-dot, which means that it's a “static” allocation and we rebalance monthly, but we don't change the overall percentage applications for the recipe.
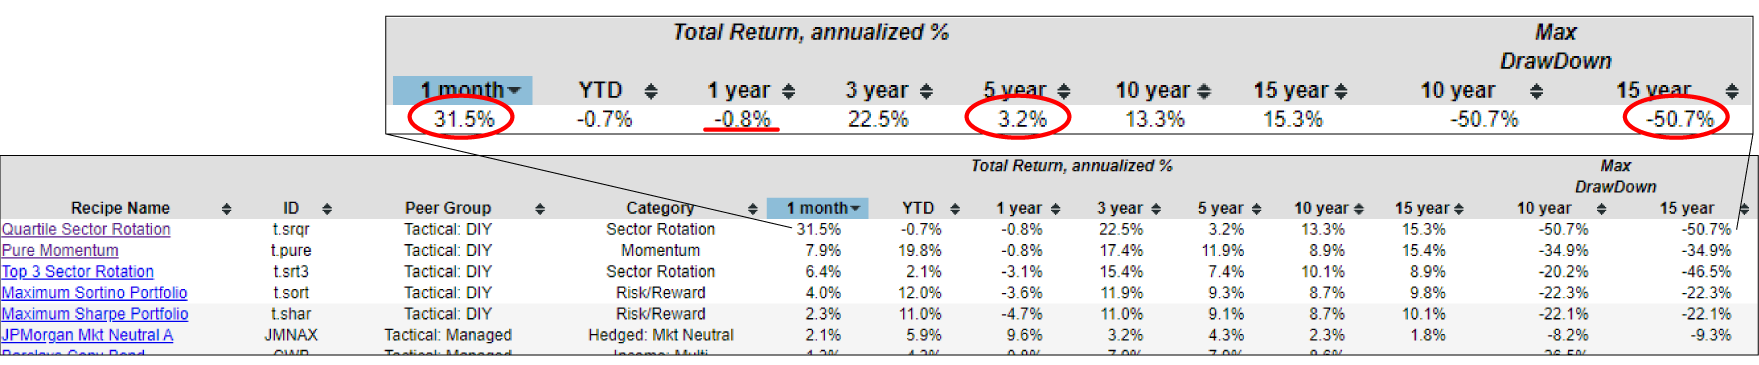
Let's sort by one month and see what we can find. So incredibly, the Quartile Sector Rotation (t.srqr) has done 31.5% in just this one month, which is great. But keep in mind, over the past year, it's been down to -0.8%, and over the past 15 years, it's been down -50.7%. And not to mention here, it's kind of had a rough patch over the past 5 years, it's been 3.2% annualized. So if you got caught in the middle (5-year) and needed the money, it really kind of would've let you down compared to the amount of risk that you're taking on. But, it is a pretty strong performing recipe this month.
Max Sharpe and Max Sortino: two related recipe algorithms
We continue to see some of the other popular T-dot or tactical funds that have done well. And here's Maximum Sortino Portfolio (t.sort) that's done 4% over the past month, and interestingly has done nearly 10% annualized over the last 15 years with just 22% drawdown.
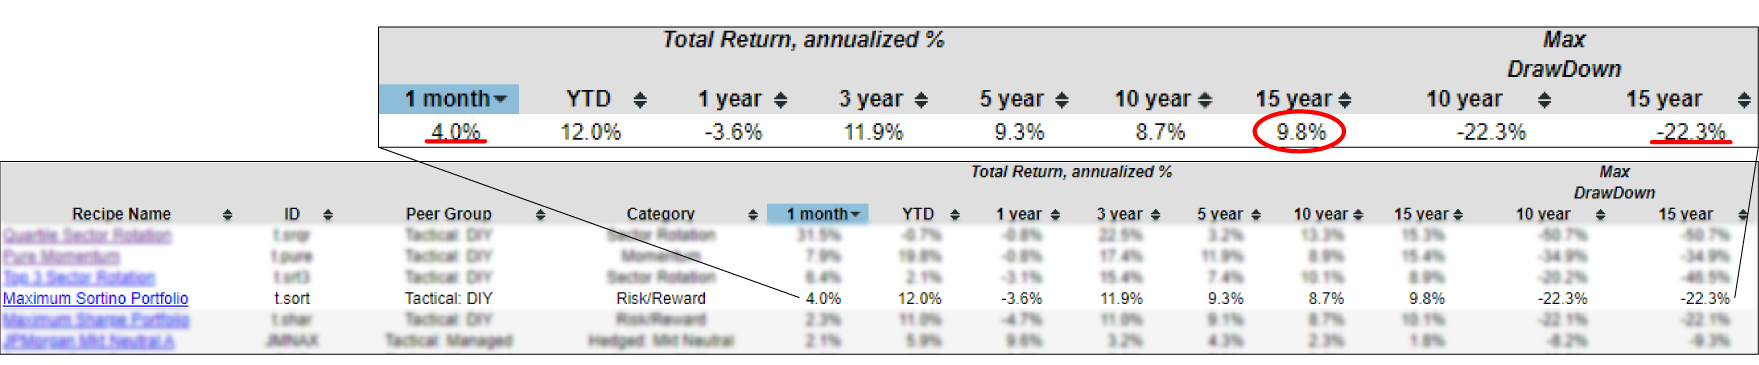
And that is t.sort, and that's using an algorithm that maximizes the Sortino Ratio of the portfolio. And the Sortino Ratio is how much return am I getting per unit of risk as measured by the downside deviation. And then Maximum Sharpe Portfolio (t.shar) is a sort of a cousin that's going to measure risk based on standard deviation. Downside deviation only looks at the downside risk and standard deviation looks at both upside variation and downside variation. And with that, Sortino Ratio makes a little bit more sense because you're just evaluating risk based on the bad events, namely the returns going down rather than Sharpe Ratio, which measures up and down.
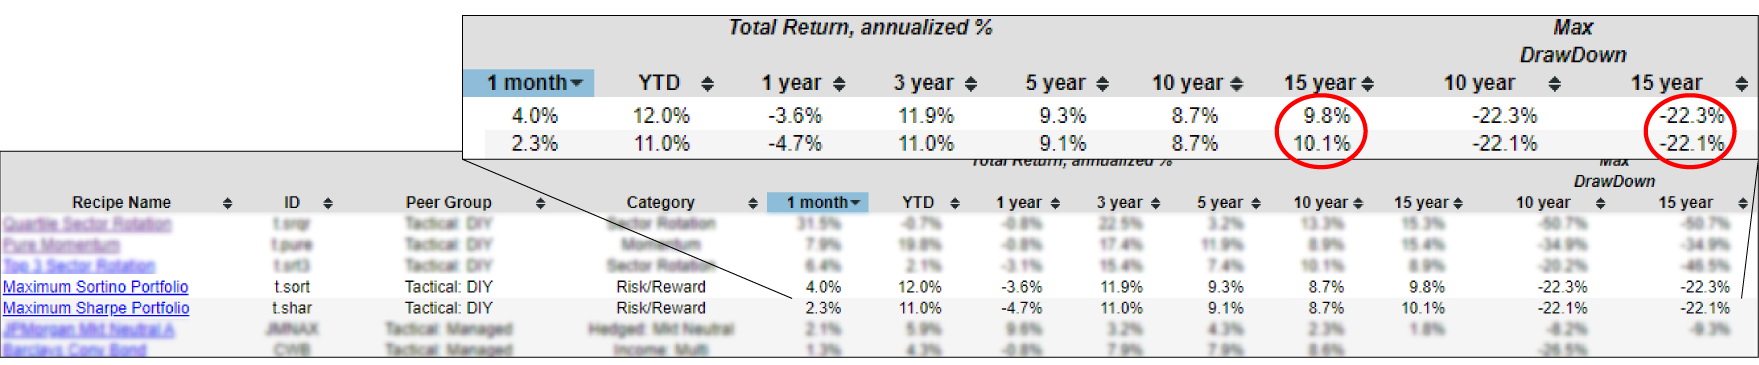
And as it turns out, Maximum Sortino Portfolio and Maximum Sharpe Portfolio have done similarly over the last 15 years with actually the Sharpe Ratio slightly beating out the Sortino Ratio. And both of them have about -22% drawdown over the last 15 years. And that's the maximum peak to trough measured at month end at some point over the past 15 years. At some point there's been a peak to trough of -22% drawdown for those two. But those are two of several popular tactical DIY (do-it-yourself) portfolios that rebalance every month. Some of these adaptive allocation portfolio recipes have also done well over the long term.
The "Set it and Forget it" Portfolio Recipes
We also had a question from last week or so. It was sent to [email protected], which you're welcome to send questions or comments to that address, and they'll come straight to us. And here is the question:

This subscriber has already invested using one of the tactical portfolio recipes, but then for another account wants something a little more simple. “I want something that is more simple so that I can set and forget…”, which by the way, reminds me of “Ron Popeil Set It and Forget It”. With a rotisserie cooker. You put it in, you turn it on, and you get something out delicious later without even having to mess with it. In that same way, I'd like a portfolio recipe that's set and forget, just like Ron would say, “Should I try Permanent Plus (s.plus)?” That's kind of our own internal ticker, or “Perhaps the Strategic 80-20 Portfolio (s.8020)?” This brings up a question of “If we want a Set It and Forget It portfolio, namely a static or strategic portfolio, how can we begin to evaluate those?” And we have the tools online, which we call the Recipe Summary Page, and it's very easy to click and sort by peer group. And we have the strategic DIY portfolios, which means these are all the ones that the underlying allocation is not going to change, but we will rebalance at the end of every month.
For example, here's the Ben Graham 50-50 (s.grah), it's 50% equity, but it's spread across several different exchange-traded funds. This allocation is not going to change, but every month we will match it up to this allocation across these seven different exchange-traded funds.
The advantage is that you can easily adjust the balance on a monthly, quarterly, or even annual basis. This approach impacts your returns when compared to other methods since we rebalance monthly. However, it requires less effort because you're mainly selling a small portion of one investment and purchasing another. Alternatively, if you're regularly contributing funds, you can simply add cash and realign the allocations to match the desired target.
High-return Strategic DIY Portfolio Recipes
Let's look at this idea of S-dot or strategic DIY portfolio recipes. And then while we're at it, we will look at a couple other categories. One is called strategic managed, and by managed, we mean this is a professionally managed exchange-traded fund, or mutual fund. There's only two of those. These could almost be considered tactical managed, but because they're designed to track a relatively slow moving nearly static portfolio, we call this strategic manager. There's only two of those in our list here.
And there are quite a few tactical managed funds and exchange-traded funds. And this could be in the “Set It and Forget It” category, even though it's tactical. And there's a manager behind the scenes charging you, who knows, 50-150 basis points for the privilege of handling all of the rebalancing and reallocation and algorithmic analysis to make all of these managed funds work. But these could be “Set It and Forget It” if you're willing to realize that you're paying for the privilege of someone else to manage that for you.
A popular technique that we can use is the scatter plots, and this is a really easy way to use. The S&P 500 (SPY), represented by the dark blue dot, U.S. Bonds (BND) being the purple dot, and then in the middle is a Strategic 60-40 Portfolio (s.6040), 60% of stocks and 40% bonds, which is represented by the teal dot.
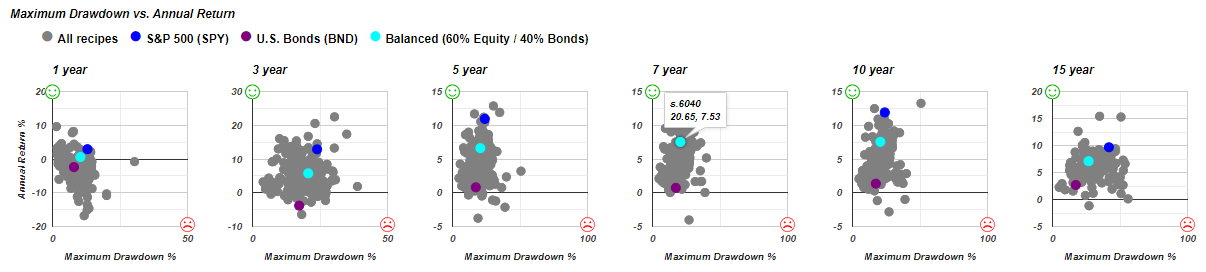
This is an easy way to mouse over and see the different tickers that appear. And what I like about the 60-40 is that it's balanced and it's kind of a little bit challenging sometimes to find something that's higher risk and lower return than 60-40. That's kind of one cut that you can use to begin to mouse over some of the scatter plots and see which are going to be the most interesting.
Also, something to note is if you click on any of the portfolios (for this example the Strategic 70-30 Portfolio) on the recipe summary page, you can see the Strategic 70-30 Portfolio is the orange dot, the Balanced 60-40 recipe is the teal dot, and we can also have other recipes in the scatter plots too. Now what's interesting here is that we have peer group recipes.
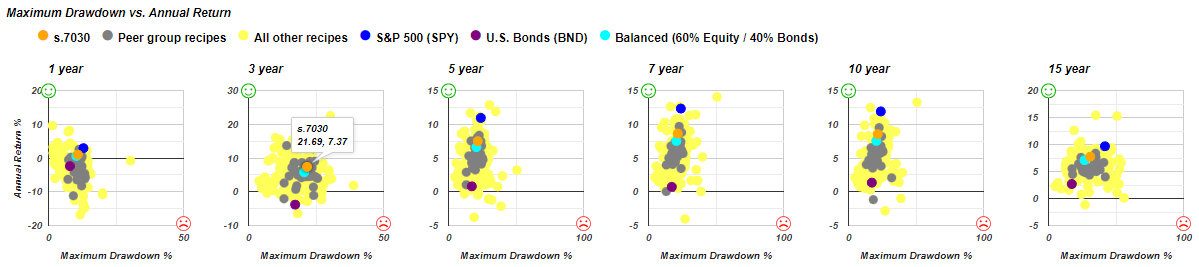
And all of the gray dots on the scatter plot graph are going to be in the peer group, by which we mean the static portfolios or the S-dots.Within the peer group, the predominant category is strategic DIY. But if you want to just compare all of the strategic portfolio recipes in the scatter plot, the way to do that is to go into one of the recipe names, and you'll see the gray dots are going to be all of the S-dot or strategic portfolio recipes. You can see it's a little bit of a tough game here to find a strategic portfolio recipe that is above and to the left of the teal dot.
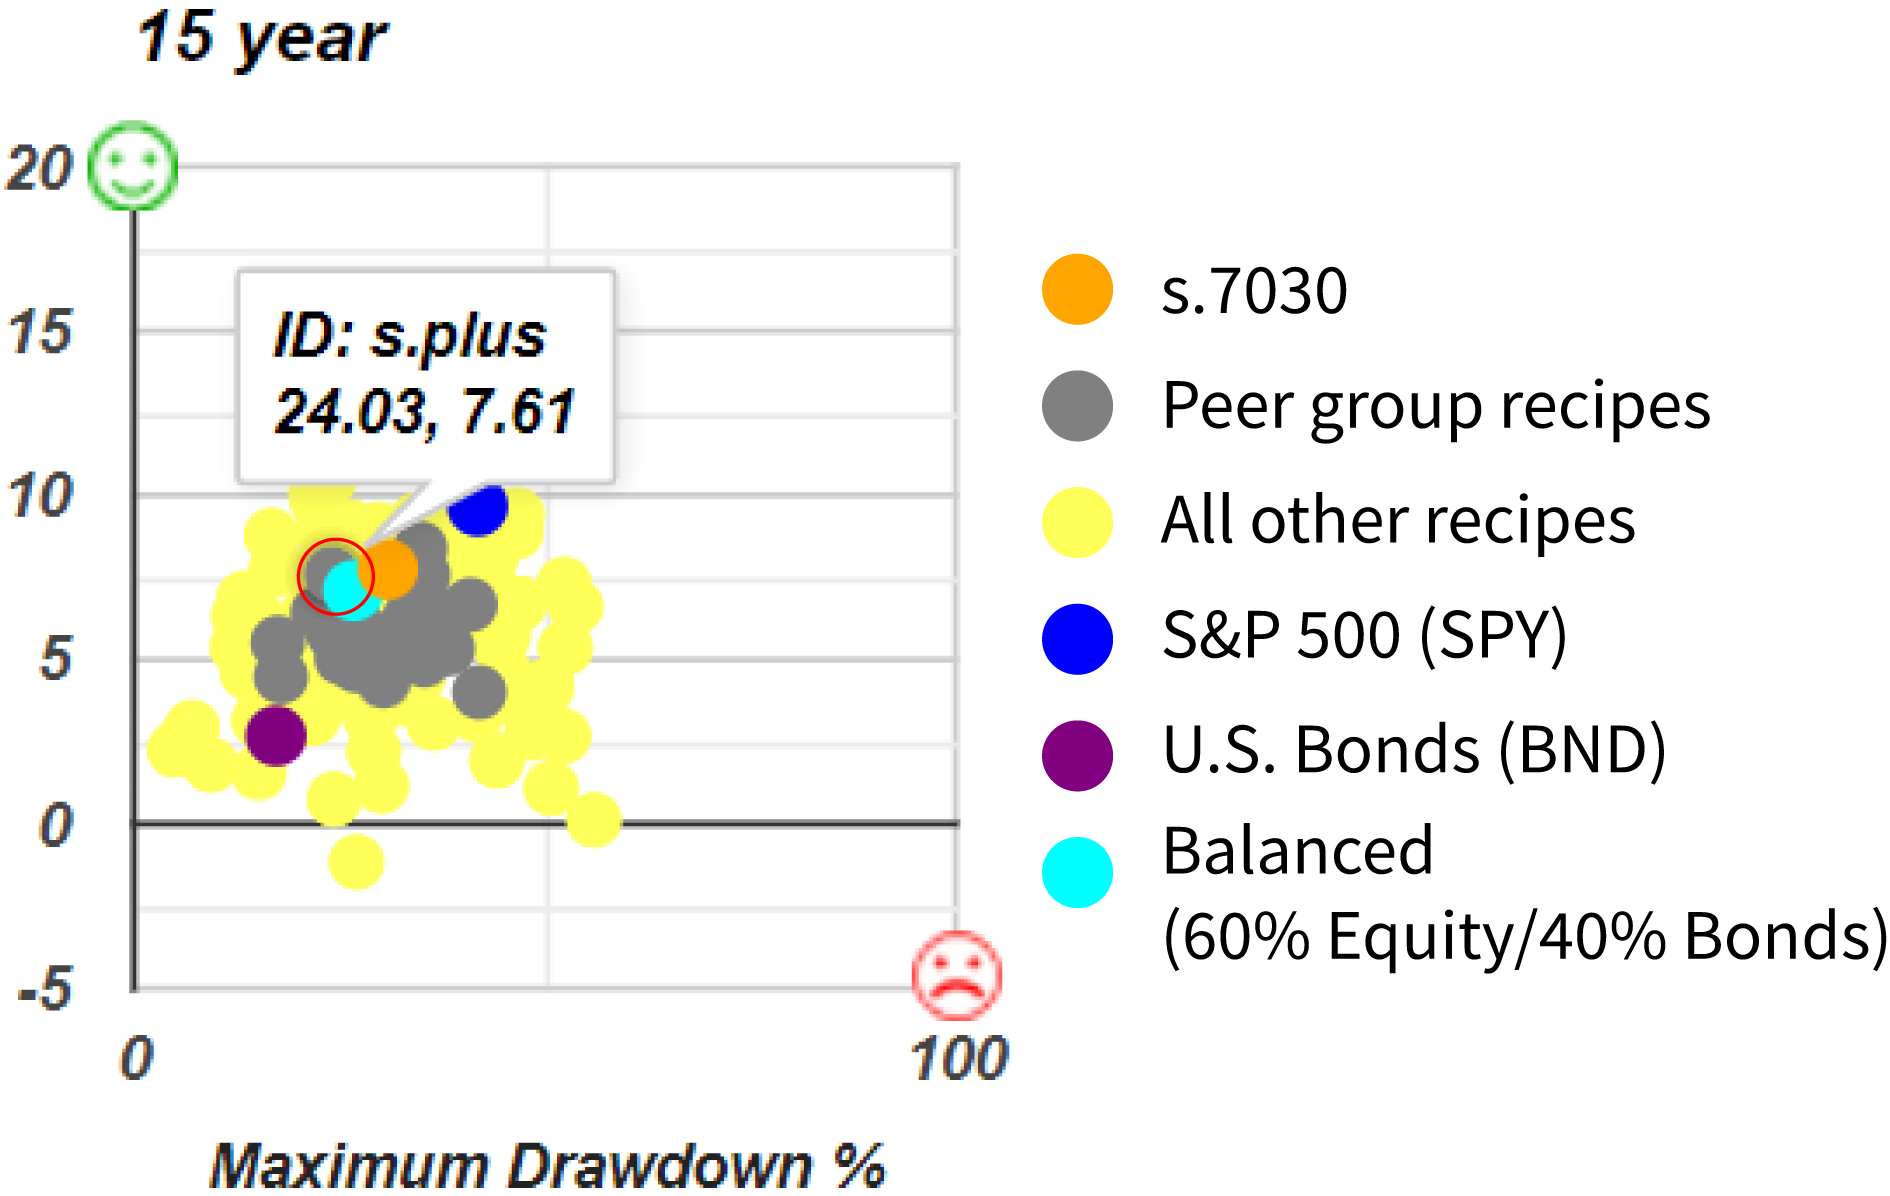
Here we can see the Permanent Plus (s.plus), that's one that our subscriber asked about for over 15 years. So you can see that s.plus is a little above and to the left of the teal dot, but just by a little.
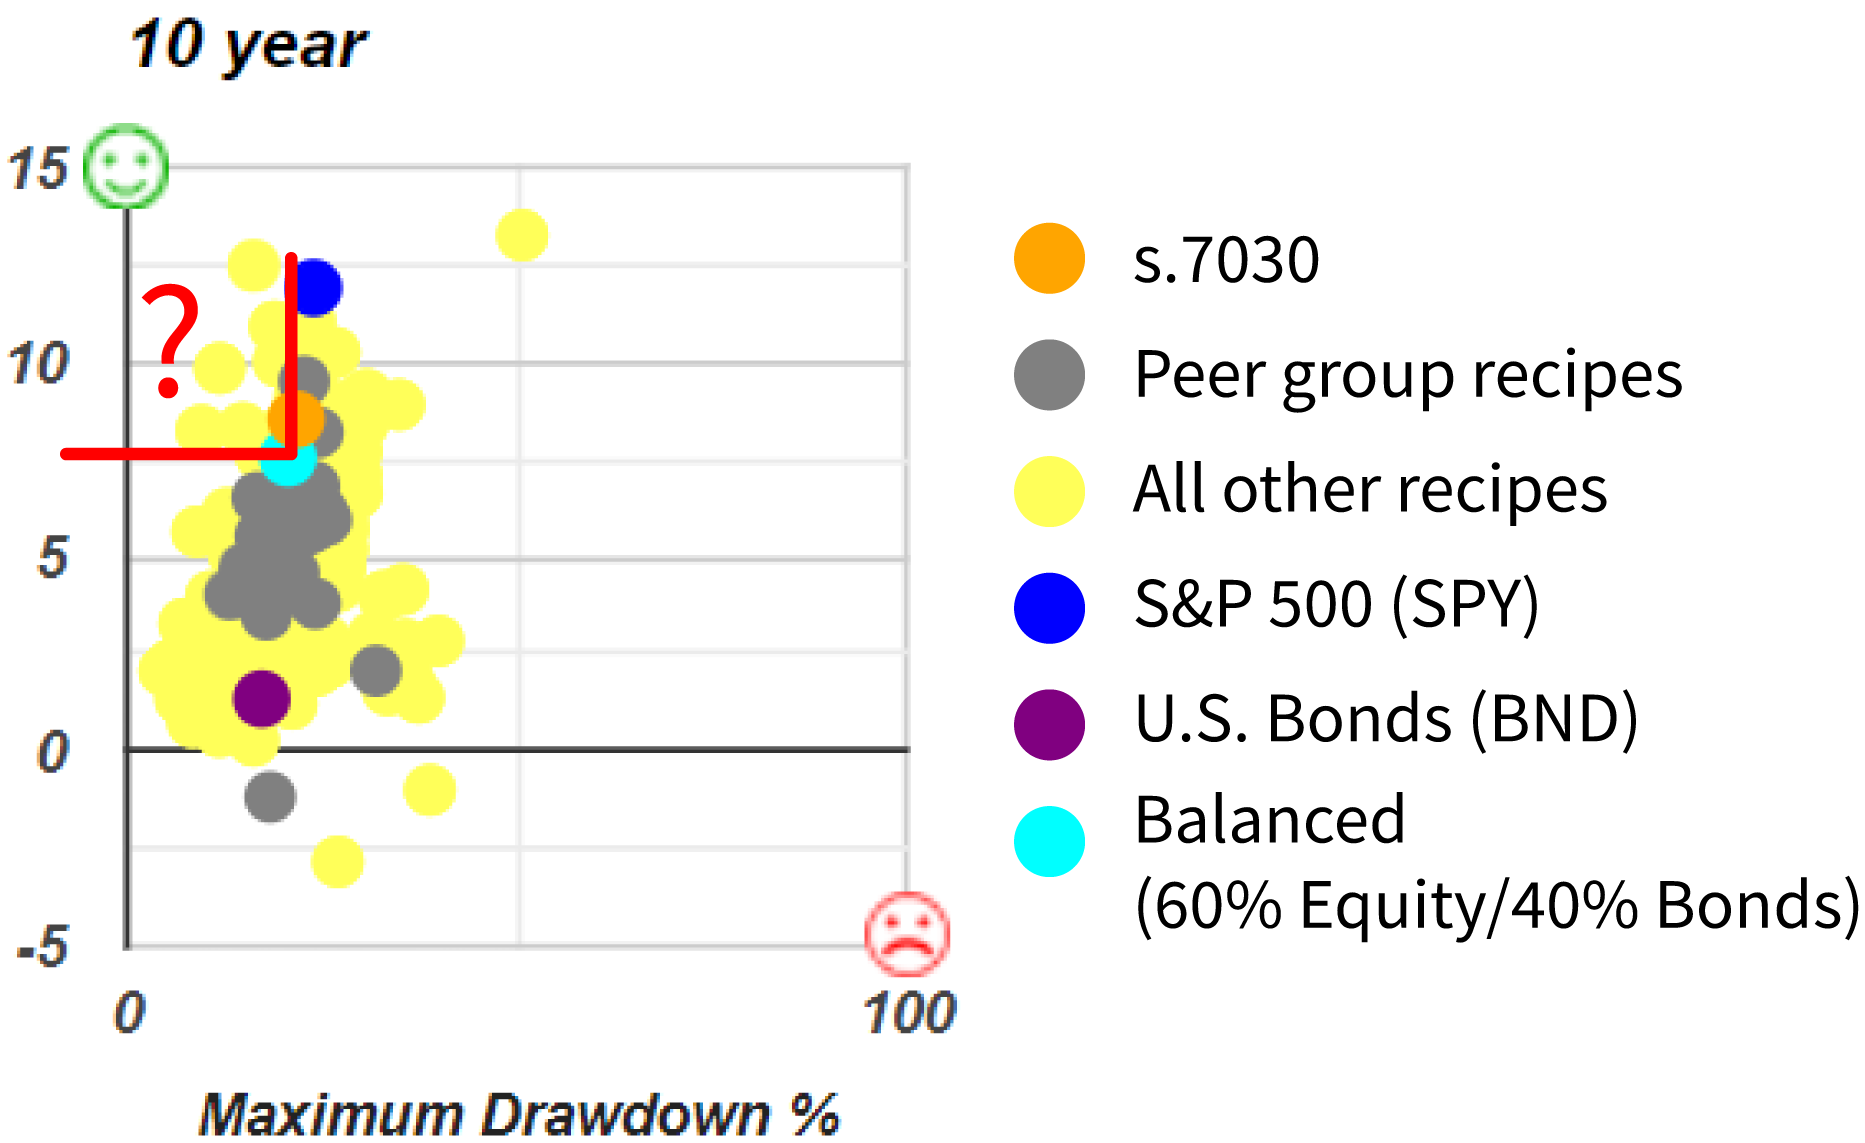
And then in this graph, we don't really see anything above and to the left of the teal dot. There aren't really any gray dots in that area. Now, there are some yellow dots because these are going to be tacticals, they're not in the same peer group, but in terms of gray dots, we're not really finding any above, namely high return and to the left lower, lower drawdown than the teal dot.
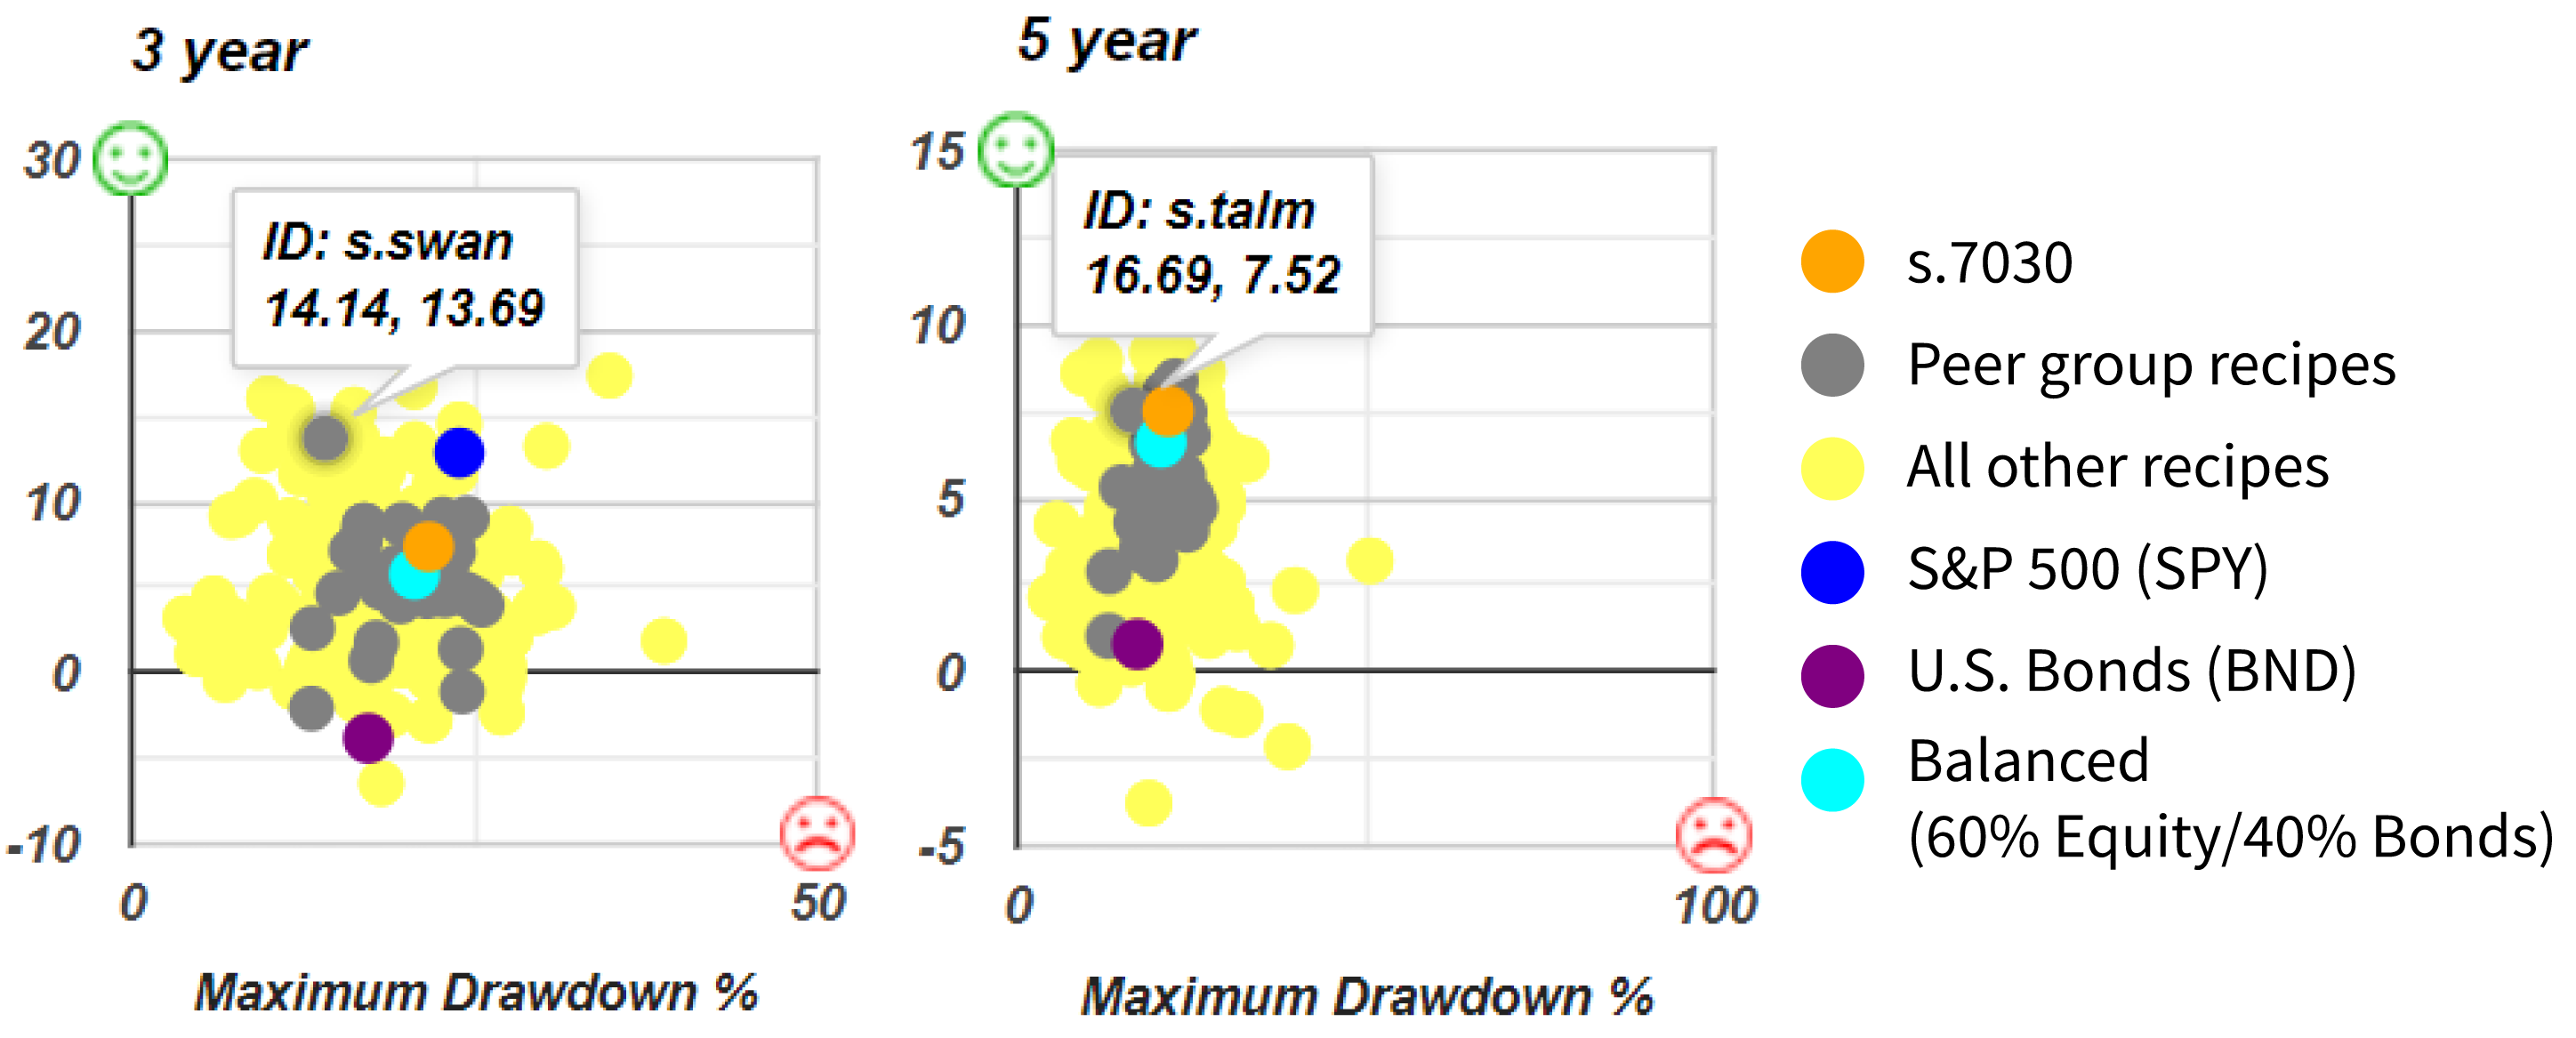
Now here's another one that we find, Talmud Dividend Equities (s.talm), that's a Talmud based portfolio. And then there's the Black Swan Hyperinflation portfolio(s.swan). Over the 3 years, it's done pretty well, but it suffers over the longer time period. And interestingly, the 60-40 portfolio really does offer a good benchmark. Also remember, there are some portfolios that'll be above and to the right of the 60-40 that offer greater risk and greater return. If 60-40 isn't good enough for you, it doesn't have the return you want, then there are some options to get a greater return with greater risk.
Using the Spreadsheet download for analysis
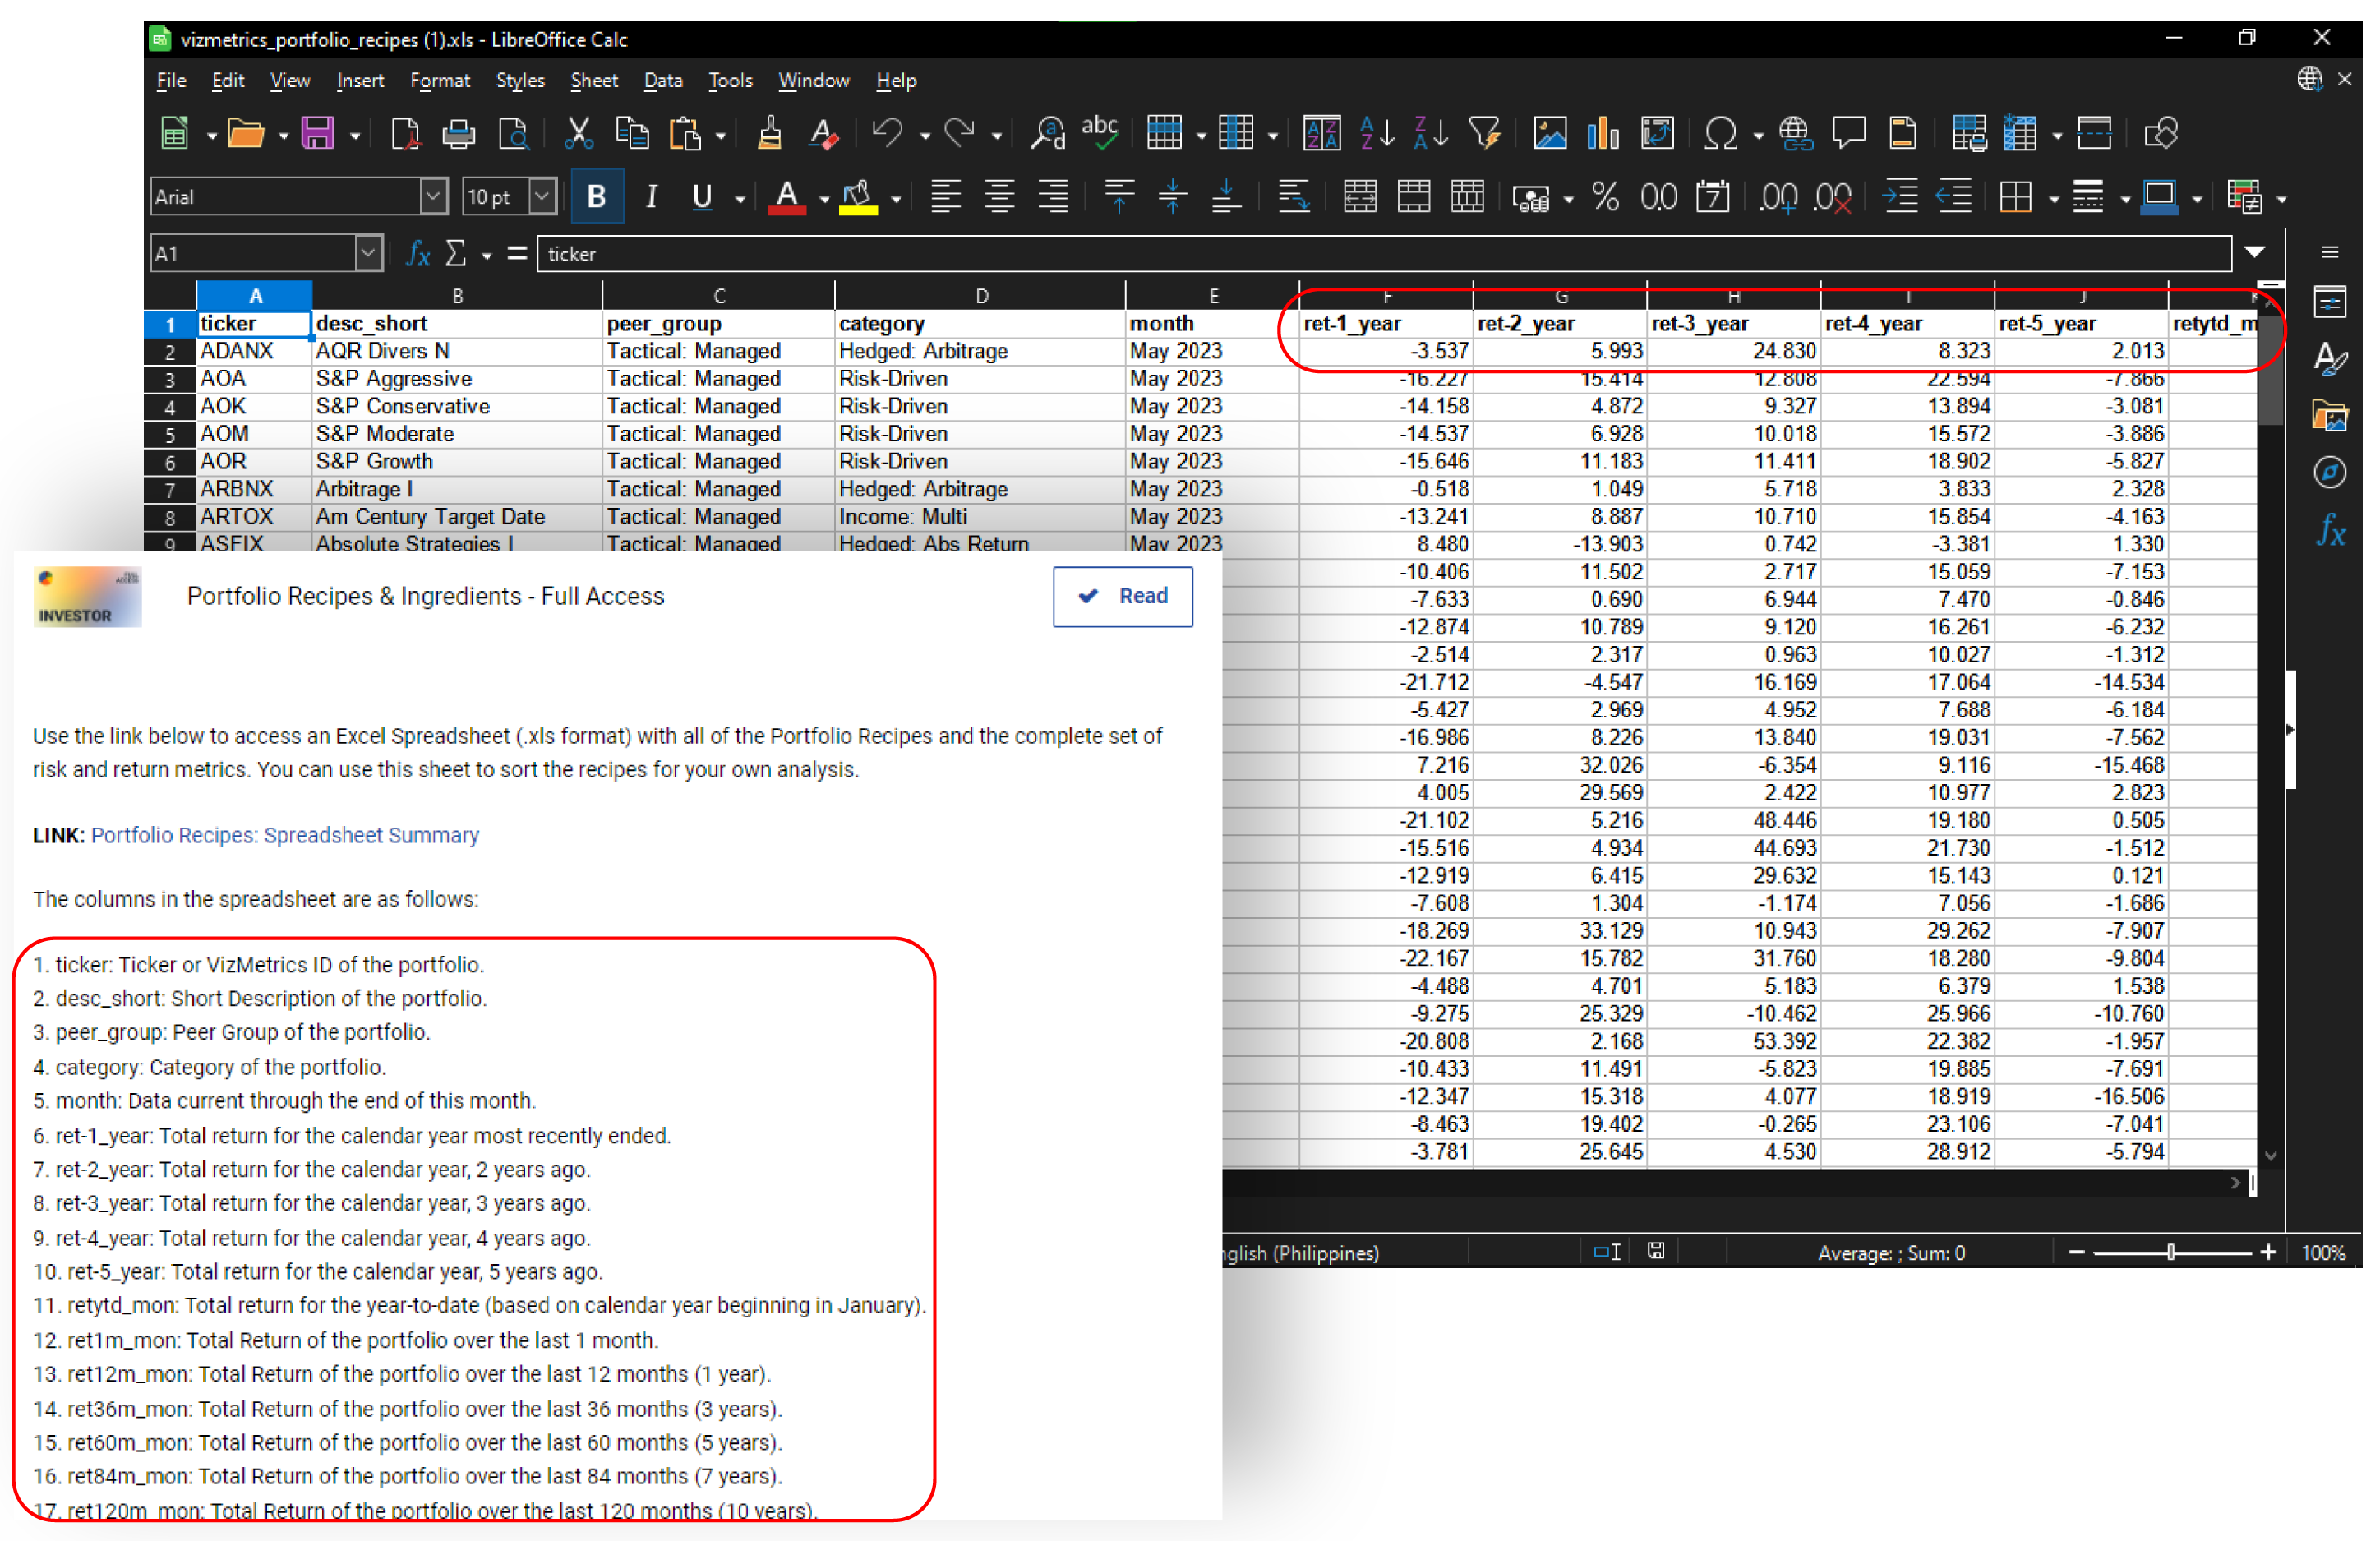
Let's use a tool that we haven't used too much, but I think will be interesting to look at. Namely, it's our portfolio recipe spreadsheet summary. If you click on the spreadsheet summary, it'll pop up a sheet that you can download and open. So let’s bring it over and see what it looks like. There are several columns that describe all the columns and what they mean.
And so what we're really going to be interested in for this quick analysis is the return over the last 180 months, which happens to be 15 years. And we'll also be looking at the risk or the drawdown over that same period and that'll give us a quick look.
Let's look at the return over the last 15 years. The “ret180m” or return over hundred eighty months and the “maxdd180m” or maximum drawdown over 180 months. These are the two columns that we'd like to look at.
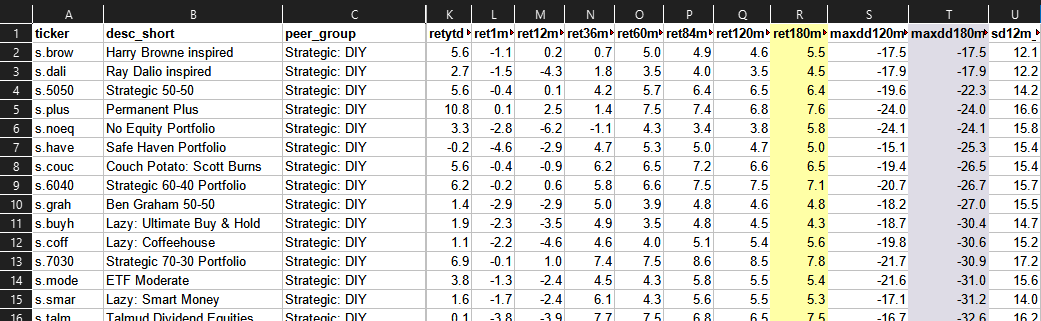
And now we can scan down the strategic DIY row and see what we find. At the top with the lowest drawdown over the last 15 years is Harry Browne inspired (s.brow) portfolio recipe. Then we have a Ray Dalio inspired (s.dali) portfolio recipe. But the challenge here is, they're not getting above 6% return annualized, and over the last 3 years, there's been a 0.7% return. And that’s not great. What I might do is say “Where's a 6% return or where's a 7% return that we can look at?”
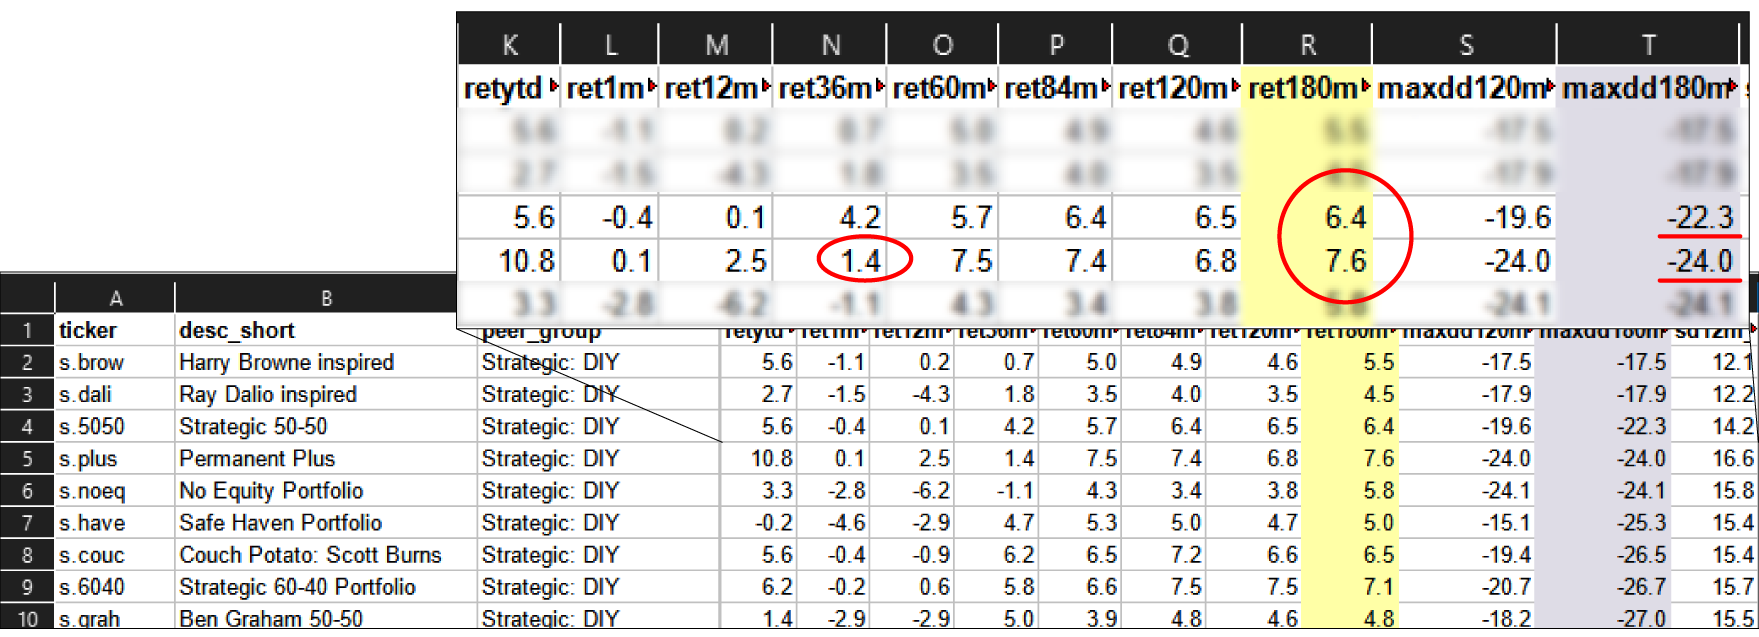
Here's a 6% return, a 7% return with just -22.3 and -24.0 percent down. Interesting Strategic 50-50 (s.5050). And there's the one that our subscriber asked about the Permanent Plus, maybe not a bad choice. Now, the challenge here is that over the last 36 months, it's only returned 1.4% annualized over the last 3 years, not stellar. So that's probably dragging down this number. And it's done two and a half percent over the last year, and just a 10th of a percent over the last month, and that’s something to consider.
The other recipe in the question was this Strategic 80-20 Portfolio (s.8020). And indeed, this cracks into the 8.4% return over the past 15 years, but you have to be able to accept the 34.9% drawdown.
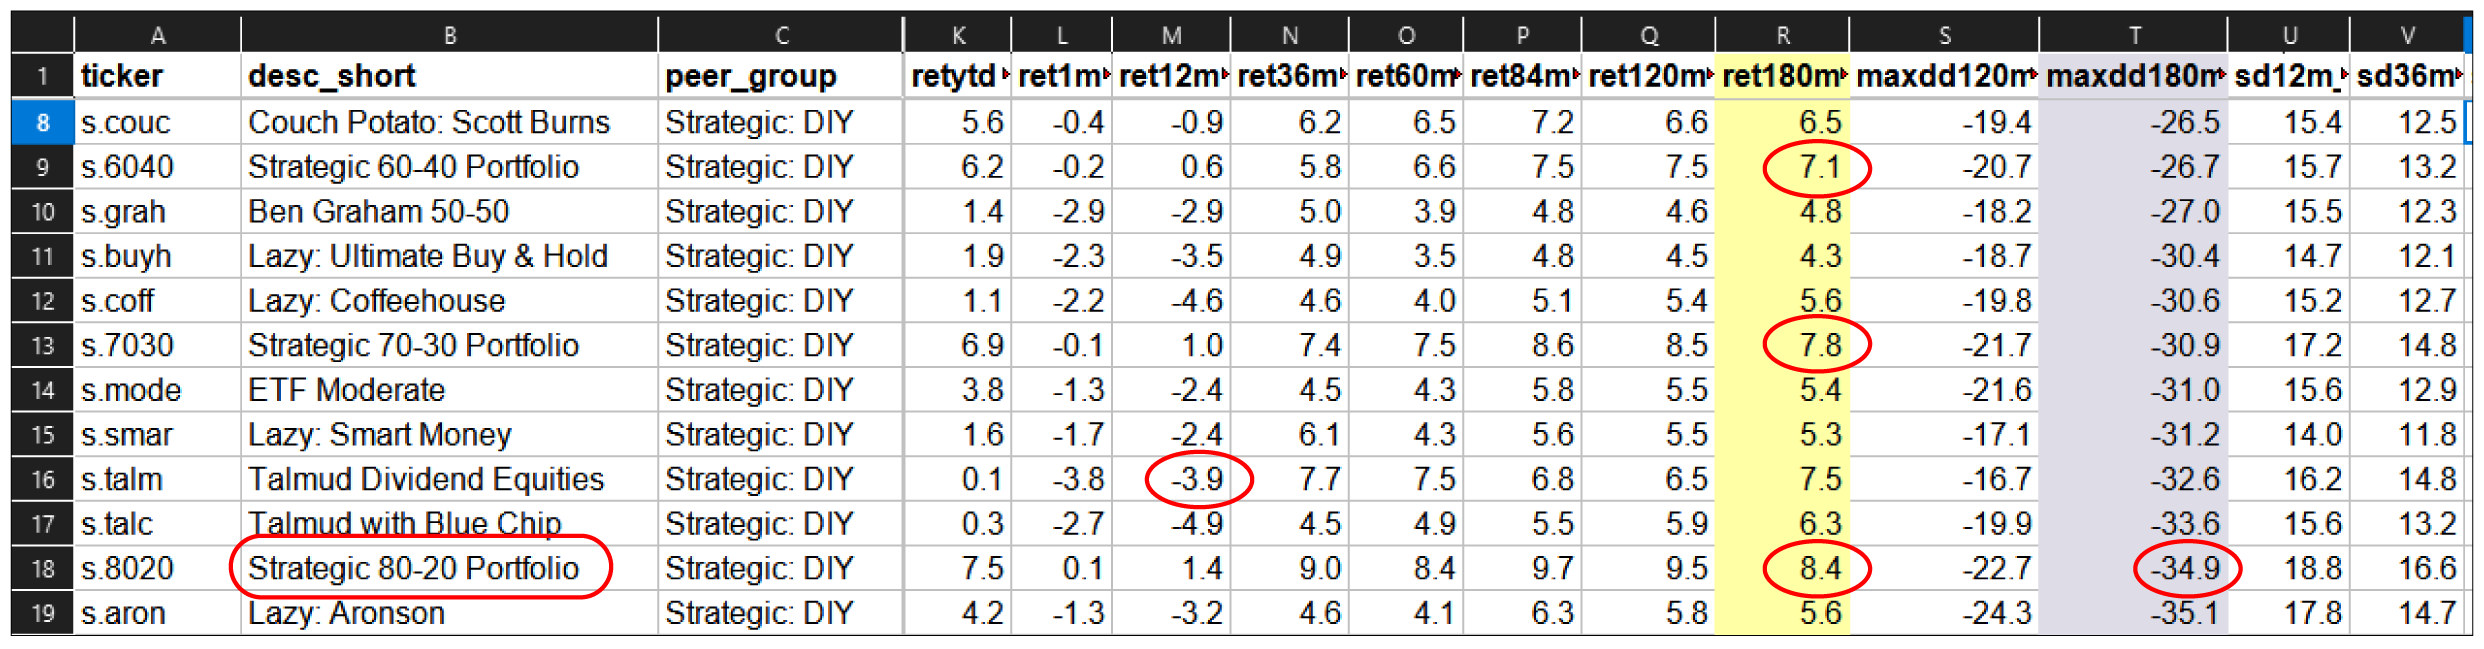
Again, I believe this is based on the 2008 drawdown peak to draw off. Your mileage may vary and history may or may not repeat itself, but this is a broad brush risk measure that can be used. In between the 7.1% return of the Strategic 60-40 and the 8.4% return of the Strategic 80-20 portfolio, obviously we have something pretty much smack in the middle of the Strategic 70-30 Portfolio. Then there’s the Talmud Dividend Equities (s.talm), but again, you have to be willing for that to be down 3.9%. In the end, these simple two ETF portfolios namely the 60-40, 70-30, and 80-20, in many cases they can be difficult to beat because they've got returns in the 7’s or 8’s with sort of high 20% low 30% drawdown over that same period. That's a look at some of the options for the strategic DIY portfolios and of course, Permanent Plus was one to look at too.
High-return Strategic Managed Portfolios
Let’s look into another category. This is a strategic managed category, which technically these are tactical ETF and a tactical mutual fund. But because they're so slow moving, we can see the S&P 500 Equal Weight (RSP) and the Permanent Portfolio (PRPFX) because they're so slow moving, we've labeled these strategic manage, so there's just two of them in this category, but we can take a quick look.
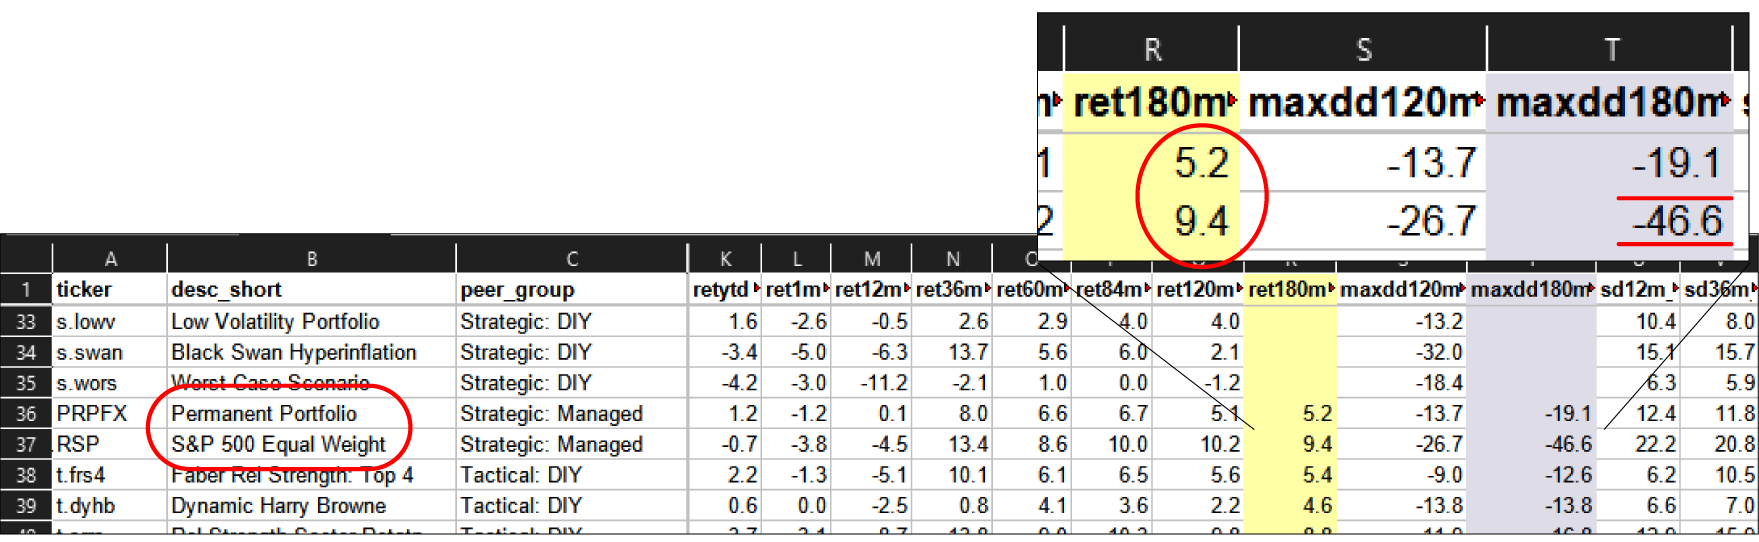
For the S&P 500 Equal Weight, a 9.4% return over 3 years is pretty great and a not so great -46.6% drawdown. For Permanent Portfolio, a not so great 5.2% return over 3 years and a relatively low drawdown of -19.1%. Those two are not a big standout there, but it was worth looking at sort of paying someone else to manage a strategic portfolio for you.
High-return Tactical Managed Portfolios
Let's look at this last option which is tactical managed, which is basically paying someone else to manage it for you. So it is a “Set It and Forget It” in a sense, even though some of these allocations can vary pretty widely based on the manager's discretion. This is a whole mix of different types of tactical managed funds. Let's find the first 6% or more that appear in the column of return for 180 months.
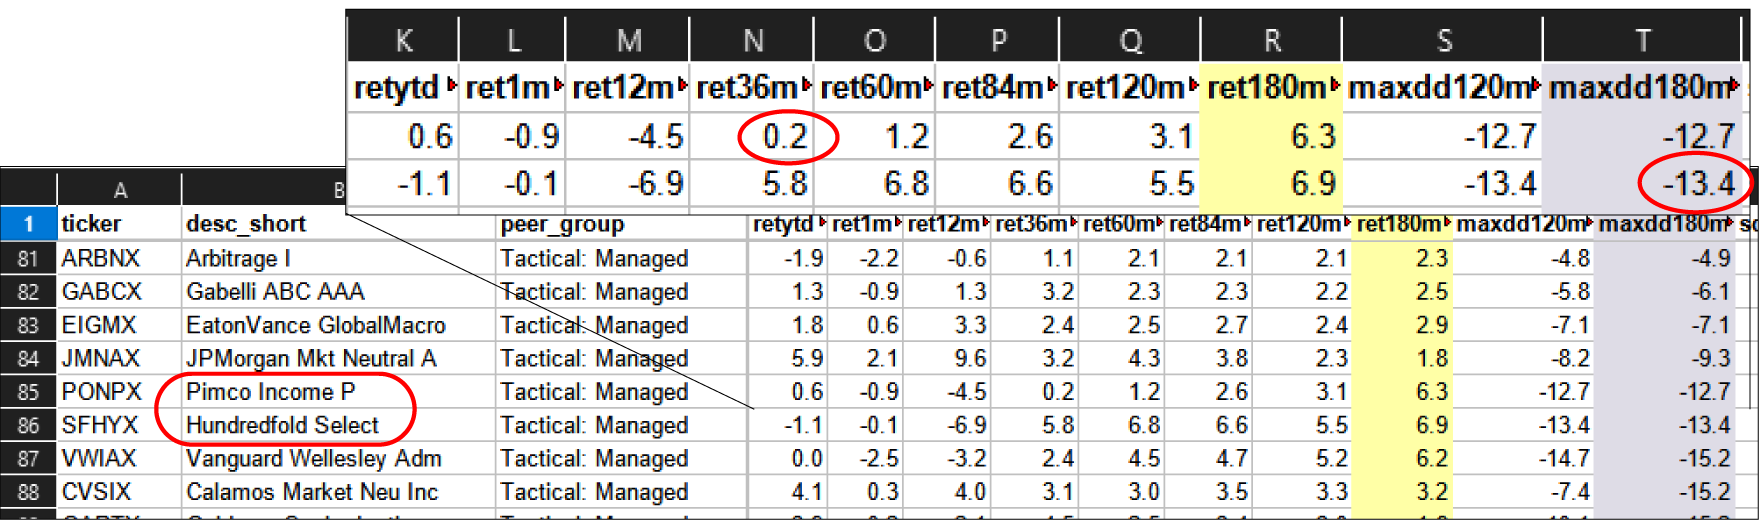
Pimco Income P (PONPX), a well-respected income mutual fund. And over the last 36 months when fixed income has been getting hammered, it's done 0.2% annualized over the last 3 years. It's done well over the last 15 years, but it hasn't really done well over the last 3 years. For Hundredfold Select (SFHYX), it has gotten a little bit down the last 12 months, but over the last 3 years, it’s 5.8%, 5.5% over the last 10 years, and 6.9% over the last 15 years. And look at its drawdown, it hasn't ever been down more than -13.4% over that period.The Hundredfold Select could be interesting to look for if you're going to pay someone to manage it for you.
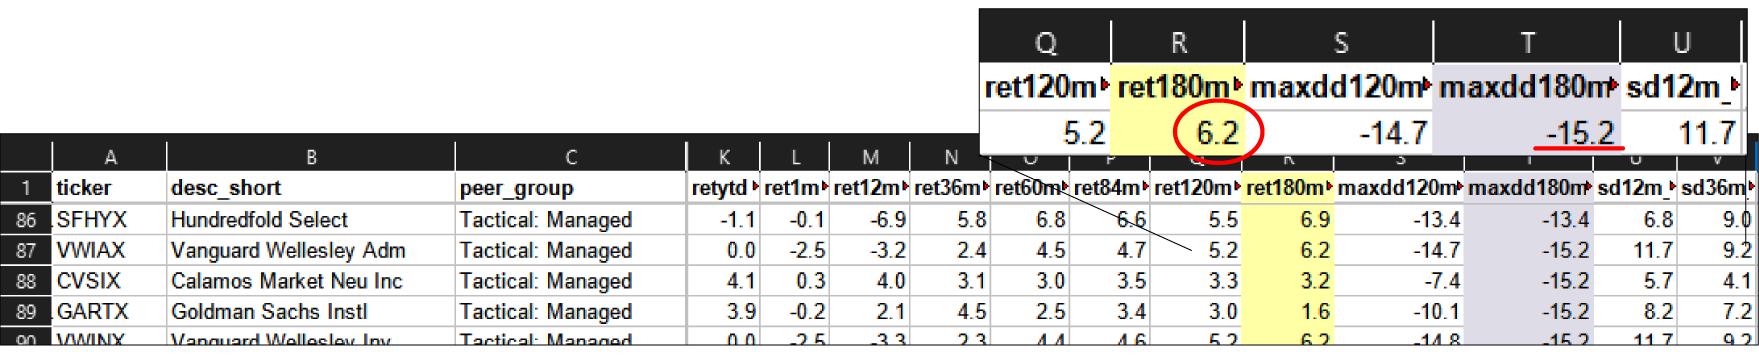
And here's the Vanguard Wellesley Adm (VWIAX), which is interesting to compare to maybe a 50-50 stock bond fund. So this is sort of a more conservative balanced fund, but 6.2% return with just -15.2% drawdown is a pretty solid performance from our friends at Vanguard there. We have another six Vanguard Wellesley and this is actually a similar fund, just a different share class. It's going to be a little more expensive, so you might expect the performance to be a little lower there. It's 1/10th of a percent lower because they're higher fees for the investors.
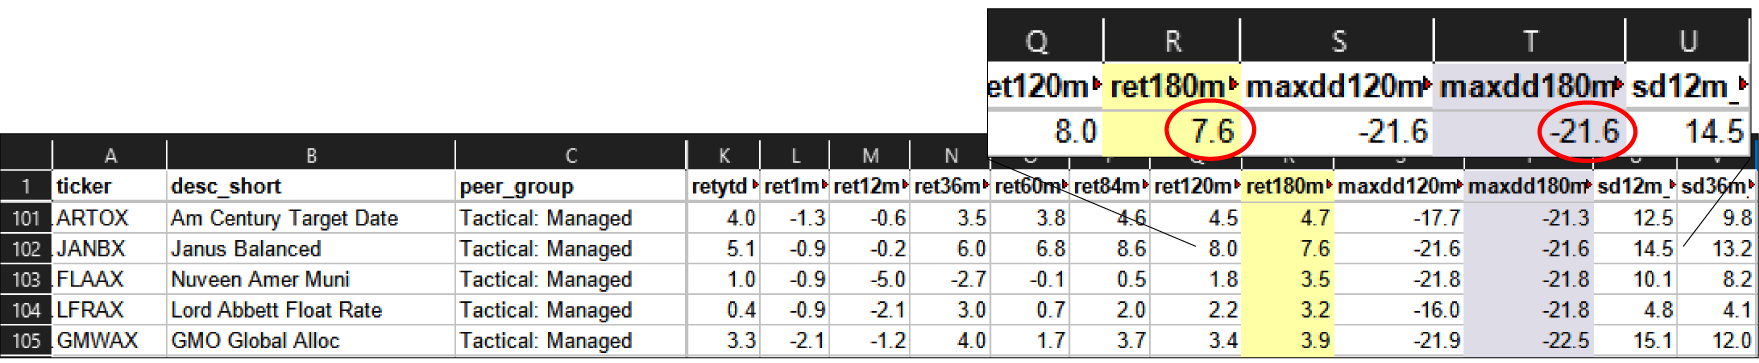
Now we have a 7.6 in the risk ladder, Janus Balanced (JANBX) has done pretty well at 6% over the last 3 years, 6.8% over the last 5 years, 8.6% over the last 7 years, 8% over the last 10 years, 7.6% over the last 15 years, and max drawdown of -21.6%. Interestingly, Janus. Balanced could be worth a look. And keep in mind if max drawdown and downside deviation over the last 15 years is not your cup of tea, you can just hide those columns. There's other options for evaluating risk rather than max drawdown. Max drawdown is a pretty simple one that I like to use just for the first pass of analysis.
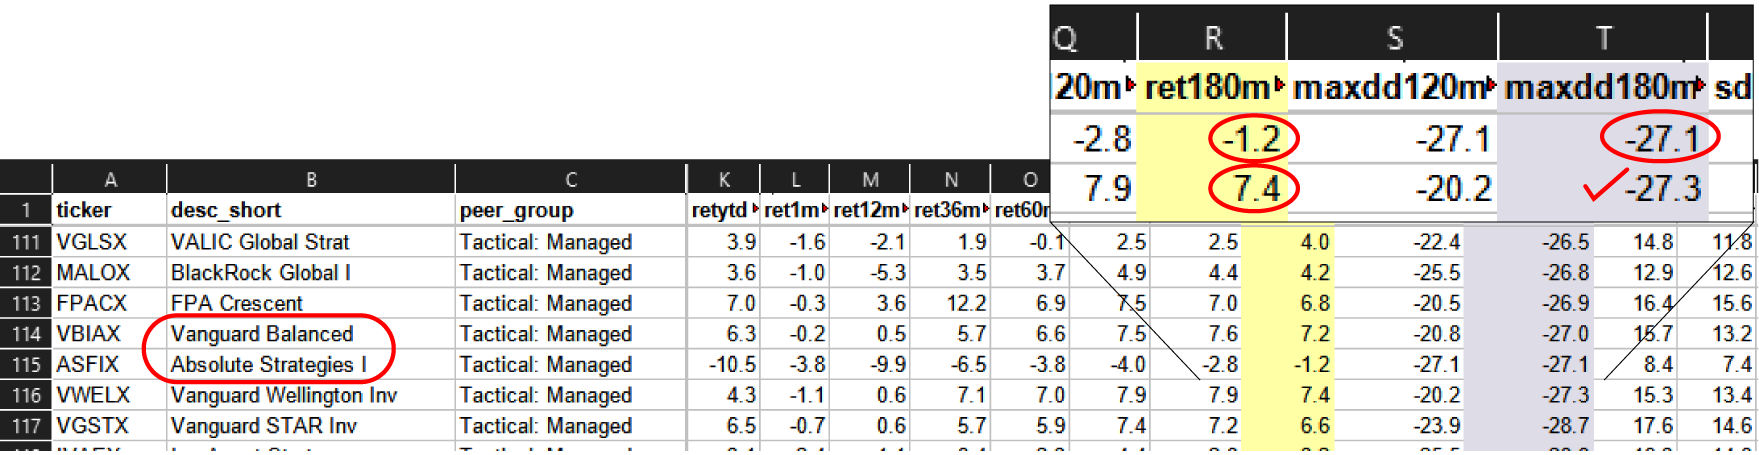
Now continuing down the list, here's one particularly poor Absolute Strategies I (ASFIX), it's averaged negative returns over the last 15 years. And actually every time period it's had a negative return and it's had a maximum drawdown of 27%. This is probably one of them that may not be long for this world, we'll have to see. And we have a 7.4%, a somewhat famous Vanguard Wellington Inv (VWELX) fund investors share which has a nice return, 7.1%, 7.0%, 7.9% respectively, very steady with a -27.3% maximum drawdown. I believe this was the first ever mutual fund dating back to 1929. These people at Vanguard have really been working hard and keeping this steady.
For Robeco Long/Short I (BPLSX), these are institutional shares, so we don't know how accessible those would be to regular investors, but that's certainly posted some exciting numbers over the last 3 years or the last 15 years, maybe not so much in the 5 to 10-year zone, but less than -30% drawdown. That has its benefits, but that's going to be a pretty expensive fund that uses some very advanced strategies.
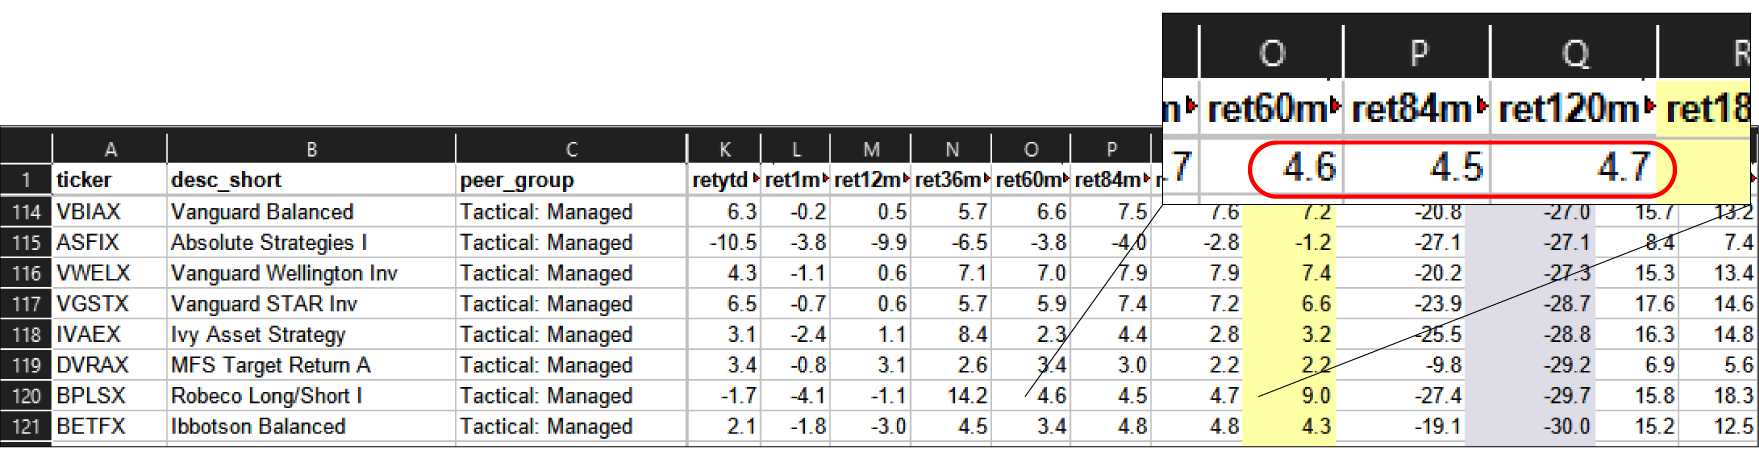
You kind of see how the process works. The spreadsheet file is a bit more detailed than looking at the scatter plot because we can go item by item and look for the specific numbers for the 15-year return, compare that to the 15-year drawdown and see if anything pops out.
That's been an overview of the tactical managed “Set It and Forget It” if you want to pay somebody to do that. Again, these return numbers are after our net of those fees. And these will all have some sort of a management fee built in. Now, naturally, there's some very interesting returns within the tactical DIY space to get into the double digits over the last 15 years. But there's some return with that. And there's the need for monthly rebalancing. We can also look at Strategic DIY funds that start at about -17% or -18% drawdown and get a little riskier there. It has kind of pointed out that we might need to add some strategic recipes that have lower drawdown, which would make them less risky investments that would be a natural extension to our list of portfolio recipes that we track on an ongoing basis.
I hope that provides some interesting thoughts on the various ways to compare the “Set It and Forget It” portfolios. You can download the spreadsheet and sort by multiple columns, first by one column, then by another. You could even create your own scatter plots if you want to, your mileage will vary. Whether you use LibreOffice, Excel, Google Sheets, etc. whatever you've got, you could really start digging down into the individual portfolio recipes and compare them head to head.