Article-2023-05
May 2023 Recipe Investing - Commentary
Topics this month
- Best performing exchange-traded funds not related to a particular country
- Steady portfolio ingredients
- Interesting performance of the 60-40 portfolio
- One good performer, GMO Benchmark-Free Allocation III (GBMFX)
- Other Portfolio Recipes that work over the past 15 years
Welcome to the May 2023 commentary from recipeinvesting.com. We track investible portfolio recipes that allow investors and advisors to build portfolios that minimize risk and maximize return. We reallocate and rebalance monthly, so we have plenty of new material to cover for our comparisons this month.
Our investment portfolio comprises various exchange-traded funds, which we refer to as "portfolio ingredients." Before we delve into the details, let's take a high-level look at how the global market is performing.
Best performing exchange-traded funds not related to a particular country

If we sort the portfolio by the last month's performance, we can see that many of the country's funds have done well. However, we want to identify the top-performing exchange-traded funds that are not tied to a particular country. This is because global equities on a per country basis can be affected by political issues, exchange rates, and conflicts, which can make the situation complicated. Therefore, let's focus on other options in our portfolio.
Steady portfolio ingredients

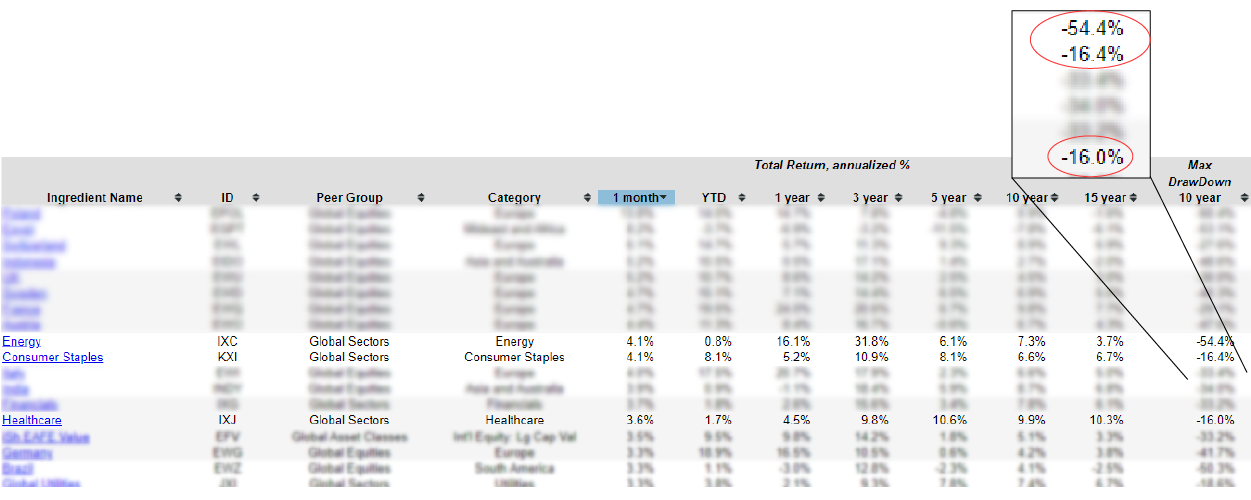
Over the past month, four sectors–energy, consumer staples, financials, and healthcare–have performed well. However, when we look at their performance over the past 10 years, we see some differences. Energy has experienced significant drawdowns of over 50%, while consumer staples have only had a drawdown of 16.4%. Financials have faced challenges, particularly over the past 15 years, and healthcare has been down 16% over the past decade. When we say "drawdown," we refer to the difference between the peak and trough of a sector's value based on monthly data over the past 10 years.

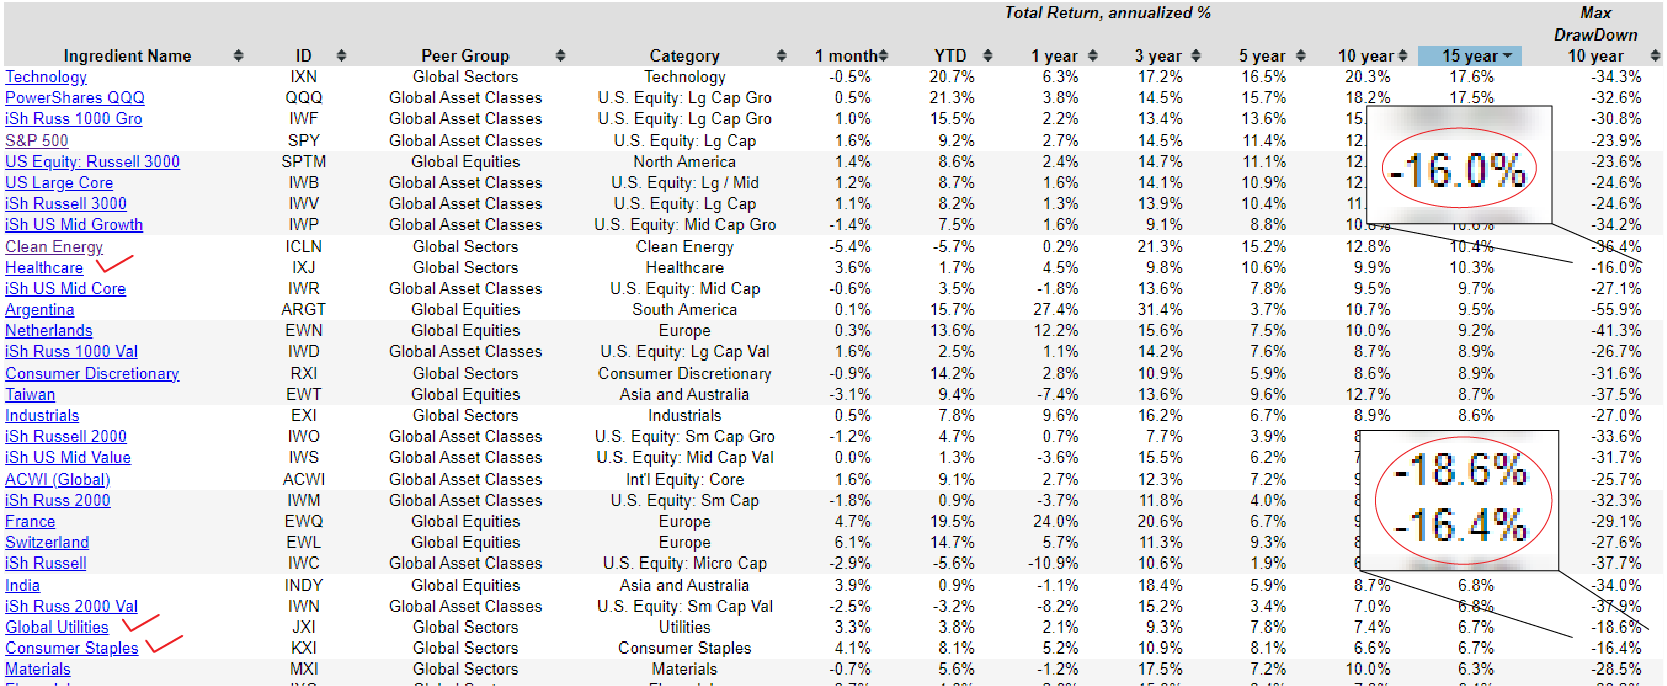
We could also look at the past year to see what's been doing well. We have some country funds, some country specific equity funds that have done well, but then we get down to this Alerian US Master Limited Partnership (AMLP) for energy pipelines, it's done well, but at 66% drawdown over the past 10 years is more disappointing. And then if we look at the 15-year ranking, we could ask, “what ingredient has done the best over the past 15 years, but it's had less than 20% drawdown over the past 10 years?”. So that leaves us with a relatively short list of healthcare.

And then we can come down the list, and we can also see global utilities and consumer staples. That's just a reminder that it can be quite challenging to use only these ingredients or exchange-traded funds, mutual funds, and with a buy and hold strategy to create a consistent high performing portfolio that maximizes return and minimizes risk. Instead, if we look at a blend or a tactical portfolio that can get in and out of these different asset classes and sectors on a monthly basis, then we can see some different results that have a different, more favorable risk return profile.
And that's for the analysis of portfolio ingredients, which really highlighted that people need to eat, people need to stay warm, people need to get well. So we have healthcare, global utilities, and consumer staples kind of shining out as some consistent performers. Those might be worth taking a deeper look at, in fact, that might even warrant a look at a recipe that combines some of those steady portfolio ingredients.
Let's switch back to the portfolio recipes. And we’ll see what’s been going on in this list. By sorting it by one month to see who's been at the top, there's Berkshire Hathaway (BRK.A), a Warren Buffett, and his group ticker.

This is a little unusual, and this is an individual equity and individual stock that appears alongside all of our other mutual funds and exchange-traded funds. And then those IDs with T-dot (t.) show our tactical portfolio recipes and S-dot (s.) show our strategic or static portfolio recipes. So anytime you see a T-dot (t.) in the column, that's going to mean that the allocation of that portfolio recipe changes every month, and we're buying and selling at the end of each month to update these numbers.

Warren Buffett has consistently performed well, achieving 8% returns over the past month and maintaining convincing performance over the past 15 years. While Buffett deserves credit for this consistency, it's important to note that his portfolio carries some risk. In fact, there have been times over the past 15 years where he has experienced drawdowns of almost 42%. While Buffett's portfolio is not without risk, he has shown a consistent track record of success.

If we move back to one year, we can see that the Defensive Bond (t.dbnd) tactical portfolio recipe has done well over the past year. And hasn't done great over the past 10 years, this is a momentum-based strategy that moves in and out of a small set of bond funds, of different varieties. A 10-year drawdown has only been 10.8% max drawdown, and we don't have enough data because at least one of the underlying funds that makes up this tactical portfolio hasn't been around for 15 years. So we don't have a 15-year number, but it'll be interesting to monitor that to see how well that does over a longer time period.
Interesting performance of the 60-40 portfolio
We can also look at Strategic 60-40 Portfolio (s.6040). This kind of reminds me that this Strategic 60-40 Portfolio is a great bellwether metric just to understand how well an overall portfolio recipe, or even any investment, is doing. Because they discovered some time ago that if you choose 60% equity and 40% bonds, which we've done by just combining two exchange-traded funds, this VTI = 60% and BND = 40% by creating a static recipe that uses that ratio and we rebalance every month, it has done a remarkably good job of staying at the middle of the pack.I'm not saying it's exactly where you would want it to be.

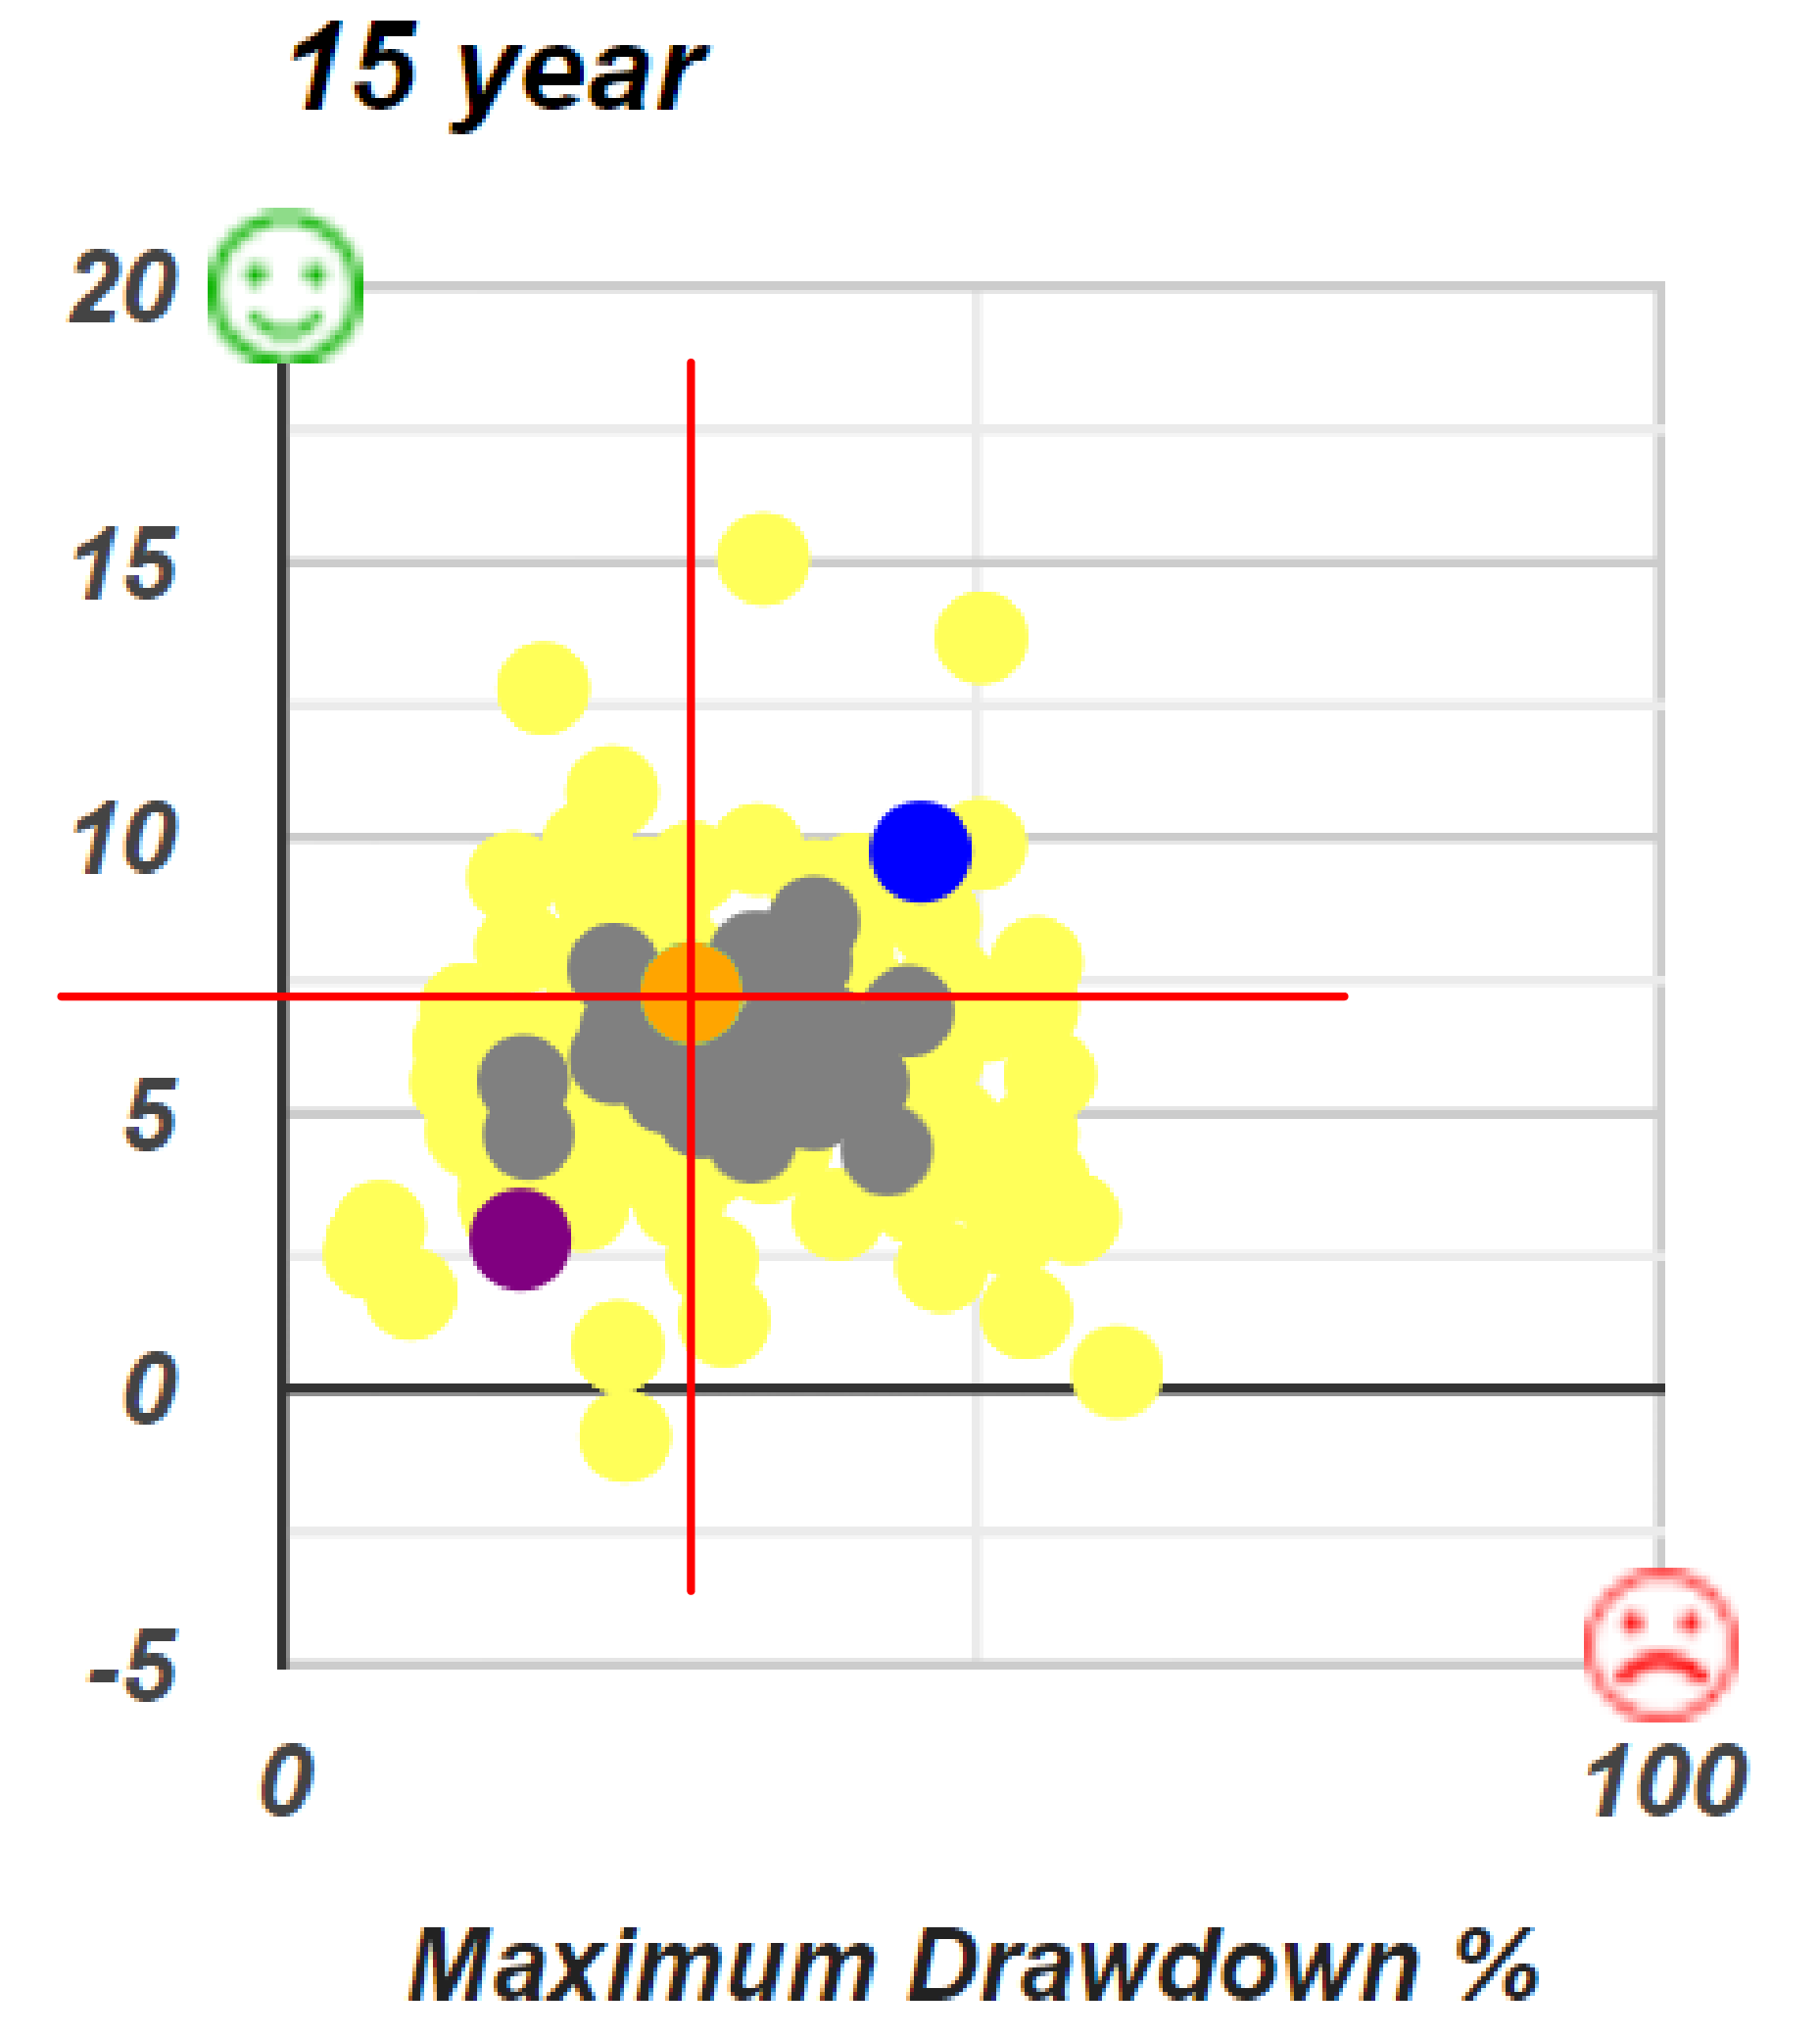
The Strategic 60-40 Portfolio, represented by the orange dot on these graphs, falls in the middle of a cluster that includes every portfolio recipe we track. This cluster includes managed mutual funds, tactical portfolios that we rebalance monthly, and strategic portfolios that we also rebalance, but don't change the composition of our S-dot or strategic portfolio recipes. Despite this range of options, the 60-40 balanced portfolio has consistently stayed in the middle of the pack. This raises the question: "Does your portfolio recipe beat the 60-40 balanced fund?"
One way to think about comparing recipes to 60-40 is to draw four quadrants. If we draw an axis centered right on the 60-40 fund, then anything in the top left would be what sometimes they call the northwest quadrant. This represents a higher return and a lower risk. So that's why we have the green smiley face up there. This is sort of the corner of perfection as investments would go, which no investment has found its way up there. And anyone who assures you they have a very low risk and a very high return investment is likely to be a scammer. So let’s just be aware of that.

But we see some in this graph above that fall into that category. When you're evaluating investments, I think you'd be wise to ask, compared to the 60-40, “Is this investment offering me more return at more risk?”, which would put you in the top right portion of the quadrant. If you've got a higher risk tolerance than by all means, which looks to be in this category in the top right of the quadrant. Or is it lower return with lower risk, which puts you in this category which is in the bottom left of the quadrant.
Or is it even better? Lower risk, higher return, which puts you in the green smiley face category. Now, interestingly, there are a lot of funds and portfolio recipes, even professionally managed funds that consistently cannot meet this benchmark of the 60-40 portfolio. So they're in this kind of bottom right of the quadrant down where they're higher risk, higher return than could be achieved just by owning two ETFs and rebalancing those monthly, or you could even do quarterly or annually, and I'm not sure that would affect your results too much.
So the simplicity of this metric is quite good now because both stocks and bonds have suffered in the last year. People have been asking this question, “The 60-40 balanced portfolio, is it bloodied? Is it dead? Should we throw it out?” Right? So here's a panel that was conducted at an investment conference just some weeks ago, you can check this one here Morningstar Panel: 60/40 Is ‘Bloodied,’ Dead | Wealth Management and it's interesting to kind of go through and see their opinions on this 60-40 balanced fund and benchmark.

In a recent panel discussion with investment professionals from top firms, the 60-40 strategy was described as "bloodied" by one of the professionals, despite its strong long-term track record, which the other professionals defended. They noted that 2022 was an unusual year, with negative returns for both stocks and bonds, and it's unlikely to be repeated. However, they agreed that it's worthwhile to explore alternative approaches to optimize risk and return for the 60-40 portfolio. At RecipeInvesting.com, we share this belief and offer other ways to combine assets and exchange-traded funds to create a more diversified portfolio with better risk and returns. While these investment professionals may have their own business incentives that could influence their recommendations, it's still interesting to consider the arguments they presented, given their experience.
And we have a list of some things that come out just in this one article or one panel that they're suggesting.
- Stocks that are less interest-rate sensitive
- Europe stocks
- Japan stocks
- Relative value trading (stocks)
- Relative value trading (credit)
- Securitized debt
- High-yield bonds
- Structured products
- Private credit
- Real estate interval funds
- Real estate
- Private assets
- Liquid alts
- Non-traded products
- Digital asset
To optimize your investment portfolio, consider stocks that are less sensitive to interest rates, such as European and Japanese stocks. Explore relative value trading and arbitrage opportunities across different geographies, including stocks, income, credit assets, securitized debt, high-yield bonds, structured products, private credit, and real estate. You may also want to consider investing in interval funds, which are closed-end funds that can only be traded at specific times. Private assets and liquid alternative investments, such as non-traditional bonds and long-short equity, are also worth exploring. Morningstar Hedge offers several categories of alternative strategies to consider. By diversifying your portfolio across these non-traditional investments, you might optimize risk and returns.
In our commentary, we have examined several strategies, including market neutral and long short equity. Market neutral has faced challenges, while long short equity has performed well for some funds, but their high fees make them an expensive option. There are other alternative strategies available, and we can explore options beyond traditional investments, such as non-traded products and digital assets. It's worth noting that commodities and precious metals are not even included in this discussion.
There's a lot of other things outside of the strict stocks and bonds 60-40 ratio. But it is interesting that of all the effort and complexity that someone would go to beat this 60-40 portfolio, when in fact it can be equal just by investing in those two exchange-traded funds. So sometimes the complexity is not quite worth the effort. And we can see that with these fund managers that are working so dutifully to invest people's money.

But somehow in this zone, shown in the graph above, it can't even beat a simple 60-40 portfolio. So an interesting reminder and exploration of the value of the 60-40 balanced fund.
One good performer, GMO Benchmark-Free Allocation III (GBMFX)
Take note that one of the investors or one of the panelists was from the GMO investment company. And we've looked at this GMO Benchmark-Free Allocation III (GBMFX) fund in the past, and again, it does well enough. Keep in mind that they're not just trying to beat a particular benchmark. They can go anywhere, do anything within the constraints of this mutual fund that they're managing. But if they have a license to do many different things, then one question would be “How have they done?” And here, let's look at standard deviation for annualized return for this GBMFX mutual fund, which is in orange from the graph below.

So we can see that they've done, compared to the purple U.S. Bonds (BND) fund, they've been above and to the right. So that's a higher risk and a higher return. They've been kind of in this direction. And then they've done that over the 3-year, 5-year, 7-year, 10-year, and 15-year time period. So they're remarkably consistent and they're adding value, but really they're kind of on the path. What they're doing is that they're just progressing you upward in terms of the risk return profile. And somewhat interestingly, if not embarrassingly, there is a combination of, as shown by the location of the purple and teal dot.

There is a combination somewhere along this line where maybe if you went to lower equities and higher bonds, that you would consistently beat the orange dot. I don't know if that's 90-10 or 80-20, but somewhere, there could be a fixed allocation between bonds and equities that consistently beats the orange dot on a 15-year, 10-year, 7-year, 5-year, and maybe not 3-year. They seem to have kind of left out the 3-year, and they've also done better on a 1-year basis. But in the longer term, there could be a two ETF combination that would've beat them.
So again, they're adding some value, they're doing good work. This is an investment product that could be a fit for some people, but just never underestimate the simplicity of some of these exchange traded fund models that can be implemented simply and sometimes beat the professionals. Well, some might say they often beat the professionals, but I won't go quite that far.
Other Portfolio Recipes that work over the past 15 years
We've examined several portfolio recipes using different lenses. As we conclude, let's take a 15-year perspective and review all the tactical portfolios, which are marked by a T-dot (t.) prefix.

Among them, the S&P 500 Equal Weight ETF (RSP) stands out as a powerful performer over the last decade, despite suffering a drawdown of over 50% in the past 15 years. However, to determine what worked during the entire 15-year period, we can sort the portfolios then evaluate their recent performance and risk levels. For instance, among the top performers with less than 20% drawdown, the Adaptive Allocation F (t.aaaf) portfolio has done particularly well, generating a return of 12.7% over the past 15 years. Another standout is the Relative Strength Sector Rotation (t.srrs) portfolio, which has a drawdown of -16.8%.
>Moving on to other portfolios, the Maximum Sharpe Portfolio (t.shar) had a maximum drawdown of -22.1%, but it struggled over the last year. In contrast, the Faber Relative Strength Portfolio: Top 3 of 5 (t.frs3) has consistently delivered excellent results, with a maximum drawdown of -17.3%.
These portfolio recipes illustrate how tactical asset allocation can optimize risk and return by combining exchange-traded funds using momentum and risk-driven strategies. By updating the portfolios monthly, we can achieve better performance than a traditional 60-40 balanced portfolio, which we've discussed in this commentary.
