Article-2023-03
March 2023 Recipe Investing - Commentary
Topics this month
- Top performing recipes over the past month and past year.
- Portfolio Recipes with risk versus return that beats the two ETF Strategic 60-40 Portfolio.
- How good is the Strategic 60-40 Portfolio as a benchmark?
- Applying the Sortino Ratio to see the total return to each Portfolio Recipes.
Welcome to the March 2023 commentary from recipeinvesting.com. We track investible portfolio recipes that allow investors and advisors to build portfolios that minimize risk and maximize return. We reallocate and rebalance monthly, so we have plenty of new material to cover for our comparisons this month.
We have portfolio recipes here and also portfolio ingredients, which are the underlying ETFs and mutual funds.
Let's jump into ingredients first just to see what's happening here
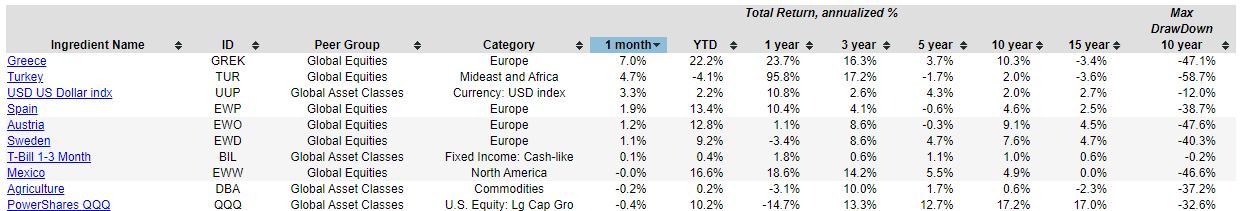
Sorting these by month, we can see that some of these Global Equity ETFs have really been struggling, and if we sort by the other direction, we can see that it's also Greece and Turkey that have been doing the best. Some of these countries' specific exchange-traded funds have tremendous swings from month to month.
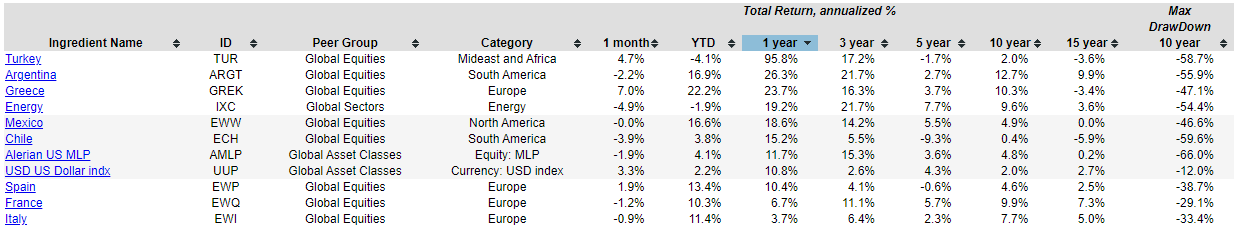
If we take a slightly broader view by one year, as we can see at the table above, the phenomenon is the same, where you have these country specific exchange-traded funds that are really outperforming over the past year, and they're also struggling.
This is a reminder that it's important to assemble these ingredients into overall portfolio recipes that can then mitigate the risk and balance the return and provide a stronger portfolio than holding onto just one of these individually.
Let's take a look for SPY and find the S&P 500 as a benchmark, and we can see that it is down two and a half percent this month. In column two, is year to date (YTD) and the third column is the one year (1 year).
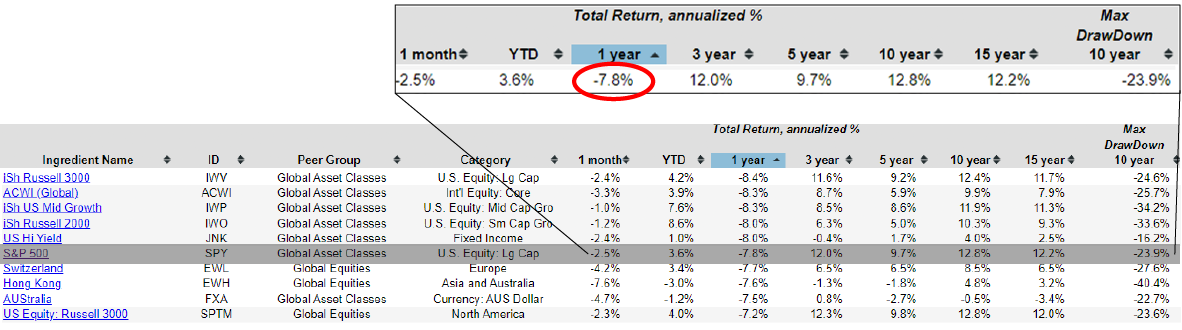
So it's down 7.8% over the past year. That might be something just to keep in mind as we look at some of these other metrics and assets.
The Top Portfolio Recipes
Portfolio recipes are the combined portfolios we form from exchange-traded funds and sometimes mutual funds. We can see that no doubt it's been a rough month. We have a lot of negative returns.
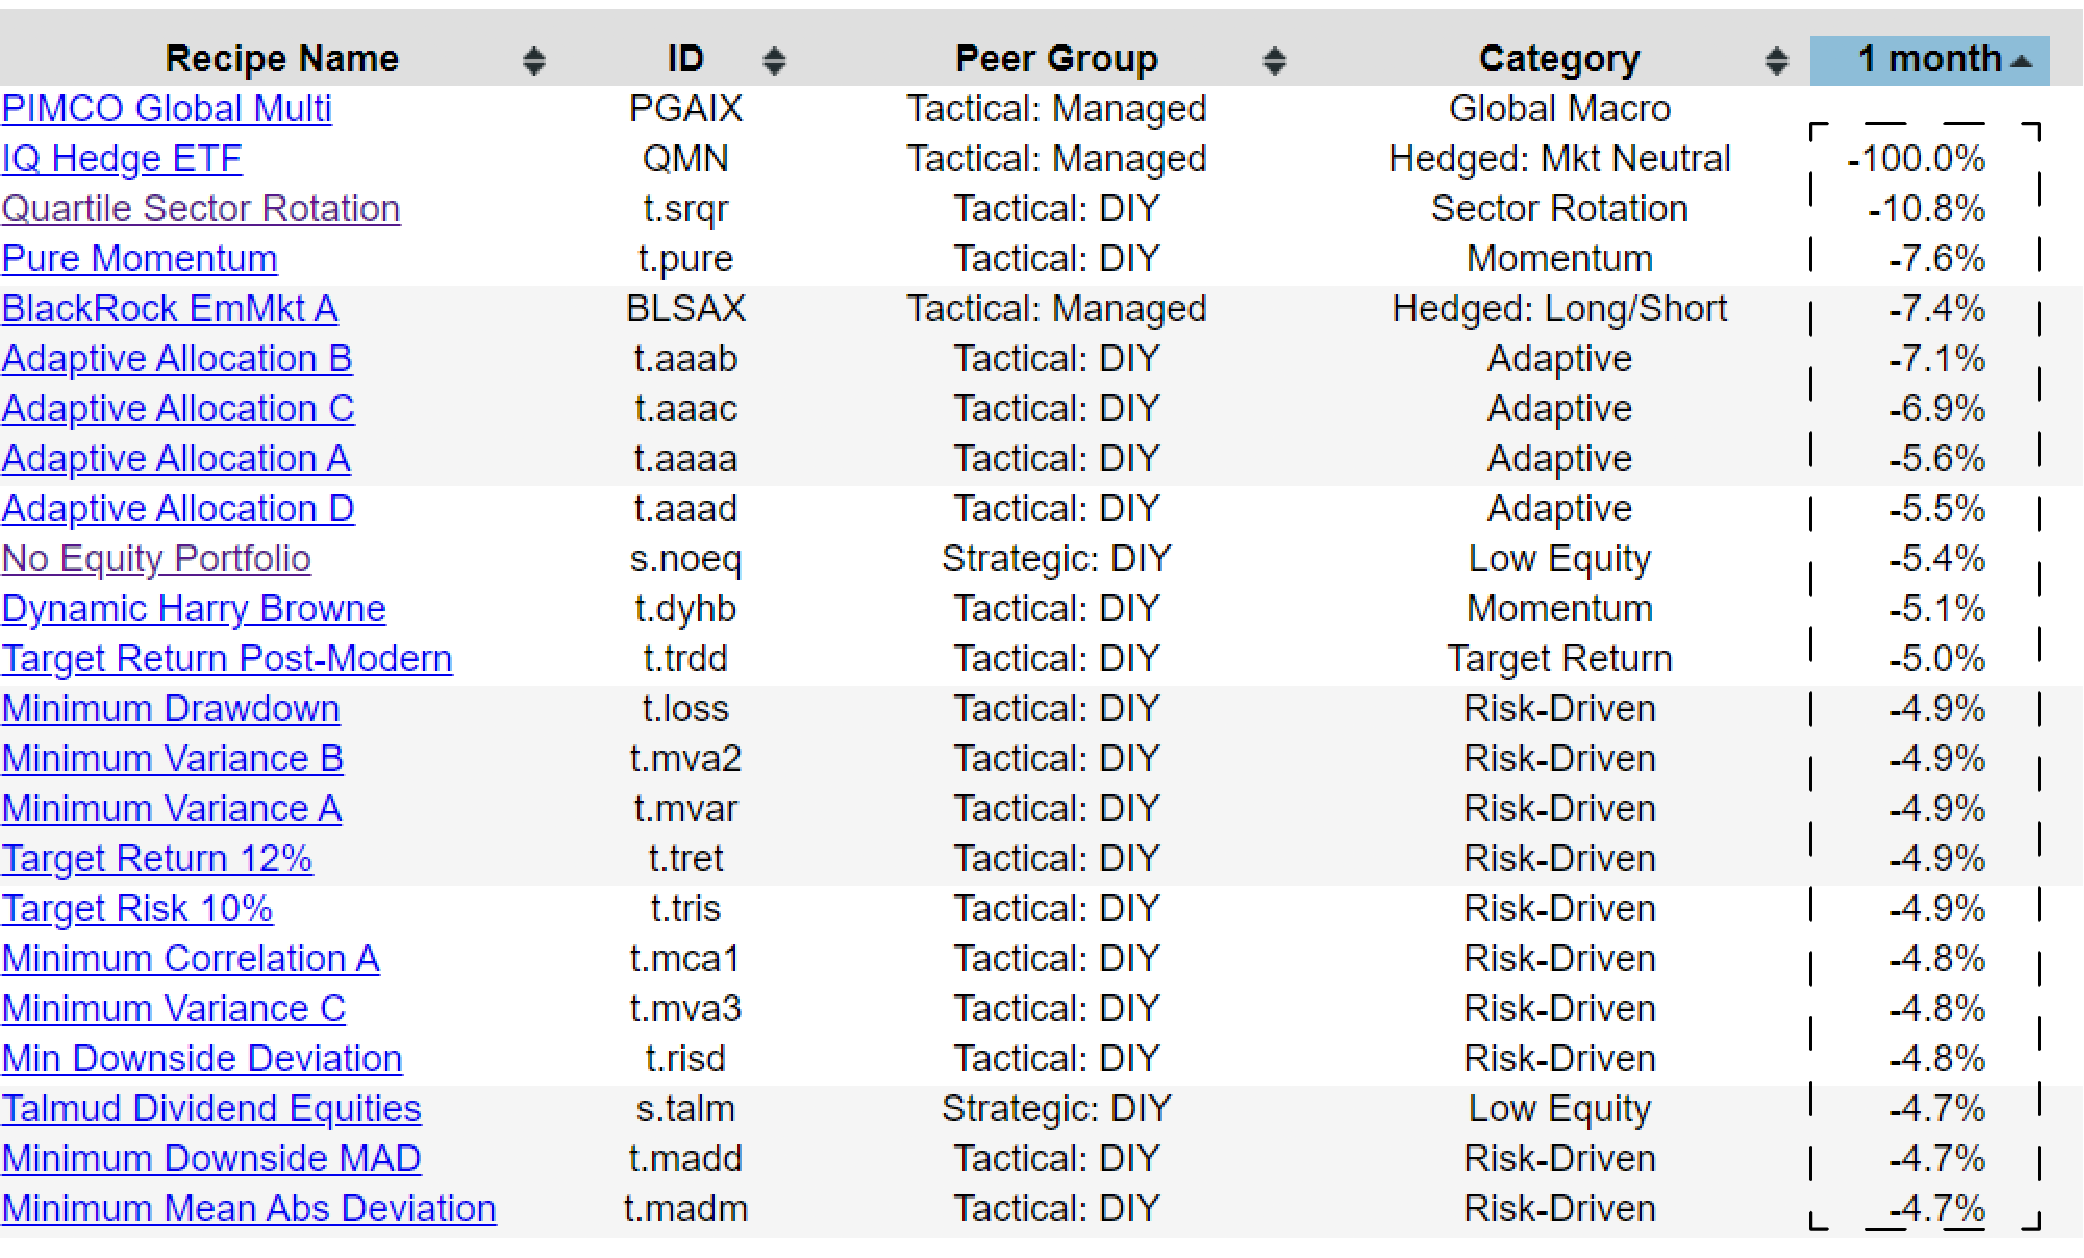
And if we look at the positives on the table below, we really only have six out of the hundreds of recipes that we track in this past month ending February 28th, 2023.
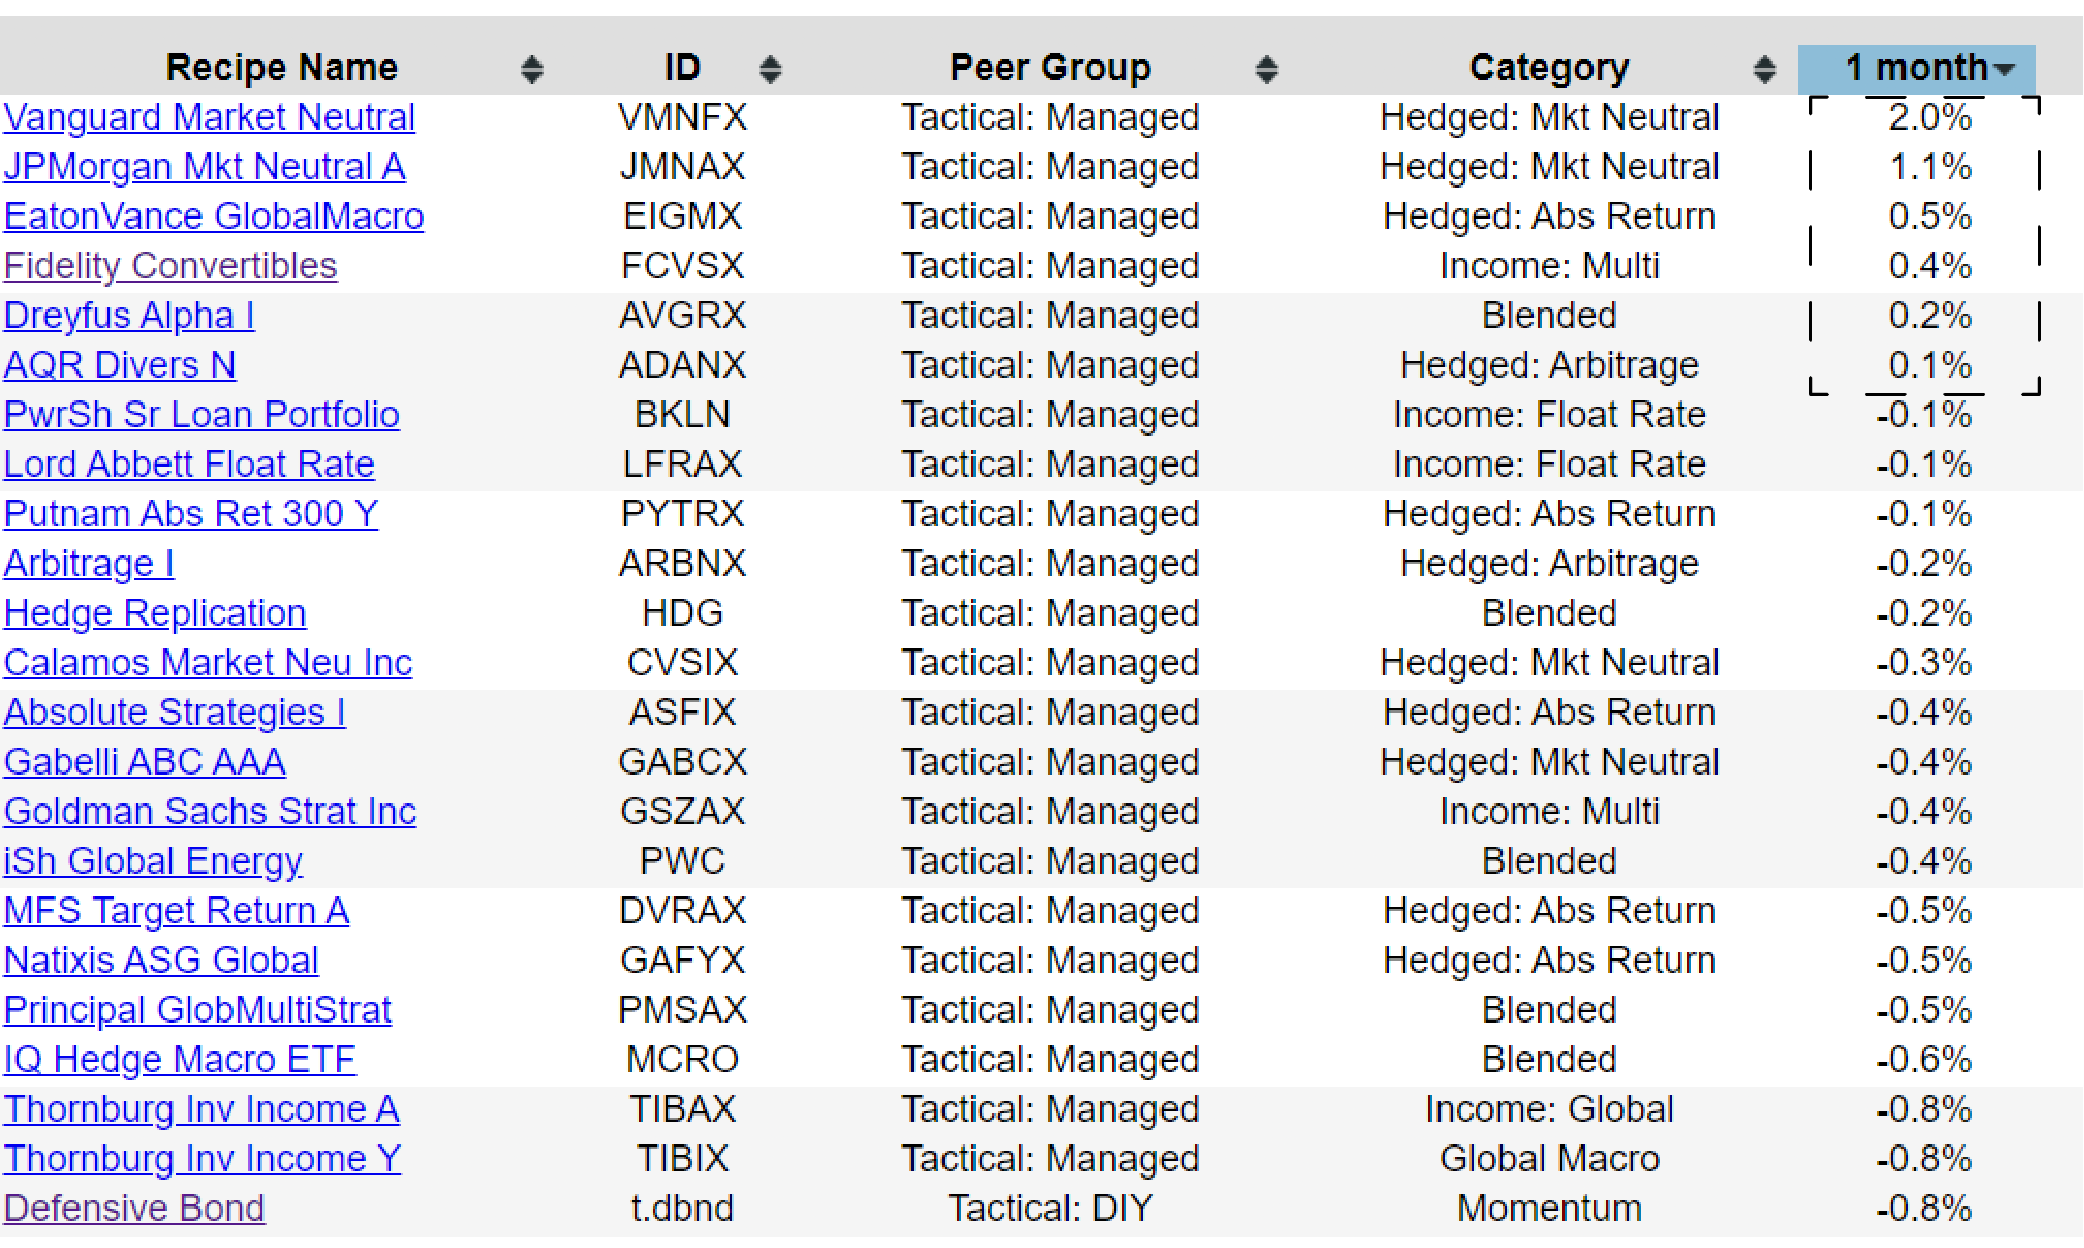
And also to note that in the table above, those top 22 down to the first tactical recipe, T.DBND, are all tactical managed funds and we can kind of see the themes or the categories that they fall into — hedged market neutral, multi-asset income fund, and blended funds. If it's any encouragement, they're acting as advertised, right? And they are bringing some market neutrality to their returns. And so, we could say that we could jump into one of these market neutral funds.
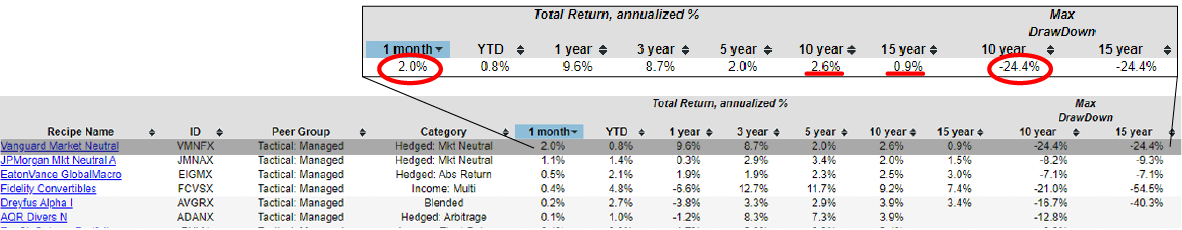
Keep in mind that for this interesting 2% return in February, you also have to deal with less than 1% return annualized over the past 15 years, which is really not that great. And even though that's a market neutral fund over the past 15 years, or even the past 10 years, at one point it was down 24.4% and that's a month-end drawdown. It could have been more or less during the middle of the month, but because we use month-end data, all of this drawdown is going to be based on the month-end numbers. Kind of reminder of these market neutral funds, they look good when they're good, but in the long term, understand that they really are balancing risk and return and some of them can have underwhelming returns on a longer-term basis.
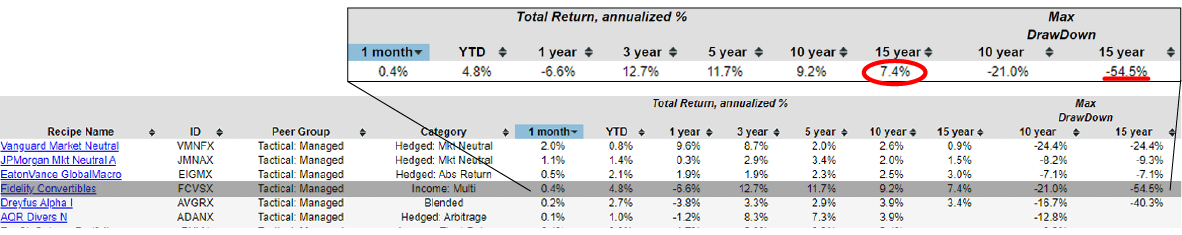
Now this Fidelity Convertibles (FCVSX), it's actually done 7.4% annualized over the past 15 years. It has a greater than 50% drawdown over the past 15 years. So that's something to look out for.
Top performing recipes over the past year
That's the top performing recipes over the past month. Let's look at the table below and the recipes over the past year. We can see that Quartile Sector Rotation (T.SRQR) has continued to do extremely well over the past year, although it had a brutal month in February and was down 10% just in that one month alone.
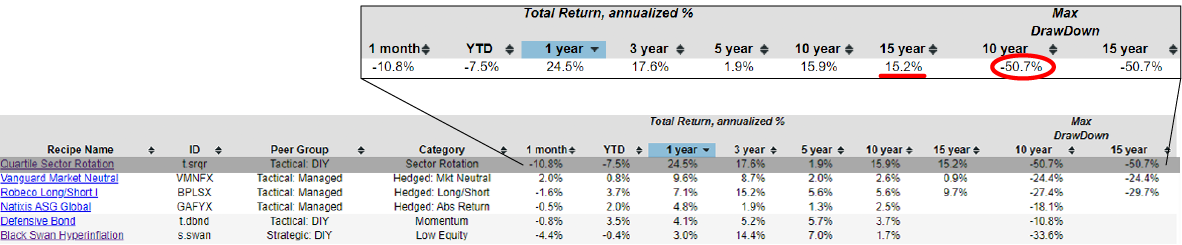
And it has exhibited more draw down. There's some risk that goes along with that, but over the past 15 years it's up 15.2% annualized. The risk of these highflyers has done extremely well over the last several months, but now here we're hitting a sharp downturn in just one month for that.
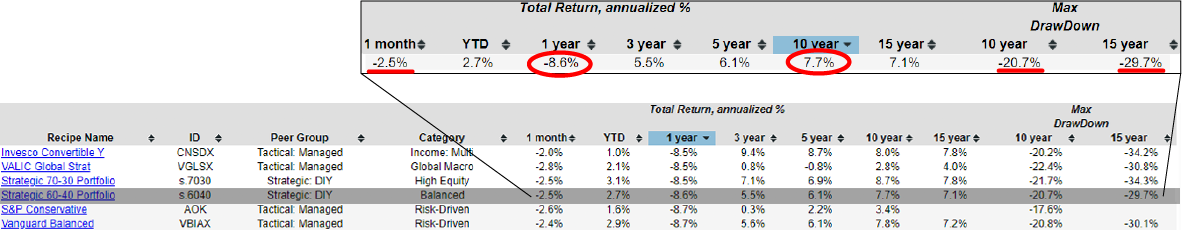
Let's look at the Strategic 60-40 Portfolio (S.6040) in the table above. This is a good benchmark, right? We have the Strategic 60-40 fund, which is quite a simple two-asset portfolio. And if we sort it by 10 years, the 60-40 fund over 10 years has done 7.7% return over the past 10 years, and it's down two and a half percent this month, but that's compared to some others and it's not that bad. The year to date, and over the past year, it's down 8.6%. One very simple filtering mechanism would be the portfolio that I'm looking at better than this 60-40 portfolio. And again, it's not without its drawdown. It's been down almost 30% over the past 15 years, at least at one point peak to trough. And then, over the past 10 years, the maximum drawdown is 20.7%. So, again, comes with some risk.
But one question I'd like to ask is, "Is there a risk versus return?" "Is there a portfolio with risk versus return that beats this two ETF strategic 60-40 portfolio?", which is rebalanced every month, but the core constituents don't change. It's really a static portfolio with just a little bit of monthly rebalancing to bring it back into true with the 60-40 allocation. And if you held a 60-40 two asset or two ETF’s portfolio, you could rebalance that quarterly or even annually and probably not have much of a detrimental effect on the overall portfolio performance.
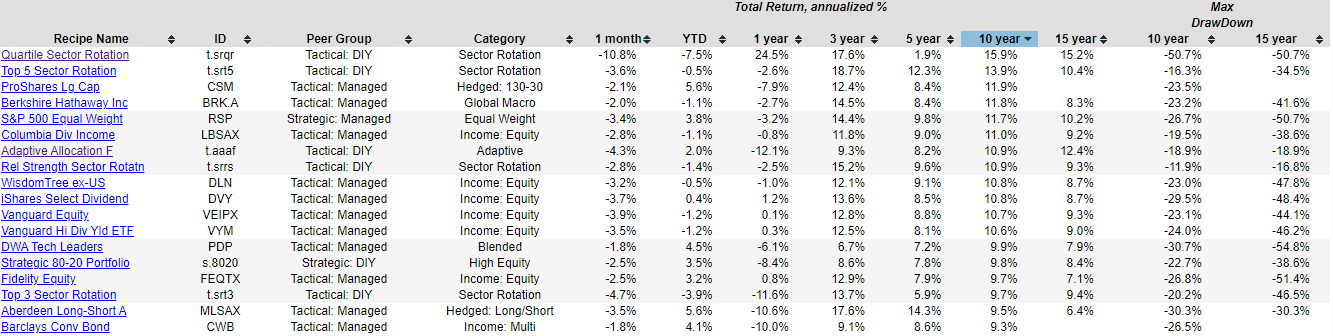
With this in mind of 7.7% and -8.6% over the past year, we can see anything that looks interesting, and we have some of the usual suspects. The t dot Tactical Asset Allocation Portfolios, we've got several Equity Income funds. And now keep in mind all of these because I've ranked by 10-year total return, all of these at 7.7% and above exceed 60-40, but that's not without a risk. So, we can see these drawdowns are quite dramatic sometimes.
A monthly spreadsheet is available to download
And this is a good time to remind you we have a spreadsheet, a downloadable spreadsheet available each month with all of this data.
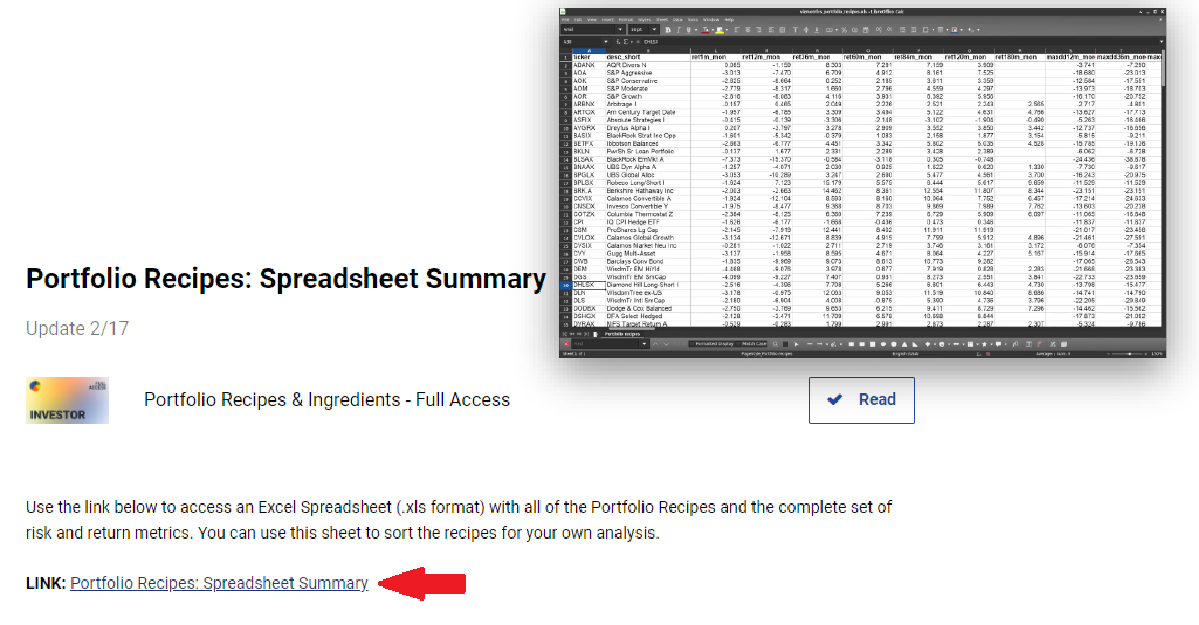
If you want to create your own scatter plots, or if you want to do your own ranking and sorting, you can use this spreadsheet, which has all the same data that you're seeing on the website, it's just in a tabular format. If you want to do a total return over the last 5 years, 10 years, and even 15 years. And if you sort all of that, you'll be getting the same thing we're doing here on the website. It's just in a bit of a more flexible format. So just keep that in mind that these spreadsheets are available to our subscribers.
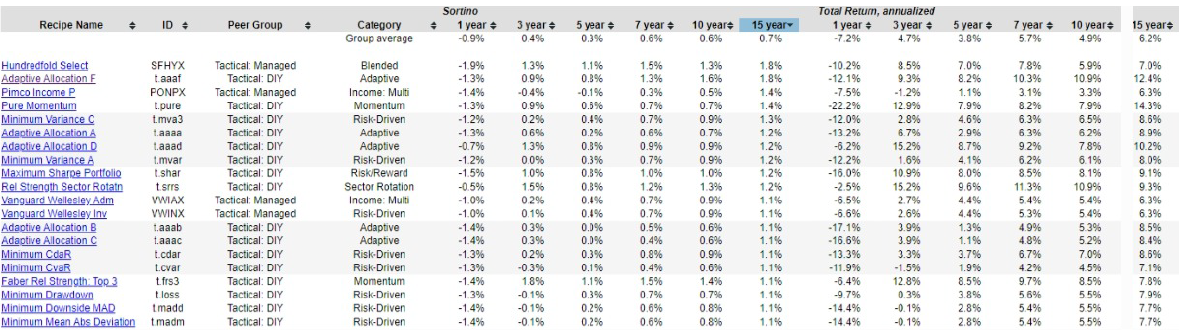
Now back to this idea of using the 60-40 fund as a rough benchmark. One risk versus return metric that encapsulates the downside deviation is Sortino Ratio. One approach would be to go into one of these is risk versus return metrics. And if we rank all of them by 15 years and the Sortino Ratio from best to worst for the last 15 years, and actually this is a 1.8% or 1.8.
And then if we look over here, we can see the total returns and also the Sortino Ratio. The Sortino Ratio doesn't use the standard deviation, it uses the downside deviation. So I think it's a better risk versus return metric than the Sharpe Ratio, which uses the standard deviation and which includes both the upside and the downside volatility, but it's really the downside volatility that we don't like, so the Sortino Ratio uses that as its risk measure and then compares it to taking to account the risk-free return with that formula.
The higher the Sortino Ratio, the better. And it's giving you a clear measure of "does this return justify itself in terms of the risk that's being taken on?". And we can see Hundredfold Select (SFHYX) is top of the list here, followed closely by T.AAAF or the Adaptive Allocation F (which just happens to be the sixth one that we created years ago. So that's why it's got the "F" suffix).
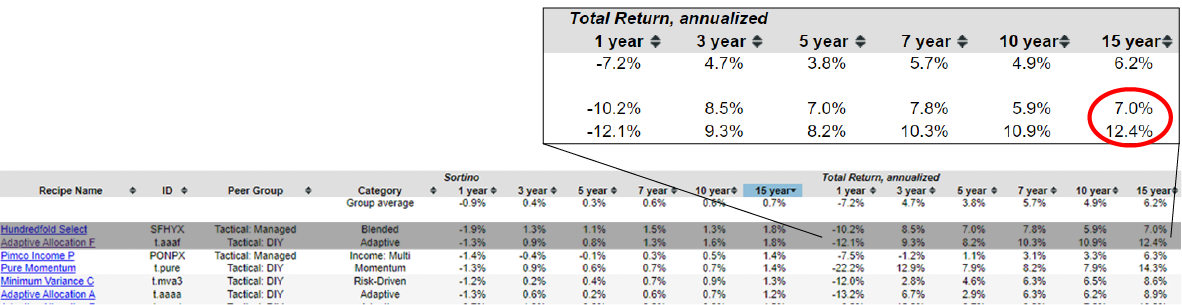
We can see here, if you want to look a little more closely, that the total return of the Hundredfold Select over the past 15 years is 7% annualized. It's had a bit of a rough run the past year two years than the Adaptive Allocation F, but Adaptive Allocation F has returned 12.4% annualized over the last 15 years.
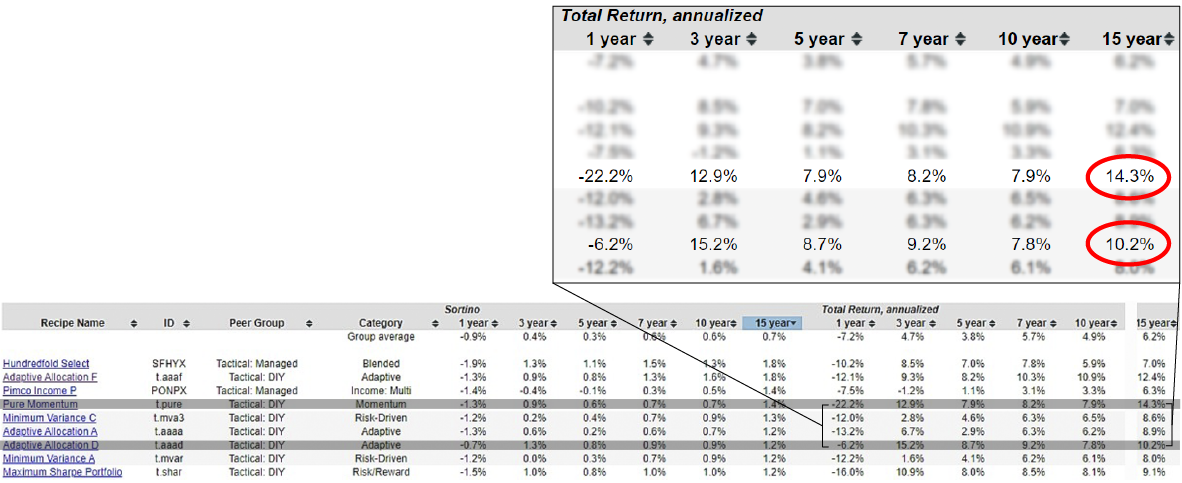
Here's this Pure Momentum (T.PURE) at 14.3% annualized. Here's another one, T.AAAD has done 10.2% over the last 15 years annualized. You can look at these total returns over the past 15 years, but view them considering the Sortino Ratio, which is going to give you the risk versus return analytics that are helpful.
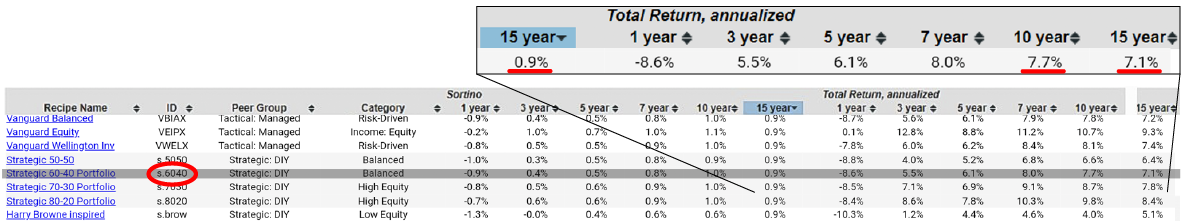
Let's look to see where 60-40 appears in this list from the table above. We've got the 60-40 benchmark, we can see that it's got a Sortino Ratio of 0.9, and there's 7.7% annualized over the past 10 years, 7.1% annualized over the past 15 years. A simple but effective way to ask what are the portfolios that are really delivering the value in terms of risk versus return. It's going to be this list beginning with Sortino Ratios of 0.9. And then some of these that are doing considerably better than that like 1.3, 1.4, 1.8.
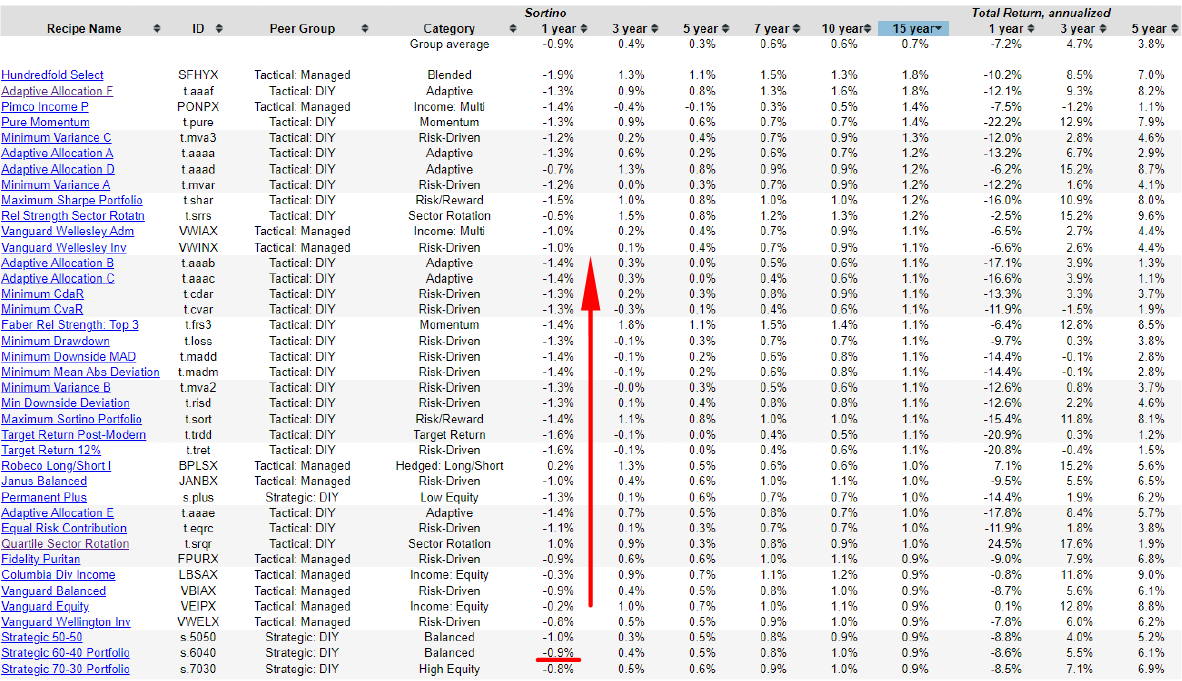
And if we look at the categories and peer groups in this list, it starts to show some themes here, right? We have Risk-Driven tactical portfolios, and we have some Adaptive tactical portfolios, and the set it and forget it type fund, Vanguard Wellesley, is a good balance of risk versus return all in one fund.
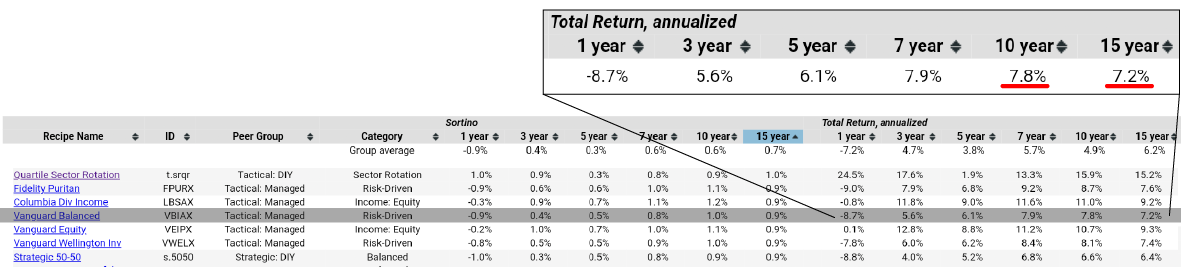
And here's the traditional Vanguard Balanced (VBIAX), which is really quite similar to the 60-40 fund and has done a bit better. Here it is, 7.7% and 7.8% over here, and 7.2% as opposed to the pure 60-40 fund with two ETFs. It outperformed this 60-40 benchmark that we use, and it's pretty similar with the same Sortino Ratio.
This is an impressive list to look at and it's got something really for everyone. If you want something that's managed by a single fund that you can invest in, these are mutual funds. The simple allocation funds that just have two ETFs in various ratios that are available here.
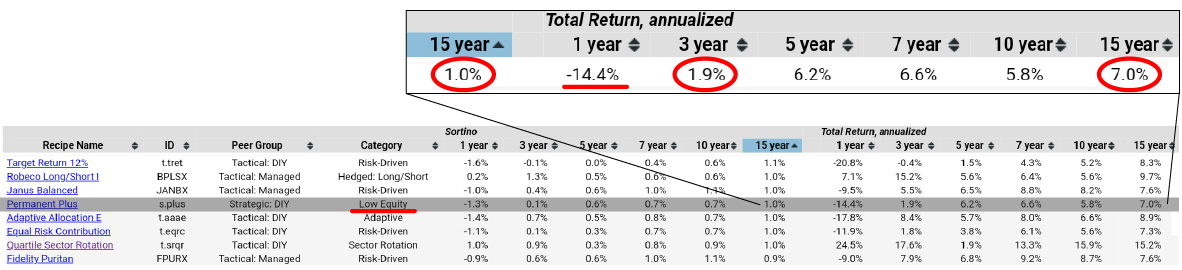
And there's also this Permanent Plus (S.PLUS), which can be worth a look if you're looking for a low equity portfolio that has some interesting characteristics.
So that's been a decent Sortino Ratio. It's had a bit of trouble this past month, but even the past year, past 3 years, it's still up and over the past 15 years it's been up to 7% annualized.
That's a look at using 60-40 as a benchmark also then applying Sortino Ratio to that to remind ourselves of some of these high performing portfolios in terms of risk versus return, because it's important, of course, not to just look at the latest return numbers because what goes up must come down and often comes down in most times.